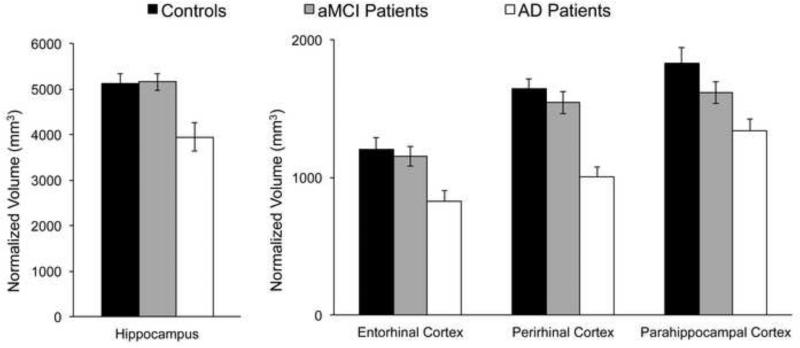
Figure 2.
Volume measurements for each medial temporal region of interest. Results normalized for individual variations in intracranial volume are shown separately for the control group (n=20), the amnestic Mild Cognitive Impairment group (aMCI, n=19), and the probable Alzheimer's disease group (AD, n=10).

