

Abstract
Overnourishment during the suckling period (small litter, SL) results in the development of adult-onset obesity. To investigate the mechanisms that underlie the development of insulin resistance in the skeletal muscle of young and adult female SL rats, the litter size was reduced to 3 female pups/dam (SL) while the control litter (CL) had 12 pups/dam from the postnatal day 3 until day 21. Protein content, mRNA expression and methylation status of the promoter region of key components in the insulin signaling pathway were determined in the skeletal muscle of SL rats. Overnutrition during the suckling period resulted in increased body weight gains, hyperphagia and adult-onset obesity as well as increased levels of serum insulin, glucose, and leptin in SL rats. No differences in the expression of total protein as well as tyrosine phosphorylation of insulin receptor β and glucose transporter 4 (GLUT4) were observed in skeletal muscle between two groups at both ages. A significant decrease of total insulin receptor substrate 1(IRS-1) and an increase in serine phosphorylation of IRS-1 were observed in skeletal muscle from adult SL rats. Hypermethylation of specific CpG dinucleotides in the proximal promoter region was observed for the Irs1 and Glut4 genes which correlated with the reduction in Irs1 and Glut4 mRNA levels in skeletal muscle of adult SL rats. Our results suggest that epigenetic modifications of the key genes involved in the insulin signaling pathway in skeletal muscle could result in the development of insulin resistance in SL female rats.
Keywords: Early overnutrition, Hyperinsulinemia, Epigenetics, DNA methylation, Insulin receptor substrate 1
1. Introduction
The alarming increase in the incidence of obesity is a major health concern. In the United States greater than 68% of the adult population is either overweight or obese [1]. The presence of obesity significantly increases the risk for the onset of several adult-onset metabolic diseases such as glucose intolerance, insulin resistance, type 2 diabetes, cardiovascular disorders, etc. [2–4]. Although genetics, sedentary life style and increased consumption of calorie-dense foods are conventionally considered to be the major factors contributing to the increased incidence of obesity [5], extensive epidemiological data and results from animal models increasingly suggest that altered nutritional experiences during early periods in life (fetal and immediate postnatal) predispose the individual for the later onset of metabolic disorders via the phenomenon of developmental/metabolic programming [6–8]. Developmental programming is the phenomenon by which a nutritional stress/stimulus overlapping with the critical window of organogenesis of target tissues permanently alters the physiology and metabolism of the organism [7, 9].
The pioneering work of Barker which was later corroborated by several other studies established that a malnourished pregnancy had a positive influence on the development of adult-onset diseases in the offspring [10–12]. Since organ development is not complete at birth and reaches maturation only in the suckling period [13, 14], altered nutritional experiences during this period alone can serve as an independent cue for metabolic programming effects. Studies from our laboratory have demonstrated that artificial rearing of neonatal rats on a high carbohydrate milk formula resulted in chronic hyperinsulinemia and adult-onset obesity in these rats [9]. Rat pups nursed by a diabetic [15] demonstrated several facets of the metabolic syndrome in later life. The long-term effects of overnourishment during the suckling period have been investigated by reduction of litter size to 3 pups/dam (small litter; SL). SL male rats were heavier and had increased levels of serum insulin and leptin during the suckling period compared to age-matched control rats [16]. These effects persisted in the post-weaning period culminating in the development of adult-onset obesity [16]. Several alterations in the hypothalamic regulation of body weight homeostasis including insulin and leptin resistance supported the obese phenotype in the SL male rats [17, 18].
Insulin plays a primary role in the regulation of glucose homeostasis by its action in the peripheral target tissues. Insulin signaling is a complex and a highly integrated network that impacts on several cellular processes [19]. The binding of insulin to its cognate receptor in the membrane results in the phosphorylation of the insulin receptor substrate proteins (IRS proteins) and the subsequent activation of phosphatidyl 3-kinase (PI3K)-AKT/protein kinase B pathway which is mainly responsible for most of the metabolic effects of insulin [20]. Glucose uptake into the cell is dependent upon the translocation of glucose transporter 4 (GLUT4) from its cytosolic location to the plasma membrane which is facilitated by activated AKT [20]. Since approximately two thirds of total body glucose uptake occurs in skeletal muscle [21], aberrations in insulin-stimulated glucose uptake in skeletal muscle can play a major role in the pathogenesis of insulin resistance. This pathological condition has been shown to be associated with alterations in the components of the insulin signaling cascade including reduced tyrosine phosphorylation of the insulin receptor and IRS proteins and decreased activation of the PI3K/AKT pathway [22].
The molecular mechanisms that support the development of insulin resistance as a consequence of altered dietary experiences during early life are not well understood. In this context alterations at the level of epigenetic regulation of gene expression has been suggested as a plausible mechanism by which altered dietary experiences during early life predispose for increased risk for disorders such as type 2 diabetes [23]. The two important mechanisms involved in epigenetic regulation of gene expression include DNA methylation and histone tail modification [24]. Increased methylation of specific cytosine residues in CpG dinucleotides in the vicinity of the proximal promoter region has been suggested to inhibit gene transcription due to modification of the structure of DNA resulting in inhibition of binding of the transcription factors [24]. Histone tail modification including acetylation and methylation of specific lysine residues is another component involved in the epigenetic regulation of gene transcription [25].
Several reports indicate that environmental insults/stimuli during early developmental periods permanently influence the transcriptional activity of target genes via epigenetic modification of specific gene promoters. Alterations in the methylation status CpG dinucleotides have been shown for the hypothalamic proopiomelanocortin and insulin receptor (Insr) genes in SL rats due to overnourishment in the suckling period [26, 27]. Intrauterine growth restriction (IUGR) and maternal protein malnourishment during pregnancy have been shown to cause alterations in skeletal muscle GLUT4 expression. This has been attributed to specific changes in the acetylation and methylation of specific amino acid residues in the N-terminal tail of histone H3/H4 [28, 29].
Although the aberrations in hypothalamic mechanisms supporting the development of obesity in SL rats have been studied in detail [30], there are not many reports on the altered mechanisms supporting the development of insulin resistance in this model. A reduction in the insulin-stimulated glucose uptake in the adipose tissue of SL male rats has been reported [31]. This defect has been attributed to decreased expression of some of the components of the insulin signaling pathway in this tissue [31]. Although skeletal muscle is a major site for glucose uptake, there are no studies focusing on the development of skeletal muscle insulin resistance as a consequence of overnourishment during the suckling period particularly in female SL rats. The objective of this study was to investigate the mechanisms that underlie the development of skeletal muscle insulin resistance in suckling period and post-weaning period in female SL rats. Our results indicate that overnutrition during suckling period resulted in decreased protein content and aberrations in transcriptional control of genes involved in the insulin signaling pathway in skeletal muscle and that such changes could contribute to the development of insulin resistance in skeletal muscle in SL female rats.
2. Methods and Materials
2.1. Experimental model
The Institutional Animal Care and Use Committee of University at Buffalo approved all animal protocols. Untimed pregnant Sprague-Dawley rats were obtained from Charles River Laboratories (Wilmington, MA, USA). They were housed individually under controlled conditions of temperature (23°C) and a 12 h light/dark cycle with ad libitum access to a standard rodent laboratory chow (3.1 Kcal/g) (Harlan Teklad, South Easton, MA, USA). Because the number of pups in a litter can have a long-term effect on growth, only pups belonging to a litter whose size was between 9 to 14 pups/dam were used in this study. One day after birth, the litter size was adjusted to 12 pups/dam. On postnatal day 3, pups were assigned randomly to control litter (CL) and small litter (SL). For the SL group, litter size was adjusted to 3 female pups/dam and they were nursed by their natural dams. CL consisted of 12 female pups/dam. For this purpose female pups from several mothers were pooled and were randomly assigned to dams. One set of experiments was performed on 21 day-old females. For experiments on adult animals, both SL and CL females were weaned on postnatal day 21 on a standard rodent laboratory chow and water ad libitum. Rats were anesthetized by an ip injection of ketamine (75 mg/kg body wt) and xylazine (10 mg/kg body wt) followed by decapitation. Truck blood was collected in non-heparinized tubes and serum was separated and stored at −20°C. Region including gastrocnemius and soleus muscles was dissected out and immediately frozen in liquid nitrogen and stored at −80°C.
2.2. Body weight and food intake
In order to determine the immediate effects of overnourishment due to litter size reduction, body weights of SL and CL pups were recorded from postnatal day 3 to postnatal day 21. For the adult study, body weights were measured on a weekly basis. Food intake was also recorded for both groups in the post-weaning period on a weekly basis.
2.3. Serum glucose, insulin, and leptin levels
Serum glucose levels were determined using a glucose meter (Abbott, Libertyville, IL, USA). Serum insulin and leptin levels were measured using radioimmunoassay kits (Millipore, Billerica, MA, USA) according to manufacturer’s instructions.
2.4. Immunoblotting
Skeletal muscle samples were homogenized in ice-cold lysis buffer (50 mM HEPES pH 8.0, 150 mM sodium chloride, 1 mM sodium orthoranadate, 30 mM sodium fluoride, 10 mM sodium pyrophosphate, 10 mM EDTA, 1% Triton 100X, 10 μg/ml aprotinin, 10 μg/ml leupeptin, and 10 μg/ml PMSF) and the supernatant was obtained by centrifugation. Total protein in the supernatant was measured by the BCA method (Bio-Rad, Hercules, CA, USA). Equal amount of protein (10~50 μg) for each preparation was added to an equal volume of 2x Laemmli sample buffer and separated using sodium dodecyl sulfate-polyacrylamide gel electrophoresis (SDS- PAGE). Protein was transferred on the nitrocellulose membrane. The membrane was blocked with 5% non-fat dry milk in 0.1% Tween-Tris buffered saline and then incubated in 5% dry milk Tween-Tris buffered saline with IR-β, IRS-1, phos-IRS-1 (Ser 302), Phosphoinositide-dependent kinase 1 (PDK1), phos-PDK1 (Ser 241), GLUT4, and β-tubulin antibodies. β-tubulin was used as loading control. Membranes were then washed and incubated with horseradish peroxidase- conjugated second antibody in Tween-Tris buffered saline with 5% non-fat dry milk. Protein bands were visualized using Enhanced Chemiluminescence kit (Perkin Elmer, Wellesley, MA, USA) and densitometry analysis was performed using the Quantity One program (Bio-Rad, Hercules, CA, USA).
2.5. Immunoprecipitation
Skeletal muscle supernatants (0.5 mg of protein) were treated with 2 μg of anti- phosphotyrosine antibody (Upstate Biotechnology, Lake Placid, NY, USA). Immunocomplexes were allowed to form during overnight incubation at 4°C. One hundred microliter protein A- agarose slurry (50%) was added to immunocomplexes and further incubated on a shaking platform for 3 h at 4°C. Immunocomplexes bound to agarose beads were collected and the pellet was suspended in 1 ml of cold phosphate-buffered saline. Following the washing step, the pellet was suspended in 50 μl Laemmli buffer (2x) and heated for 5 min at 100 °C. Twenty microliters of eluted sample was resolved on SDS-PAGE and processed for western blot analysis as described above.
2.6. Real-Time PCR
Total RNA was isolated from skeletal muscle using TRIzol reagent-phenol-chloroform procedure (Gibco BRL, Rockville, MD, USA) and 1 μg mRNA was reverse transcribed into cDNAs by using the iScript cDNA kit (Bio-Rad, Hercules, CA, USA). Levels of Insr, Irs1, and Glut4 mRNAs in skeletal muscle were quantified using the MyiQ Real-time PCR system (Bio-Rad, Hercules, CA, USA). Primer sequences are shown in Table 1. Primer specificity was confirmed by running a regular PCR for 35 cycles and the products were visualized after electrophoresis in an agarose gel. The PCR reaction included the following components/condition: each primer at a concentration of 10 μM, 1μl cDNA template, and iQ SYBR Green supermix and amplified for 40 cycles. Each cDNA sample was run in triplicate and 18S primers were included in each run to correct sample to sample variation and to normalize mRNA levels (quantumRNA classic 2 18S Internal Standard, 324 bp; Ambion Inc., Austin, TX, USA). The relative mRNA level was calculated according to the comparative ΔΔCt method.
Table 1.
Primers for gene expression analysis
| Genes | Primer sequence (5′→3′) |
|---|---|
| Insr | F: ATCTCCATCCCCCTGATAACTGTC R: ATGTGGGTGTAGGGGATGTGTTCA |
| Irs1 | F: TGTGCCAAGCAACAAGAAAG R: ACGGTTTCAGAGCAGAGGAA |
| Glut4 | F: CCGAAAGAGTCTAAAGCGCCT R: CGTTTCTCATCCTTCTTCAGCTCA |
2.7. DNA Methylation analysis
Amplification and cloning of control regions: For the preparation of varying levels of control DNA samples, liver genomic DNA extracted from an adult female rat was amplified using Taq polymerase (Fermentas, Pittsburgh, PA, USA). Genomic DNA fragments were amplified and purified with QIAquick Gel Extraction Kit (Qiagen, Valencia, CA, USA). The purified DNA was ligated into the vector pCr2.1-TOPO and then transformed into competent cells E. coli TOP10F′ (Invitrogen, Grand Island, NY, USA). Analysis of transformants was determined by the blue/white selection and plasmids were extracted with QIAprep Spin Miniprep Kit (Qiagen, Valencia, CA, USA). Restriction enzyme EcoRI was used for plasmid DNA digestion (Fermantas, Pittsburgh, PA, USA). Plasmid DNA containing the promoter insert was artificially methylated with SssI (CpG) methylase (New England Biolab, Ipswich, MA, USA) and S-adenosylmethionine. The methylated plasmid DNA was considered as 100% methylated DNA. Serial dilutions of artificially methylated DNA in unmethylated DNA were made in order to get 0, 25, 50, 75, and 100% control DNA. All DNA samples were bisulfite treated using the EZ DNA Methylation kit (Zymo Research, Orange, CA, USA). Primers of control DNA in three genes were: forward primer Insr (667 bp): 5′-ACCTTTCTAAATCGGCAGTTCGGG-3′ and reverse primer 5′-ACATACTCCGCGAGAAGGTCGCT-3′ (annealing 50°C, 35 cycles); forward primer Irs1 (768 bp): 5′-CACGTGTTTTGCTCCTCTGGAGTGAGACGGC-3′ and reverse primer: 5′-CAGCAGAGAAGGAGCTATGGTGCATCCCTTG-3′ (annealing 69°C, 35 cycles); forward primer Glut4 (509bp): 5′-GCTGGCATTAATCTTAGGGTTG-3′ and reverse primer 5′-CACGGGTTGTCTAGGCTGAATA-3′ (annealing 50°C, 35 cycles).
Sequenom MassARRAY quantitative methylation analysis: Genomic DNA (750 ng) extracted from skeletal muscle samples of CL and SL females was treated with sodium bisulfite using the EZ DNA methylation kit (Zymo Research, Orange, CA, USA). The primers were designed using Methprimer. Each reverse primer had a T7-promoter tag for in vitro transcription and the forward primer was tagged with a 10mer to balance PCR. Amplification of 1 μl bisulfite-treated DNA (~10 ng/μl) was performed using HotStar Taq Polymerase (Qiagen, Valencia, CA) in a 5 μl total volume using PCR primers at a final concentration 200 nM. The sequences of the primers used are shown in Table 2. PCR amplification was 95°C for 15 min hot start, 45 cycles of denaturation at 94 °C for 20 s, annealing at 60°C for 30 s, and extension at 72°C for 1 min. The PCR products were treated with Shrimp Alkaline Phosphatase and then used for in vitro transcription and a RNase A cleavage reaction. Reaction products were dispensed onto a 384-element SpectroCHIP bioarray (Sequenom, SanDiego, CA, USA) using a MassARRAY Nanodispenser and analyzed by the MassARRAY system (Sequenom, SanDiego, CA, USA). Each individual well corresponding to the methylation level was processed and analyzed using the EpiTyper software v1.0 (Sequenom, SanDiego, CA, USA) to create quantitative results for each CpG position or an aggregate of multiple CpG positions. The final result was the mean value of CpG methylation and presented as percent methylation.
Table 2.
Primers for DNA methylation analysis
| Genes | Modified Primer (5′→3′) | No. of CpG sites |
|---|---|---|
| Insr | F: GGGTTTTGGGGATAGTTTTGG R: CAATCCCTTCCCTACCTTAATCC |
32 |
| F: GGGAGGGTATTTGGGTTGGT R: CCTCTAAAATTAAAAACTCCACAAAAA |
24 | |
| Irs1 | F: TTGGAGTTAGGGGTAGGGATG R: CCCTCCTCCTCCTTCTCCTC |
21 |
| Glut4 | F: TGGTTAATGGGTGTTGTGAAGG R: AAACCCAACCCCCAAAATCT |
15 |
2.8 Statistical analysis
Results are expressed as means ± standard error of the mean (SEM). Statistical analysis of the difference between SL and CL groups was determined by using Student’s t-test. A P value less than 0.05 is considered to be statistically significant.
3. Results
3.1. Effects of early postnatal overnutrition on body weight and food intake of female rats during development
To investigate the effects of overnourishment during early life on long-term effects in later life, the litter size was adjusted to 3 female pups/dam on postnatal day 3. The average body weights were not different between CL (12 pups/dam) and SL (3 pups/dam) female pups on postnatal day 3. SL female pups demonstrated increased body weight gains from postnatal day 8 onwards in comparison with the age-matched CL female pups. The maximum difference (26%) in body weight gain in female SL rats was evident on postnatal day 21 (51.8g for CL rats vs. 65.4g for SL rats) (Fig. 1A). Significant difference in body weight was also observed between CL and SL female rats during the post-weaning period (Fig. 1B). By the age of 140 days, SL rats were 18% heavier than CL rats. Weekly food intake was measured after weaning until 15 weeks of age. Food consumption in SL group was significantly higher at postnatal weeks 4, 8, 9, 13, and 14 only (Fig. 1C); however, the accumulative food intake over the entire post-weaning period was significantly higher in SL group (Fig. 1D), suggesting that the SL female rats displayed an obese phenotype because of their hyperphagia.
Fig. 1.

Body weight of control litter (CL) and small litter (SL) female pups during the suckling period (A), the pos-tweaning period (B), mean weekly food intake (C) and total food intake (D) during the post-weaning period. Results are expressed as means ± S.E.M. (n: for A 18, B 12, C and D 8). * P < 0.05.
3.2. Serum levels of insulin, leptin and glucose
Elevated insulin levels are an early sign in the development of insulin resistance. Compared to age-matched CL females, female SL rats showed higher basal serum insulin levels, 178% and 167%, at 21 days and 140 days of age, respectively (Fig. 2A). Serum glucose and leptin levels were not different between two groups of females on postnatal day 21 but were significantly increased by 142% and 176% in adult SL female rats, respectively (Fig. 2B & C).
Fig. 2.
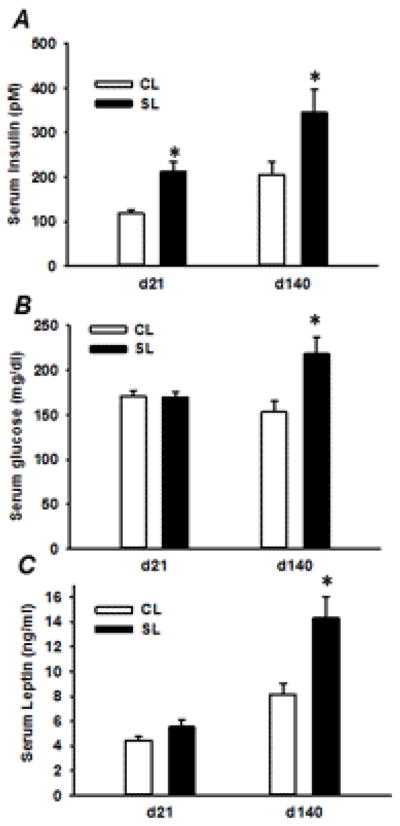
Serum insulin (A), glucose (B) and leptin (C) levels for CL and SL females on postnatal days 21 and 140. Results are expressed as means ± S.E.M. (n=9–12/group). * P < 0.05.
3.3 Effects of early postnatal overnutrition on protein levels of components of the insulin signaling pathway from skeletal muscle in 21 day- and 140 day-old SL female rats
The levels of key proteins involved in the insulin signaling pathway (IR-β, p-IR-β, IRS-1, p-IRS-1, PDK1, p-PDK1, and GLUT4) were measured by Western blotting. The amount of IR-β protein and levels of tyrosine phosphorylated IR-β were not affected by early postnatal overnutrition under basal condition on both postnatal day 21 and 140 (Fig. 3A–F). However, significant decreases in protein content of IRS-1 and phosphorylation of Ser 302 (P < 0.05) were observed in skeletal muscle from 21 day-old SL female rats, in comparison with age-matched CL rats (Fig. 4A, B, D). There were no significant differences in the protein levels of tyrosine phosphorylated IRS-1 between the two groups of rats on postnatal day 21 (Fig. 4C). In the case of adult SL rats, an approximately 50% decline in the protein level of IRS-1 (P < 0.05) was observed compared to age-matched CL rats (Fig. 4E, F). In contrast to 21 day-old SL rats, early postnatal overnourishment resulted in a significant decrease in tyrosine phosphorylation of IRS-1 and a significant increase in phosphorylation of IRS-1 on Ser 302 (P < 0.05) in adult SL female rats compared to age-matched CL rats (Fig. 4G, H). Early postnatal overnutrition had no effect on the protein content of PDK1 and p-PDK1 in both the groups at two different ages (Supplemental Fig. 1). The level of total GLUT4 protein expression (Supplemental Fig. 2) was also not affected by early postnatal overnutrition in young and adult CL and SL females.
Fig. 3.

Immunodectection of IR-β and p-IR-β (Tyr) in skeletal muscle from 21 day- and 140 day-old CL and SL female rats. The representative blots of two rats at two different ages are shown in A and D. The IR-β and p-IR-β relative levels were quantified by scanning densitometry of the bands (B, C, E and F). Results are expressed as means ± S.E.M. (n=6–8/group). * P < 0.05.
Fig. 4.

Immunodectection of IRS-1, p-IRS1 (Tyr) and p-IRS-1 (Ser 302) in skeletal muscle from 21 day- and 140 day-old CL and SL female rats. The representative blots of two rats at two different ages are shown in A and E. The IRS-1, p-IRS-1 (Tyr), and p-IRS-1 (Ser 302) relative levels were quantified by scanning densitometry of the bands (B–D and F–H). Results are expressed as means ± S.E.M. (n=6–8/group). * P < 0.05.
3.4. Effects of early postnatal overnutrition on mRNA levels in skeletal muscle in 21 day-and 140 day-old SL rats
To evaluate whether the changes in protein content in skeletal muscle is associated with alterations in the levels of mRNA, quantitative PCR (Real-time PCR) was performed in 21 day- and 140 day-old CL and SL female rats. Early postnatal overnutrition had no significant effect on Insr skeletal muscle mRNA levels between the two groups of rats at both ages (Fig. 5A, B), paralleling the results on the protein content as determined by western blot analysis (Fig. 3B, E). A significant reduction in the mRNA levels of Irs1 (P < 0.05) was observed in skeletal muscle from young and adult SL female rats (Figs. 5A, B), paralleling the decline in IRS-1 protein content (Fig. 4B, F). Although there was a significant increase (P < 0.05) in the mRNA levels of Glut4 in skeletal muscle of 21 day-old SL rats (Fig. 5A), a marked decline in Glut4 mRNA levels (~80%) was observed in adult SL female rats compared to age-matched CL rats (Fig. 5B).
Fig. 5.
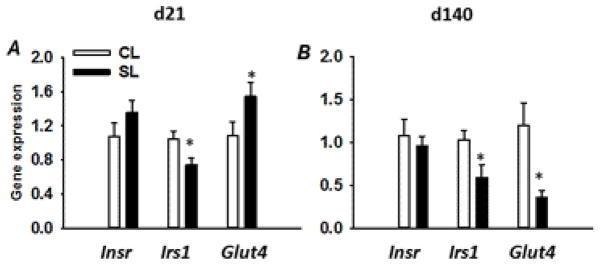
Levels of Insr, Irs1, and Glut4 mRNAs in skeletal muscle from 21 day- and 140 day-old CL and SL female rats determined by real-time PCR. mRNA levels are expressed as mean ratio to control after normalization with 18S mRNA levels. Results are expressed as means ± S.E.M. (n=7–8/group). * P < 0.05.
3.5. Analysis of specific CpG dinucleotides in the promoter region
Based on the above observations, DNA methylation analysis of specific CpG dinucleotides in the promoter region of the Insr, Irs1, and Glut4 genes was performed in order to determine if this mechanism contributes to the altered expression of Irs1 and Glut4 in young and adult SL female rats. TRNASFAC, version 8.3 was used to identify putative transcription factor binding sites in the promoter regions that were analyzed for CpG methylation status for the three genes investigated in this study.
Insr promoter methylation pattern in the skeletal muscle of CL and SL female rats: DNA methylation analysis was performed on a segment of the proximal Insr promoter (−686 bp to −157 bp) harboring 43 CpG dinucleotides (Supplemental Fig. 3). Analysis of CpG dinucleotides in the promoter segment indicated that the overall methylation levels in both CL and SL rats were very low except CpG position 36 in 21 day-old SL rats (Supplemental Fig. 3). Although the degree of methylation in the Insr promoter region was low, significant differences could be observed in the degree of methylation for specific CpG dinucleotides. In the case of 21 day-old rats, methylation at CpG positions 5, 8, and 36 were significantly increased in the SL group (P < 0.05). In contrast, in skeletal muscle of 140 day-old SL rats (Supplemental Fig. 3), CpG positions 2–4 and 8 showed a significant reduction (P<0.05) in methylation compared to corresponding CpG positions in the Insr promoter in the skeletal muscle of age-matched CL rats. Although significant changes were observed in the specific CpG positions of the Insr promoter at two different ages, they could not be correlated with the mRNA expression of Insr.
Irs1 promoter methylation pattern in the skeletal muscle of CL and SL rats: DNA methylation analyses were performed on samples from skeletal muscle of 21 day-old and 140 day-old CL and SL female rats. We focused on a 281 bp promoter region that ranged from −198 bp to +83 bp including 21 CpG dinucleotides (Fig. 6A). The overall methylation levels in the Irs1 promoter of both CL and SL groups were very low. The degree of methylation ranged from 1.87% (CpG positions 18–20) to 6.88% (CpG positions 15–17) in 21 day-old rats and 1% (CpG position 13) to 6.2% (CpG positions 15–17) in 140 day-old rats. There was no significant difference in the level of methylation in any CpG dinucleotide between the two groups of rats on postnatal day 21 (Fig. 6B). In adult skeletal muscle, the methylation status was significantly increased at CpG positions 8, 9–12, and 15–17 in 140 day-old SL rats (P < 0.05) compared to the values in age-matched CL rats (Fig. 6C). The hypermethylation in the specific CpG positions of Irs1 promoter correlated with the observed decrease in the mRNA levels of Irs1 (Fig. 5B).
Fig. 6.
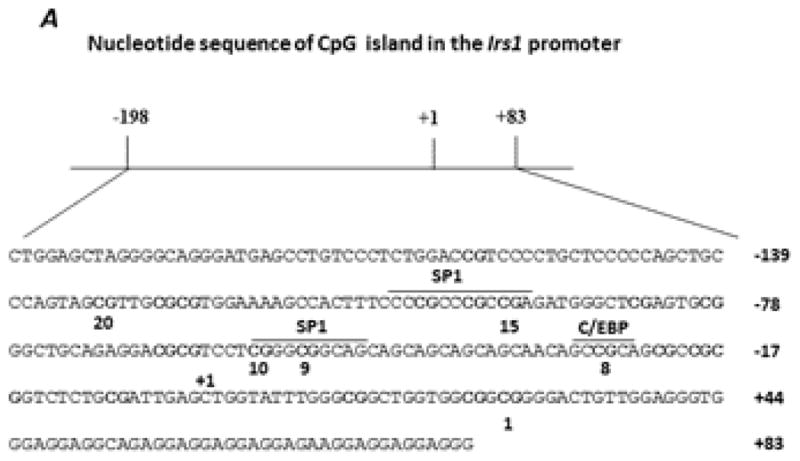

Sequence of the Irs1 promoter region showing the position of the CpG dinucleotides and the binding sites for the putative transcription factors (A) identified using TRANSFAC, Version 8.3. B and C: methylation analyses for the Irs1 promoter in CL and SL skeletal muscle from 21 day- and 140 day-old female rats, respectively. Data are means ± S.E.M. (n=8 in 21 day-old rats; n=12 in 140 day-old rats). * P < 0.05.
Glut4 promoter methylation pattern in the skeletal muscle of CL and SL rats
A segment of the Glut4 promoter encompassing −98 bp to +266 bp including 15 CpG dinucleotides (Fig. 7A) was subjected to DNA methylation analysis. We found a significant reduction (P < 0.05) in methylation at CpG position 5 in 21 day-old SL rats compared to the corresponding position in the age-matched CL rats (Fig. 7B); this could reflect a significant increase in the mRNA expression of Glut4 (Fig. 5A). In the adult skeletal muscle, although the overall methylation levels in CpG positions were below 5% (Fig. 7C), we found the methylation status increased 2.6 fold (P < 0.05) at CpG positions 13–14 in 140 day-old SL rats compared to the values in age-matched CL rats. The hypermethylation in the specific CpG position of the Glut4 promoter correlated with the significant decrease in the mRNA levels of Glut4 in adult SL females (Fig. 5B).
Fig. 7.


Sequence of the Glut4 promoter region showing the position of the CpG dinucleotides and the binding sites for the putative transcription factors (A) identified using TRANSFAC, Version 8.3. B and C: methylation analyses for the Glut4 promoter in CL and SL skeletal muscle from 21 day- and 140 day-old female rats, respectively. Data are means ± S.E.M. (n=8 in 21 day-old rats; n=12 in 140 day-old rats). * P < 0.05.
4. Discussion
Overnourishment during the suckling period (small litter model) has been shown to result in persistent overweight, hyperinsulinemia and hyperleptinemia [16, 32]. Although the hypothalamic mechanisms underlying the obese phenotype have been extensively investigated in this model [27, 33–35], alterations in the insulin signaling cascade in peripheral tissues have not been investigated to the same extent. There is a report on the development of insulin resistance in adipose tissue from the male SL rat [31]. However, there are no studies on insulin action in the peripheral tissues in the female SL rat. Our investigation in this study focused on the immediate as well as the long-term consequences of overnourishment in the suckling period on insulin signaling in the skeletal muscle of female SL rats and indicated that such an altered nutritional experience impacted on the expression of some of the key components that play a major role in the insulin signaling pathway.
Altered nutritional experiences in early periods of life have been shown to result in defects in the insulin signaling mechanism. For example, it has been shown that malnourishment during pregnancy results in the onset of type 2 diabetes in the adult offspring [36]. An age-dependent loss of glucose tolerance and development of frank diabetes in late adulthood have been observed in these offspring of female rats protein-restricted during pregnancy [37]. Defects in the expression of key insulin signaling proteins in insulin-sensitive tissues have been suggested to support the observed insulin resistance in this model [38].
The results from the present study indicating that female rats reared in a small litter demonstrated increased body weight gains during the suckling period as well as in the post-weaning period are consistent with the earlier observations for both male [16, 32, 35] and female SL rats [39] on this model. The overall increase in the consumption of rodent chow by female SL rats in the post-weaning period supported their obese phenotype. The presence of hyperinsulinemia in female SL rats both during the suckling period as well as in the post-weaning period and hyperglycemia in the post-weaning period suggest defects in insulin action in peripheral tissues in female SL rats.
Skeletal muscle plays a pivotal role for glucose uptake and in the maintenance of whole body glucose homeostasis [40]. Our results indicate that there are no differences in either the protein content or mRNA levels of IR-β between the CL and SL female rats at both age day 21 and day 140 suggesting that overnourishment during the suckling period did not impact on insulin signaling at this step. The results in the present study are consistent with similar findings for male and female offspring of obese dam [41]. The observation that the level of tyrosine phosphorylation of IR-β, which is the functionally active form of the IR, is not different between SL and CL rats is further evidence indicating that insulin action at the level of the IR was not programmed in this model.
The insulin receptor substrate proteins (IRS) are immediate downstream components in the insulin signaling cascade [19]. Amongst the many isoforms of IRS, IRS-1 is the major isoform found in the muscle [20]. The protein content and gene expression of IRS-1 were markedly reduced in the skeletal muscle of both the young and adult female SL rats. This observation suggests that defects at the level of IRS-1 could be the site of defective insulin signaling in the skeletal muscle of female SL rats. The occurrence of this defect in young female SL rats and its persistence in the adult female SL rats indicates a programming effect at the level of IRS-1 in the female SL rat. In the adult male SL rat a significant reduction in the expression of IRS-1 was reported in the adipose tissue [31]. In the female offspring of obese dams a decrease in IRS-1 expression has been reported [41]. Several studies underscore the importance of IRS-1 in insulin action. siRNA-based gene silencing of IRS protein has shown that IRS-1 is required for insulin-stimulated glucose uptake in skeletal muscle [42]. Defective insulin action has been reported in IRS-1 knock-out mice, primarily in muscle [43]. In vivo inhibition of whole body expression of IRS-1 by an antisense oligonucleotide resulted in glucose intolerance and hyperinsulinemia [44].
In order to fully clarify the functional role of IRS-1 in the programming of insulin action due to over-nourishment in the suckling period, the study examined whether the phosphorylation state of IRS-1 was impaired in the SL rats. Although there were no marked differences in the phosphorylation of tyrosine residues in IRS-1 in the young female SL rat, its level was significantly reduced in the skeletal muscle of adult female SL rat. While phosphorylation of specific tyrosine residues in IRS-1 results in its active form, transduction of the insulin signaling cascade is inhibited by phosphorylation of specific serine residues in IRS-1[45]. The extent of serine phosphorylation was significantly reduced in the young female SL rat while it was significantly increased in the skeletal muscle of adult female SL rats. The marked differences observed between the CL and SL adult female rats could be a consequence of the presence of obesity in these rats. It is recognized that obesity causes chronic tissue inflammation which has been shown to be an important cause of obesity-induced insulin resistance [45]. The pro-inflammatory maker TNF-α, induces serine phosphorylation of IRS- 1 resulting in inhibition of insulin action [46]. In adult male SL rats, a significant increase in the expression of TNF-α and IL-6 genes in mesenteric adipose tissue was observed [47]. It is possible that an increased inflammatory response in obese female SL rats contributed to defective insulin signaling in the skeletal muscle of these rats.
In skeletal muscle glucose uptake is a rate limiting step in glucose utilization. Although total GLUT4 expression in the protein levels was not different in the skeletal muscle of the young and the adult female CL and SL rats, the mRNA levels of Glut4 was increased in the skeletal muscle of day 21 female SL rats while a marked decrease in its level was observed in the adult female SL rat. Unlike our results, early postnatal overfeeding has been shown to result in a decrease in the protein expression of GLUT4 in adipose tissue from adult SL rats [31] and a similar observation has been reported in skeletal muscle of the offspring of IUGR rats [48]. In the male offspring of dams which were protein restricted and both male and female offspring of obese dams there was no difference in the expression of GLUT4 protein in the skeletal muscle [49] which is consistent with our results. In addition to defects at the level of IRS-1, it is possible that defects at the level of GLUT4 translocation could contribute to altered insulin signaling in the skeletal muscle of the female SL rat.
It has been suggested that epigenetic changes in response to perturbations in the early developmental environments such as altered nutritional experiences could play a vital role in the later onset of metabolic diseases, such as obesity, insulin resistance, and type 2 diabetes mellitus [50]. Histone modification and DNA methylation are important epigenetic processes that determine when and where specific genes are expressed. Analysis of the DNA methylation pattern of CpG dinucleotides in the promoter of the Insr gene indicated a significant increase in the methylation status for CpG dinucleotides 5, 8 and 36 in the skeletal muscle of 21 day-old female rats. Conversely, in the skeletal muscle of adult female SL rats a decrease in the methylation status for CpG dinucleotides 2–4 and 8 was observed. These observations are not consistent with the results on the expression of Insr in the skeletal muscle of both young and adult female SL rats. It is probable that the observed changes in the methylation status of specific CpG residues do not influence the expression of Insr in the skeletal muscle of female SL rats. Alternatively, other epigenetic processes such as histone tail modification may play a predominant role in the expression of this gene. In the hypothalamus of young SL rats, although a significant increase was observed in the methylation status of the Insr gene, the expression of this gene was identical in the hypothalamus of SL and CL rats [27].
Although there were no significant differences in the methylation status of CpG dinucleotides in the proximal promoter gene of Irs1 in the young female SL rat, a significant increase in the methylation status for CpG dinucleotides 8, 9–12, and 15–17 in the promoter of the Irs1 gene in skeletal muscle of adult SL females was observed. This increase correlated with the observed decrease in the expression of Irs1 in the skeletal muscle of adult female SL rats since hypermethylation of CpG dinucleotides is associated with repression of gene transcription. The Irs1 promoter contains several potential transcription factor binding sites including those for SP1 and C/EBP. The SP1 binding sites in the promoter region of Irs1 located at −57~−48 bp and −105~−94 bp contain the CpG dinucleotides 9–10 and 15–17, respectively. Methylation status of CpG dinucleotides at or in the proximity of SP1 binding sites has been shown to regulate the binding of SP1 binding to DNA [51]. Hence, the increased methylation at CpG dinucleotides 9–10 and 15–17 via inhibition of binding of SP1 to DNA could contribute to the observed decrease in the expression of Irs1 in the skeletal muscle of adult female SL rats. The significant decrease in Irs1 gene expression observed in young SL female rats did not correlate with methylation status of CpG dinucleotides. This suggests that at this age the DNA methylation status does not correlate with the expression pattern.
The results from this study indicated that the CpG dinucleotide 5 in Glut4 promoter is hypomethylated in the skeletal muscle from 21 day-old female SL rats while the CpG dinucleotides 13–14 is hypermethylated in the adult female SL rat. These observations on the methylation status of CpG dinucleotides within Glut4 promoter region correlated with the observed changes in the gene expression of Glut4 in the young and adult SL rats. The Glut4 promoter contains potential binding sites for transcription factors such as MEF1, SP1, and MyoD. The SP1 binding site located at −63~−55 bp includes the CpG dinucleotides 13–14 which is hypermethylated in the adult female SL rat. It is possible that altered binding of SP1 to the DNA may be responsible for the observed decrease in the expression of Glut4 in these rats. Here we report that DNA hypo- or hypermethylation are directly correlated with an increase and a decrease in Glut4 gene expression in skeletal muscle from young and adult SL female rats, respectively. Methylation of specific CpG dinucleotides at −11, −30, −58, −63, and −75 bp in Glut4 promoter was involved in the regulation of Glut4 expression in 3T3-L1 cells [52]. In addition, methylation of a single CpG dinucleotide within the enhancer core element of the mouse M lysozyme gene is sufficient to inhibit transcription factor binding and to inhibit its transactivation [53]. It can be postulated that methylation patterns within the regulatory regions with even few dinucleotides is capable to regulate transcriptional activity.
This study underscores the importance of proper nourishment in the suckling period. The results from this study corroborate earlier investigations on the SL model demonstrating that overnourishment during the suckling period predispose the rat for adult-onset obesity [16, 32, 35]. Additionally, the results from this study demonstrate that excessive consumption of total calories during this critical period of development could lead to aberrations in insulin signaling in skeletal muscle which could eventually lead to the onset of type 2 diabetes. In this context it is interesting to note that hypermethylation in the promoter of target genes in white blood cells [54] and islets [55] have been shown to be associated with disease conditions like insulin resistance and type 2 diabetes mellitus, respectively.
This study is the first to demonstrate that overnourishment during the suckling period could predispose to epigenetic alterations in target genes in the insulin signaling pathway in the skeletal muscle of adult female SL rats. Although a direct corroboration between gene expression and changes in DNA methylation could not be derived for Insr gene between CL and SL rats, the observed increases in the methylation status of specific CpG dinucleotides in Irs1 and Glut4 promoters correlated with the decrease in the expression of these genes in adult female SL rats. The epigenetic alterations evident in adult SL rats could be a response to the obesity and increased pro-inflammatory response to this condition associated with increasing age in the SL rats. Alternatively, these changes could be a delayed expression of early programmed effects due to increased milk consumption during the suckling period. Jiang et al. reported that age-related increase in methylation is negatively associated with hepatic glucokinase expression [56], suggesting that increased DNA methylation with age could lead to hepatic insulin resistance in later life. Based on the results from this study, it could be postulated that epigenetic modification of the key genes involved in the insulin signaling pathway in skeletal muscle could result in the development of insulin resistance in the adult SL female rat.
Supplementary Material
Footnotes
Sources of support: This work supported by National Institute and Diabetes and Digestive and Kidney Diseases Grant DK-61518 (MSP).
Conflict of interest: The authors declare no conflict of interest.
Author contributions to the manuscript: MSP and MS jointly designed the experiments. HL and SM carried out the animal experiments and collected data. DJS designed the primers for the methylation analysis, contributed significantly to the execution of the methylation experiments and assisted in the analysis of the data. The major contribution for writing of this manuscript was from HL, MS, and MSP. All authors read and approved the final version of the manuscript.
Publisher's Disclaimer: This is a PDF file of an unedited manuscript that has been accepted for publication. As a service to our customers we are providing this early version of the manuscript. The manuscript will undergo copyediting, typesetting, and review of the resulting proof before it is published in its final citable form. Please note that during the production process errors may be discovered which could affect the content, and all legal disclaimers that apply to the journal pertain.
References
- 1.Flegal KM, Carroll MD, Ogden CL, Curtin LR. Prevalence and trends in obesity among US adults, 1999–2008. JAMA. 2010;303:235–41. doi: 10.1001/jama.2009.2014. [DOI] [PubMed] [Google Scholar]
- 2.Erdmann J, Kallabis B, Oppel U, Sypchenko O, Wagenpfeil S, Schusdziarra V. Development of hyperinsulinemia and insulin resistance during the early stage of weight gain. Am J Physiol Endocrinol Metab. 2008;294:E568–75. doi: 10.1152/ajpendo.00560.2007. [DOI] [PubMed] [Google Scholar]
- 3.Calle EE, Rodriguez C, Walker-Thurmond K, Thun MJ. Overweight, obesity, and mortality from cancer in a prospectively studied cohort of U.S. adults. N Engl J Med. 2003;348:1625–38. doi: 10.1056/NEJMoa021423. [DOI] [PubMed] [Google Scholar]
- 4.Li TY, Rana JS, Manson JE, Willett WC, Stampfer MJ, Colditz GA, et al. Obesity as compared with physical activity in predicting risk of coronary heart disease in women. Circulation. 2006;113:499–506. doi: 10.1161/CIRCULATIONAHA.105.574087. [DOI] [PMC free article] [PubMed] [Google Scholar]
- 5.Stein CJ, Colditz GA. The epidemic of obesity. J Clin Endocrinol Metabo. 2004;89:2522–5. doi: 10.1210/jc.2004-0288. [DOI] [PubMed] [Google Scholar]
- 6.Fernandez-Twinn DS, Ozanne SE. Early life nutrition and metabolic programming. Ann N Y Acad Sci. 2010;1212:78–96. doi: 10.1111/j.1749-6632.2010.05798.x. [DOI] [PubMed] [Google Scholar]
- 7.Guilloteau P, Zabielski R, Hammon HM, Metges CC. Adverse effects of nutritional programming during prenatal and early postnatal life, some aspects of regulation and potential prevention and treatments. J Physiol Pharmacol. 2009;60 (Suppl 3):17–35. [PubMed] [Google Scholar]
- 8.Li M, Sloboda DM, Vickers MH. Maternal obesity and developmental programming of metabolic disorders in offspring: evidence from animal models. Exp Diabetes Res. 2011;2011:592408. doi: 10.1155/2011/592408. [DOI] [PMC free article] [PubMed] [Google Scholar]
- 9.Patel MS, Srinivasan M. Metabolic programming in the immediate postnatal life. Ann Nutr Metab. 2011;58 (Suppl 2):18–28. doi: 10.1159/000328040. [DOI] [PMC free article] [PubMed] [Google Scholar]
- 10.Barker DJ, Bull AR, Osmond C, Simmonds SJ. Fetal and placental size and risk of hypertension in adult life. BMJ. 1990;301:259–62. doi: 10.1136/bmj.301.6746.259. [DOI] [PMC free article] [PubMed] [Google Scholar]
- 11.Barker DJ, Osmond C, Golding J, Kuh D, Wadsworth ME. Growth in utero, blood pressure in childhood and adult life, and mortality from cardiovascular disease. BMJ. 1989;298:564–7. doi: 10.1136/bmj.298.6673.564. [DOI] [PMC free article] [PubMed] [Google Scholar]
- 12.Hales CN, Barker DJ, Clark PM, Cox LJ, Fall C, Osmond C, et al. Fetal and infant growth and impaired glucose tolerance at age 64. BMJ. 1991;303:1019–22. doi: 10.1136/bmj.303.6809.1019. [DOI] [PMC free article] [PubMed] [Google Scholar]
- 13.Grove KL, Allen S, Grayson BE, Smith MS. Postnatal development of the hypothalamic neuropeptide Y system. Neuroscience. 2003;116:393–406. doi: 10.1016/s0306-4522(02)00668-1. [DOI] [PubMed] [Google Scholar]
- 14.Huang HP, Tsai MJ. Transcription factors involved in pancreatic islet development. J Biomed Sci. 2000;7:27–34. doi: 10.1007/BF02255915. [DOI] [PubMed] [Google Scholar]
- 15.Fahrenkrog S, Harder T, Stolaczyk E, Melchior K, Franke K, Dudenhausen JW, et al. Cross-fostering to diabetic rat dams affects early development of mediobasal hypothalamic nuclei regulating food intake, body weight, and metabolism. J Nutr. 2004;134:648–54. doi: 10.1093/jn/134.3.648. [DOI] [PubMed] [Google Scholar]
- 16.Plagemann A, Harder T, Rake A, Voits M, Fink H, Rohde W, et al. Perinatal elevation of hypothalamic insulin, acquired malformation of hypothalamic galaninergic neurons, and syndrome x-like alterations in adulthood of neonatally overfed rats. Brain Res. 1999;836:146–55. doi: 10.1016/s0006-8993(99)01662-5. [DOI] [PubMed] [Google Scholar]
- 17.Davidowa H, Plagemann A. Decreased inhibition by leptin of hypothalamic arcuate neurons in neonatally overfed young rats. Neuroreport. 2000;11:2795–8. doi: 10.1097/00001756-200008210-00037. [DOI] [PubMed] [Google Scholar]
- 18.Davidowa H, Plagemann A. Insulin resistance of hypothalamic arcuate neurons in neonatally overfed rats. Neuroreport. 2007;18:521–4. doi: 10.1097/WNR.0b013e32805dfb93. [DOI] [PubMed] [Google Scholar]
- 19.Schmitz-Peiffer C. Signalling aspects of insulin resistance in skeletal muscle: mechanisms induced by lipid oversupply. Cellular Signal. 2000;12:583–94. doi: 10.1016/s0898-6568(00)00110-8. [DOI] [PubMed] [Google Scholar]
- 20.Abdul-Ghani MA, DeFronzo RA. Pathogenesis of insulin resistance in skeletal muscle. J Biomed Biotechnol. 2010;2010:476279. doi: 10.1155/2010/476279. [DOI] [PMC free article] [PubMed] [Google Scholar]
- 21.DeFronzo RA, Gunnarsson R, Bjorkman O, Olsson M, Wahren J. Effects of insulin on peripheral and splanchnic glucose metabolism in noninsulin-dependent (type II) diabetes mellitus. J Clin Invest. 1985;76:149–55. doi: 10.1172/JCI111938. [DOI] [PMC free article] [PubMed] [Google Scholar]
- 22.Sesti G. Pathophysiology of insulin resistance. Best Pract Res Clin Endocrinol Metab. 2006;20:665–79. doi: 10.1016/j.beem.2006.09.007. [DOI] [PubMed] [Google Scholar]
- 23.Pinney SE, Simmons RA. Epigenetic mechanisms in the development of type 2 diabetes. Trends Endocrinol Metab. 2010;21:223–9. doi: 10.1016/j.tem.2009.10.002. [DOI] [PMC free article] [PubMed] [Google Scholar]
- 24.Holliday R. Epigenetics: a historical overview. Epigenetics. 2006;1:76–80. doi: 10.4161/epi.1.2.2762. [DOI] [PubMed] [Google Scholar]
- 25.Verdone L, Caserta M, Di Mauro E. Role of histone acetylation in the control of gene expression. Biochem Cell Biol. 2005;83:344–53. doi: 10.1139/o05-041. [DOI] [PubMed] [Google Scholar]
- 26.Plagemann A, Harder T, Brunn M, Harder A, Roepke K, Wittrock-Staar M, et al. Hypothalamic proopiomelanocortin promoter methylation becomes altered by early overfeeding: an epigenetic model of obesity and the metabolic syndrome. J Physiol. 2009;587:4963–76. doi: 10.1113/jphysiol.2009.176156. [DOI] [PMC free article] [PubMed] [Google Scholar]
- 27.Plagemann A, Roepke K, Harder T, Brunn M, Harder A, Wittrock-Staar M, et al. Epigenetic malprogramming of the insulin receptor promoter due to developmental overfeeding. J Perinat Med. 2010;38:393–400. doi: 10.1515/jpm.2010.051. [DOI] [PubMed] [Google Scholar]
- 28.Raychaudhuri N, Raychaudhuri S, Thamotharan M, Devaskar SU. Histone code modifications repress glucose transporter 4 expression in the intrauterine growth-restricted offspring. J Biol Chem. 2008;283:13611–26. doi: 10.1074/jbc.M800128200. [DOI] [PMC free article] [PubMed] [Google Scholar]
- 29.Zheng S, Rollet M, Pan YX. Protein restriction during gestation alters histone modifications at the glucose transporter 4 (GLUT4) promoter region and induces GLUT4 expression in skeletal muscle of female rat offspring. J Nutr Biochem. 2012;23:1064–71. doi: 10.1016/j.jnutbio.2011.05.013. [DOI] [PubMed] [Google Scholar]
- 30.Plagemann A. Perinatal programming and functional teratogenesis: impact on body weight regulation and obesity. Physiol Behav. 2005;86:661–8. doi: 10.1016/j.physbeh.2005.08.065. [DOI] [PubMed] [Google Scholar]
- 31.Rodrigues AL, De Souza EP, Da Silva SV, Rodrigues DS, Nascimento AB, Barja-Fidalgo C, et al. Low expression of insulin signaling molecules impairs glucose uptake in adipocytes after early overnutrition. J Endocrinol. 2007;195:485–94. doi: 10.1677/JOE-07-0046. [DOI] [PubMed] [Google Scholar]
- 32.Boullu-Ciocca S, Dutour A, Guillaume V, Achard V, Oliver C, Grino M. Postnatal diet-induced obesity in rats upregulates systemic and adipose tissue glucocorticoid metabolism during development and in adulthood: its relationship with the metabolic syndrome. Diabetes. 2005;54:197–203. doi: 10.2337/diabetes.54.1.197. [DOI] [PubMed] [Google Scholar]
- 33.Lopez M, Seoane LM, Tovar S, Garcia MC, Nogueiras R, Dieguez C, et al. A possible role of neuropeptide Y, agouti-related protein and leptin receptor isoforms in hypothalamic programming by perinatal feeding in the rat. Diabetologia. 2005;48:140–8. doi: 10.1007/s00125-004-1596-z. [DOI] [PubMed] [Google Scholar]
- 34.Rodrigues AL, de Moura EG, Passos MC, Dutra SC, Lisboa PC. Postnatal early overnutrition changes the leptin signalling pathway in the hypothalamic-pituitary-thyroid axis of young and adult rats. J Physiol. 2009;587:2647–61. doi: 10.1113/jphysiol.2009.169045. [DOI] [PMC free article] [PubMed] [Google Scholar]
- 35.Rodrigues AL, de Moura EG, Passos MC, Trevenzoli IH, da Conceicao EP, Bonono IT, et al. Postnatal early overfeeding induces hypothalamic higher SOCS3 expression and lower STAT3 activity in adult rats. J Nutr Biochem. 2011;22:109–17. doi: 10.1016/j.jnutbio.2009.11.013. [DOI] [PubMed] [Google Scholar]
- 36.Hales CN, Barker DJ. The thrifty phenotype hypothesis. Br Med Bull. 2001;60:5–20. doi: 10.1093/bmb/60.1.5. [DOI] [PubMed] [Google Scholar]
- 37.Petry CJ, Dorling MW, Pawlak DB, Ozanne SE, Hales CN. Diabetes in old male offspring of rat dams fed a reduced protein diet. Int J Exp Diabetes Res. 2001;2:139–43. doi: 10.1155/EDR.2001.139. [DOI] [PMC free article] [PubMed] [Google Scholar]
- 38.Warner MJ, Ozanne SE. Mechanisms involved in the developmental programming of adulthood disease. Biochem J. 2010;427:333–47. doi: 10.1042/BJ20091861. [DOI] [PubMed] [Google Scholar]
- 39.Rajia S, Chen H, Morris MJ. Maternal overnutrition impacts offspring adiposity and brain appetite markers-modulation by postweaning diet. J Neuroendocrinol. 2010;22:905–14. doi: 10.1111/j.1365-2826.2010.02005.x. [DOI] [PubMed] [Google Scholar]
- 40.DeFronzo RA, Tripathy D. Skeletal muscle insulin resistance is the primary defect in type 2 diabetes. Diabetes Care. 2009;32 (Suppl 2):S157–63. doi: 10.2337/dc09-S302. [DOI] [PMC free article] [PubMed] [Google Scholar]
- 41.Shelley P, Martin-Gronert MS, Rowlerson A, Poston L, Heales SJ, Hargreaves IP, et al. Altered skeletal muscle insulin signaling and mitochondrial complex II–III linked activity in adult offspring of obese mice. Am J Physiol Regul Integr Comp Physiol. 2009;297:R675–81. doi: 10.1152/ajpregu.00146.2009. [DOI] [PMC free article] [PubMed] [Google Scholar]
- 42.Bouzakri K, Zachrisson A, Al-Khalili L, Zhang BB, Koistinen HA, Krook A, et al. siRNA-based gene silencing reveals specialized roles of IRS-1/Akt2 and IRS-2/Akt1 in glucose and lipid metabolism in human skeletal muscle. Cell Metab. 2006;4:89–96. doi: 10.1016/j.cmet.2006.04.008. [DOI] [PubMed] [Google Scholar]
- 43.Araki E, Lipes MA, Patti ME, Bruning JC, Haag B, 3rd, Johnson RS, et al. Alternative pathway of insulin signalling in mice with targeted disruption of the IRS-1 gene. Nature. 1994;372:186–90. doi: 10.1038/372186a0. [DOI] [PubMed] [Google Scholar]
- 44.Araujo EP, De Souza CT, Gasparetti AL, Ueno M, Boschero AC, Saad MJ, et al. Short-term in vivo inhibition of insulin receptor substrate-1 expression leads to insulin resistance, hyperinsulinemia, and increased adiposity. Endocrinology. 2005;146:1428–37. doi: 10.1210/en.2004-0778. [DOI] [PubMed] [Google Scholar]
- 45.Saltiel AR. Insulin resistance in the defense against obesity. Cell Metab. 2012;15:798–804. doi: 10.1016/j.cmet.2012.03.001. [DOI] [PubMed] [Google Scholar]
- 46.Hotamisligil GS, Peraldi P, Budavari A, Ellis R, White MF, Spiegelman BM. IRS-1-mediated inhibition of insulin receptor tyrosine kinase activity in TNF-alpha- and obesity-induced insulin resistance. Science. 1996;271:665–8. doi: 10.1126/science.271.5249.665. [DOI] [PubMed] [Google Scholar]
- 47.Boullu-Ciocca S, Achard V, Tassistro V, Dutour A, Grino M. Postnatal programming of glucocorticoid metabolism in rats modulates high-fat diet-induced regulation of visceral adipose tissue glucocorticoid exposure and sensitivity and adiponectin and proinflammatory adipokines gene expression in adulthood. Diabetes. 2008;57:669–77. doi: 10.2337/db07-1316. [DOI] [PubMed] [Google Scholar]
- 48.Thamotharan M, McKnight RA, Thamotharan S, Kao DJ, Devaskar SU. Aberrant insulin-induced GLUT4 translocation predicts glucose intolerance in the offspring of a diabetic mother. Am J Physiol Endocrinol Metab. 2003;284:E901–14. doi: 10.1152/ajpendo.00516.2002. [DOI] [PubMed] [Google Scholar]
- 49.Ozanne SE, Olsen GS, Hansen LL, Tingey KJ, Nave BT, Wang CL, et al. Early growth restriction leads to down regulation of protein kinase C zeta and insulin resistance in skeletal muscle. J Endocrinol. 2003;177:235–41. doi: 10.1677/joe.0.1770235. [DOI] [PubMed] [Google Scholar]
- 50.Hanson M, Godfrey KM, Lillycrop KA, Burdge GC, Gluckman PD. Developmental plasticity and developmental origins of non-communicable disease: theoretical considerations and epigenetic mechanisms. Prog Biophys Mol Biol. 2011;106:272–80. doi: 10.1016/j.pbiomolbio.2010.12.008. [DOI] [PubMed] [Google Scholar]
- 51.Clark SJ, Harrison J, Molloy PL. Sp1 binding is inhibited by (m)Cp(m)CpG methylation. Gene. 1997;195:67–71. doi: 10.1016/s0378-1119(97)00164-9. [DOI] [PubMed] [Google Scholar]
- 52.Yokomori N, Tawata M, Onaya T. DNA demethylation during the differentiation of 3T3-L1 cells affects the expression of the mouse GLUT4 gene. Diabetes. 1999;48:685–90. doi: 10.2337/diabetes.48.4.685. [DOI] [PubMed] [Google Scholar]
- 53.Klages S, Mollers B, Renkawitz R. The involvement of demethylation in the myeloid-specific function of the mouse M lysozyme gene downstream enhancer. Nucleic Acids Res. 1992;20:1925–32. doi: 10.1093/nar/20.8.1925. [DOI] [PMC free article] [PubMed] [Google Scholar]
- 54.Gemma C, Sookoian S, Dieuzeide G, Garcia SI, Gianotti TF, Gonzalez CD, et al. Methylation of TFAM gene promoter in peripheral white blood cells is associated with insulin resistance in adolescents. Mol Genet Metab. 2010;100:83–7. doi: 10.1016/j.ymgme.2010.02.004. [DOI] [PubMed] [Google Scholar]
- 55.Ling C, Del Guerra S, Lupi R, Ronn T, Granhall C, Luthman H, et al. Epigenetic regulation of PPARGC1A in human type 2 diabetic islets and effect on insulin secretion. Diabetologia. 2008;51:615–22. doi: 10.1007/s00125-007-0916-5. [DOI] [PMC free article] [PubMed] [Google Scholar]
- 56.Jiang MH, Fei J, Lan MS, Lu ZP, Liu M, Fan WW, et al. Hypermethylation of hepatic Gck promoter in ageing rats contributes to diabetogenic potential. Diabetologia. 2008;51:1525–33. doi: 10.1007/s00125-008-1034-8. [DOI] [PubMed] [Google Scholar]
Associated Data
This section collects any data citations, data availability statements, or supplementary materials included in this article.