

Summary
Purpose
Brain drug bioavailability is regulated by the blood–brain barrier (BBB). It was recently suggested that cytochrome P450 (CYP) enzymes could act in concert with multidrug transporter proteins to regulate drug penetration and distribution into the diseased brain. The possibility that phase II metabolic enzymes could be expressed in the epileptic brain has been not evaluated. Phase II enzymes are involved in the metabolism of common antiepileptic drugs (AEDs).
Methods
Phase II enzyme UGT1A4 brain expression was evaluated in temporal lobe resections from patients with epilepsy. UGT1A4 expression was determined by western blot and immunocytochemistry in primary cultures of human drug-resistant brain endothelial human brain epileptic endothelial cells (EPI-EC)s and commercially available control cells human brain microvascular endothelial cells (HBMECs). Lack of DNA condensation measured by 4′,6-diamidino-2-phenylindole (DAPI) was used as a surrogate marker of cell viability and was correlated to UGT1A4 expression high performance liquid chromatography ultraviolet detection (HPLC-UV) was used to quantify lamotrigine metabolism by EPI-EC and HBMEC. The appearance of the specific lamotrigine metabolite, 2-n glucuronide (MET-1), was also evaluated. Lamotrigine and MET-1 levels were measured in selected surgical brain and matched blood samples.
Key Findings
UGT1A4 expression was observed in BBB endothelial cells and neurons. Our quantification study revealed variable levels of UGT1A4 expression across the brain specimens analyzed. Neurons devoid of UGT1A4 expression displayed nuclear DAPI condensation, a sign of cellular distress. UGT1A4 overexpression in EPI-EC, as compared to HBMEC, was reflected by a proportional increase in lamotrigine metabolism. The lamotrigine metabolite, MET-1, was formed in vitro by EPI-EC and, to a lesser extent, by HBMEC. HPLC-UV measurements of brain and blood samples obtained from patients receiving lamotrigine prior to surgery revealed the presence of lamotrigine and its metabolites in the brain.
Significance
These initial results suggest the presence of a phase II enzyme in the epileptic brain. Further studies are required to fully describe the pattern of brain UGT1A4 expression in relation to clinical variables and drug resistance.
Keywords: UGT1A4, Phase II metabolism, Lamotrigine, Antiepileptic drugs, Cerebrovasculature, Seizures
The pharmacologic effects of drugs depend on their availability and levels reached in a given organ. When considering the brain, a combination of physical and dynamic barriers determines the pattern of drug distribution close to neuronal targets. The blood–brain barrier (BBB) plays a crucial role in the brain influx and efflux of several xenobiotics (Abbott, 2005; Oby & Janigro, 2006). Several hypotheses have been offered to elucidate the mechanisms regulating drug brain distribution under pathologic conditions. In the drug-resistant epileptic brain, extensive studies have focused on the possibility that overexpression of multi-drug transporters at the BBB impedes penetration of antiepileptic drugs (AEDs) into the brain parenchyma (Dombrowski et al., 2001; Abbott et al., 2002; Loscher & Potschka, 2005; Loscher & Sills, 2007; Marchi et al., 2010). However, the results obtained have not translated into clinical improvement in the management of drug-resistant seizures (Loscher & Sills, 2007; Perucca et al., 2007).
Recent evidence has suggested that various cytochrome P450 (CYP) (phase I) and phase II metabolic enzymes are expressed in the human and rodent brain (Ghersi-Egea et al., 1993, 1995; Dauchy et al., 2008, 2009; Ghosh et al., 2011b; Shawahna et al., 2011). Metabolic enzymes are accountable for the hepatic metabolism of AEDs (Brodie et al., 2013). Levels of CYP1A1 and CYP1B1 can be detected in immortalized human brain microvascular cells (Dauchy et al., 2008, 2009), and CYP3A4 is upregulated in primary brain endothelial cells (EPI-ECs) derived from drug-resistant epileptic brain specimens (Ghosh et al., 2010, 2011a). Overexpression of CYP3A4 in EPI-ECs is accompanied by an increased metabolism of the AED carbamazepine (Ghosh et al., 2012).
The expression and function of phase II enzymes in the human epileptic brain remains to be fully elucidated. Phase II conjugation enzymes (glutathione-S-transferases [GSTs], sulfotransferase, and UDP-glucuronosyl-transferase [UGTs]) are involved in the biotransformation of important AEDs, such as lamotrigine, which is a substrate of UGT1A4 (Anderson, 2004, 2008; Ghosh et al., 2012). It is unknown whether UGT1A4 is expressed in the drug-resistant human epileptic brain and whether this expression plays a role in drug metabolism.
We evaluated the pattern of UGT1A4 expression in a cohort of brain specimens obtained from temporal lobectomies performed to relieve drug-resistant seizures. We then compared UGT1A4 expression and lamotrigine metabolism in EPI-ECs to commercially available, control brain endothelial cells. We evaluated the possible association between UGT1A4 expression and cell viability.
Material and Methods
Human subjects
Brain specimens were obtained conforming to the principles outlined in the Declaration of Helsinki. We used brain specimens and cells collected postsurgery from a total of nine patients (mean age 34.3 ± 6 years; see also Table 1) affected by intractable temporal lobe seizures (temporal lobe epilepsy, TLE). Two patients received lamotrigine (LMT) prior to surgery as part of their AED schedule. Brain and blood samples derived from these patients were used for the determination of LMT and its metabolites by high-performance liquid chromatography (HPLC). Primary brain endothelial cells were established from brain specimens and used for in vitro studies (see Table 1; Dombrowski et al., 2001; Ghosh et al., 2010, 2011a; Marchi et al., 2004).
Table 1.
Available patients’ data
| Pathology | Gender | AED | Experimental use | |
|---|---|---|---|---|
| 1 | TLE | F | LCM; PGB | IHC |
| 2 | TLE | M | TPM, PBT | IHC |
| 3 | TLE | F | LMT; LEV; PRM; OXC | IHC |
| 4 | TLE | F | NA | IHC, WB |
| 5 | TLE | F | CBZ, VPA, GBP, LMT, PHT, PBT, TPM, OXC, LEV | IHC, WB |
| 6 | TLE | F | NA | IHC, WB |
| 7 | TLE | F | LEV; OXC; LMT | HPLC, WB |
| 8 | TLE | F | LMT; GBP; PGB; LEV | HPLC |
| 9 | TLE | F | LMT | HPLC |
AEDs, antiepileptic drugs; TPM, topiramate; PHT, phenytoin; PBT, phenobarbital; PRM, primidone; PGB, pregabalin; GBP, gabapentin; DZ, diazepam; CBZ, carbamazepine; VPA, valproic acid; LEV, levetiracetam; LCM, lacosamide; LMT, lamotrigine; OXC, oxcarbamazepine; TLE, temporal lobe epilepsy; IHC, immunohistochemistry; WB, western blotting; HPLC, high performance liquid chromatography; NA, not available.
Immunocytochemistry
Brain sections (25–30 μm) were obtained from blocks of resected tissues. Sections were processed for immunohistochemistry or stained with 1% Cresyl violet (CV) for cytoarchitectural analysis (dyslamination, ectopic neurons). Briefly free-floating brain sections were incubated at 4°C overnight using the following: (1) rabbit polyclonal anti-human UGT1A4 (AB105781, 1:500; Abcam, Cambridge, MA, U.S.A.) or (2) goat polyclonal anti-human UGT1A4 (UGT1A4 (sc-27427), 1:50; Santa Cruz Biotechnology, Dallas, TX, U.S.A.). Sections were double-stained with glial fibrillary acidic protein (GFAP) or neuronal nuclei (NeuN) as described previously (Dombrowski et al., 2001; Marchi et al., 2004; Ghosh et al., 2010, 2011a). The following antibodies were used: mouse monoclonal anti-GFAP (G 3893, 1:100; Sigma, St Louis, MO, U.S.A.) and mouse monoclonal anti-NeuN (1:500; Millipore, EMD Millipore, Billerica, MA, U.S.A). Secondary antibodies were chosen according to the primary host: Alexa 594–conjugated Affinipure donkey anti-mouse IgG (1:100 catalog number 715-585-150; Jackson Immunoresearch Laboratories Inc., West Grove, PA, U.S.A.) and fluorescein isothiocyanate (FITC)–conjugated Affinipure goat anti-rabbit immunoglobulin (IgG) (1:100, catalog number A10529; Life Technologies, Grand Island, NY, U.S.A.). Autofluorescence was blocked with Sudan Black B. Sections were mounted using Vectashield mounting medium with 4′,6-diamidino-2-phenylindole (DAPI) (Vector Laboratories Inc., Burlingame, CA, U.S.A.).
Cell counting
The number of neurons expressing UGT1A4 was determined by analyzing five fields/brain section (20X, 1,600 μm2; three sections/patient). Images relative to UGT1A4, NeuN, and DAPI were individually acquired adjusting the relative background signal to zero, as described previously (Marchi et al., 2004; Ghosh et al., 2011a). Images were subsequentially processed using Image-J (National Institutes of Health, Bethesda, MD, U.S.A.) and Q-Capture-Pro. All images were converted to an 8-bit format and brightness/contrast was adjusted using the same parameters for all fluorophores. Threshold signals were set as 2 times of background and signal were watershed using Image-J, National Institutes of Health. The number cells per mm2 (DAPI+ UGT1A4+; NEUN+ UGT1A4+) was determined. Values were collected and expressed as mean ± standard error (SE).
Cell culture and immunocytochemistry
Endothelial cells
Freshly isolated EPI-ECs were derived from resected tissues as described previously (Dombrowski et al., 2001; Marchi et al., 2004; Ghosh et al., 2011a). Human brain microvascular endothelial cells (HBMECs; catalog number 1000) were purchased from Cell Systems (Kirkland, WA, U.S.A.)—Applied Cell Biology Research Institute (ACBRI 376). Cells are derived from a human donor. This particular donor (24-year-old, gender unknown) died of flail chest injury resulting from a car accident. Brain tissue was available and was used to establish brain cell cultures. Cells were cultured from the brain cortex as described in http://www.cell-systems.com/cert/22/137/Products/Products/ACBRI-Site-Specific-Cells/Human-Brain-Microvascular-Endothelial-Cells).
EPI-ECs and HBMECs were grown in T-75 flasks or in chamber slides. At approximately 75% confluence, cells were fixed using 3% formalin for 30 min. Cells were washed with phosphate-buffered saline (PBS), blocked, and incubated overnight at 4°C using a rabbit polyclonal anti-human UGT1A4 (AB105781, 1:500; Abcam). Secondary antibody fluorescein isothiocyanate (FITC)–conjugated Affinipure goat anti-rabbit IgG (1:100 catalog number A10529; Life Technologies, Invitrogen) was then used. Cells were mounted using Vectashield mounting medium with DAPI (Vector).
Protein isolation and western blot analysis
EPI-ECs and HBMECs were harvested and total proteins extracted. Proteins were then separated using a 10% Tris-HCl gel (sodium dodecyl sulfate polyacrylamide gel electrophoresis [SDS-PAGE]) and transferred onto a polyvinylidene fluoride (PVDF) membrane (Millipore Corporation). Membranes were incubated overnight with the primary antibody (rabbit polyclonal UGT1A4, 1:500; Abcam Inc). Secondary HRP rabbit IgG antibody was then used (1:2000; Gibco Laboratories, Carlsbad, CA, U.S.A.) for 1 h at room temperature. Bands were visualized with an enhanced chemiluminescence reagent (Amersham Pharmacia, Little Chalfont, Buckinghamshire, United Kingdom). PVDF membranes were incubated for 30 min at 50°C in stripping buffer (100 mm 2-mercaptoethanol, 2% sodium dodecyl sulfate, 62.5 mm Tris-HCl, pH 6.7). A mouse monoclonal b-Actin antibody was used (1:5,000; Sigma). Secondary HRP mouse IgG antibody was added (1:2,000; Gibco Laboratories) for 1 h at room temperature before visualization with the chemiluminescence reagent. Blot signals were quantified using Adobe Photoshop CS5; for each band, the number of pixels and luminosity were determined. Results were normalized by β-actin signals.
Evaluation of DAPI condensation
Nuclear DAPI condensation was used to evaluate cell viability. Small, condensed nuclei indicate apoptosis or cell damage, whereas large nuclei with diffuse DAPI staining are typical of healthy cells (Marchi et al., 2004; Ghosh et al., 2011a). Five randomly chosen fields were analyzed for each section (n = 5 sections/patient) using Q-Capture-Pro. Cells were classified as damaged or healthy based on DAPI condensation calculated as luminosity/number of pixel. In this experiment neurons (NEUN+) were selected based on UGT1A4 expression (luminosity); the UGT1A4 signal was then correlated to DAPI condensation.
HPLC-UV analysis
Lamotrigine (LMT, catalog number L3791) was purchased from Sigma-Aldrich (Saint Louis, MO, U.S.A.). Lamotrigine 2-N glucuronide (MET-1, catalog number P63204) was purchased from Chiron. HPLC method was evaluated for specificity by analyzing different batches of drug-free media and checking the interference of peaks of endogenous components of media. LMT and MET-1 solutions (calibration curve 10, 20, and 40 μg/ml) were stable for at least 4 weeks when stored at −20°C. The method was validated based on a standard calibration curve and by determining limits of quantification, precision, and accuracy (see Table 2). HPLC conditions: the mobile phase consisted of acetonitrile: methanol: water (18:19:63, v/v/v). We used a Zorbax Eclipse Plus C18 stainless steel column (4.6 × 150 mm, 3.5 μm; Agilent Technologies, Inc., Santa Clara CA, U.S.A.). Chromatography was performed at room temperature (flow rate: 1 ml/min) and monitored with UV detector at 210 nm. Samples were spiked with the standard to confirm retention time of LMT and MET-1.
Table 2.
Validation of LMT and MET-1 HPLC-UV detection
| Drugs | Concentration μg/ml | Measured concentration (mean ± SD) | CV (%)a | Accuracy (%)b | Correlation (r) |
|---|---|---|---|---|---|
| Lamotrigine | 1 | 1.043 ± 0.060 | 5.752 | 104.30 | 0.999 |
| 5 | 4.979 ± 0.157 | 3.153 | 99.58 | ||
| 10 | 10.201 ± 0.186 | 1.823 | 102.01 | ||
| 20 | 19.951 ± 0.312 | 1.608 | 99.75 | ||
| 40 | 39.861 ± 0.305 | 0.765 | 99.65 | ||
| 2-N-lamotrigine glucuronide (MET-1) | 20 | 19.828 ± 0.192 | 0.968 | 99.14 | 0.998 |
| 40 | 39.939 ± 0.182 | 0.455 | 99.84 |
Mean values are representative of n = 5 samples/concentration.
CV% (standard deviation/mean).
Accuracy (observed concentration/theoretical concentration).
In vitro and ex vivo LMT metabolism
In vitro LMT metabolism
EPI-ECs and HBMECs were cultured in T-75 flasks and incubated with LMT (40 μg/ml) (Rambeck et al., 2006) to determine endothelial metabolic potency. EPI-EC cultures were selected among those expressing higher UGT1A4 levels. Samples were collected (0, 4, 6, and 24 h) and analyzed by HPLC-UV for LMT metabolism and the appearance of MET-1.
Processing of brain and serum samples
After surgery, each brain specimen was divided into two portions (to establish primary brain endothelial cell cultures and for ex vivo HPLC-UV analysis). Brain specimens were rinsed with PBS (0.01 m), and homogenized (10 ml/g) in methanol/water (60/40, v/v). Homogenates were centrifuged at 4900 g for 15 min. Blood samples were centrifuged at 4900 g for 10 min to separate the serum. Microdialysis was used to collect the free drug present in the brain and serum samples (Rambeck et al., 2006; Ghosh et al., 2012). A gas-tight microdialysis syringe (5 ml) was filled with perfusion fluid (methanol/water 60/40, v/v) and DMEM (Dulbecco’s Modified Eagle Medium for serum). The syringe was connected to the microdialysis probe (4 mm, catalog number MD-2204; Bioanalytical Systems, Inc., West Lafayette, IN, U.S.A.) using a plastic tube and operated with a pump (flow rate = 1 μl/min; Bioanalytical Systems, Inc.). Microdialysis probes have a 320 μm outer diameter, 4 mm membrane length, and a low-molecular-weight cut-off membrane (<5,000 dalton). Media (200 μl) was collected and centrifuged (4,900 g for 10 min). The supernatant was filtered through a 0.22 μm membrane filter, and 50 μl of filtrate was injected in the HPLC column.
Statistical analysis
Origin 8.0 (Origin Lab, Northampton, MA, U.S.A.) and Jump 7.0 software were used. For all parametric variables, differences between populations were analyzed by analysis of variance (ANOVA). Linear correlation (Pearson’s r) between UGT1A4 expression and DAPI signal was determined using Origin 8.0. In all figures, symbols with error bars indicate mean ± standard error of the mean (SEM); *p < 0.05 was considered statistically significant.
Results
UGT1A4 expression in epileptic temporal lobe cells
Figure 1 shows qualitative and quantitative results relative to the pattern of UGT1A4 expression as evaluated in TLE specimens (n = 6; see Table 1). An example of histologic appearance of a TLE specimen is provided in Fig. 1A. Cresyl violet was used to visualize the boundary (dotted line) with the relative normal tissue. GFAP staining was used to delineate regions of reactive gliosis (Fig. 1A). Two primary antibodies against UGT1A4 were used to minimize the possibility of false positives (see also Fig. S1A). Immunofluorescent staining revealed BBB and neuronal UGT1A4 expression (Fig. 1B–C). The micrographs in Fig. 1C show details of UGT1A4 expression at the BBB and neurons. Sporadic parenchymal glial UGT1A4 staining was detected in the specimens analyzed (n = 6, Table 1). Figure 1B shows positive glial UGT1A4 staining as observed in one brain specimens; supplemental Fig. S1B shows an example of negative UGT1A4 glial staining (arrows). Quantification of UGT1A4 staining is provided in Fig. 1D–E. Note the variable levels of UGT1A4 expression (DAPI+ and NEUN+ cells) across patients (n = 6). The clinical factors determining UGT1A4 variability remain to be elucidated.
Figure 1.

Pattern of UGT1A4 expression in TLE brains. (A) Pathologic brain regions were identified by Cresyl Violet and GFAP staining. The dotted line indicates the margin between gliotic (asterisk) and adjacent, relatively normal cortex. (B) UGT1A4 expression in BBB endothelial cells is increased in regions of gliosis. (C) Examples of BBB and neuronal UGT1A4 expression (arrowheads). Double asterisk indicate an example of NEUN–UGT1A4 colocalization. (D–E) UGT1A4 expression was quantified across TLE brain specimens (n = 6). The graphs depict the percentage of DAPI-positive or NEUN-positive cells expressing UGT1A4.
UGT1A4 expression and cell survival
We tested the hypothesis that UGT1A4 expression correlates with signs of cellular viability. Signs of cellular apoptosis (measured by nuclear DAPI condensation) and UGT1A4 expression were quantified. Figure 2A–A1 shows examples of UGT1A4 staining and relative DAPI signals. Arrows show condensed nuclei devoid of UGT1A4 signal, whereas arrowheads indicate noncondensed DAPI staining in UGT1A4-positive cells. Example of line profile analysis is provided in Fig. 2A1. Expression of UGT1A4 inversely correlates with DAPI condensation in neurons (Fig. 2B; r = −0.898).
Figure 2.

Neuronal UGT1A4 expression and DAPI nuclear condensation. (A) UGT1A4 expression in apoptotic and healthy cells as detected by DAPI. Note the enlarged, diffused nuclear signal (arrowheads) indicating healthy cells expressing UGT1A4. Small condensed nuclei (arrows) were found in cells with negligible UGT1A4 expression. (A1) Example of a typical quantification is also provided (see also Material and methods). (B) Neuronal UGT1A4 expression is inversely correlated with DAPI nuclear condensation (r = −0.898).
UGT1A4 expression in primary human brain endothelial cells
UGT1A4 expression was evaluated by western blot (n = 4, Table 1) and immunohistochemistry in EPI-ECs and HBMECs (Fig. 3A). UGT1A4 expression levels were normalized by β-actin. UGT1A4 expression in HBMECs was set to 100%. UGT1A4 levels were increased in three of four patients analyzed (Fig. 3A1). Immunohistochemistry in Fig. 3B–B1 depicts an example of EPI-ECs expressing high levels of UGT1A4 compared to HBMECs.
Figure 3.

Western blot and immunocytochemical analysis of UGT1A4 expression in EPI-EC. (A–A1) Pattern of UGT1A4 protein expression as evaluated in primary brain endothelial cells (EPI-EC; n = 4 patients, see Table 1). HBMEC were used as comparison. Blots were quantified and normalized by β-actin. Control HBMEC signal was set as 100% of UGT1A4 expression. We found increased UGT1A4 expression in three of the four EPI-ECs analyzed. (B–B1) Example of UGT1A4 overexpression in EPI-ECs compared to HBMECs.
Functional relevance of UGT1A4 brain expression: lamotrigine metabolism and MET-1 production
We used HPLC-UV to measure the amount of lamotrigine (LMT) metabolized by primary human EPI-ECs (see Material and methods and Table 1) and commercially available control endothelial cells (HBMECs). Figure 4A depicts the patterns of LMT metabolism over time (0–24 h). The amount of LMT metabolized by EPI-ECs (time zero 24.7 ± 0.95; 24 h 17.6 ± 0.45 μg/ml) was higher compared to HBMECs (time zero 21.8 ± 0.21; 24 h 18.2 ± 0.24 μg/ml; p < 0.05). Media alone did not provoke LMT degradation (data not shown). Figure 4 A1 shows absence of LMT toxicity under the experimental conditions used. In the EPI-EC used, the levels of UGT1A4 expression, as measured by western blot (see Fig. 3A), are proportional to the amount of LMT metabolized (Fig. 4B; p < 0.05).
Figure 4.
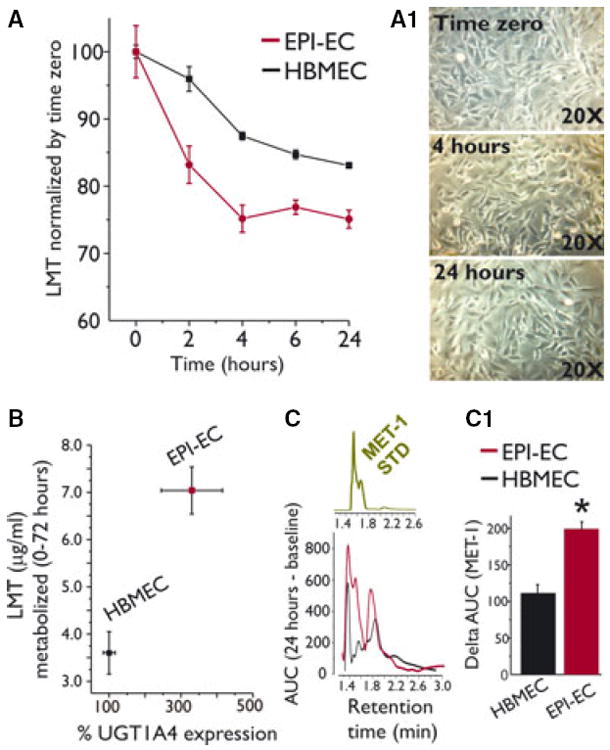
Endothelial expression of UGT1A4 and lamotrigine metabolism. (A) EPI-ECs and control HBMECs were incubated with lamotrigine (LMT). EPI-ECs metabolized LMT to a greater extent compared to HBMECs. Data are normalized by time zero. No significant changes were measured in the presence of media alone (not shown). (A1) LMT did not provoke significant cell toxicity. (B) UGT1A4 expression (as determined by western blot) is proportional to the amount (μg/ml) of LMT metabolized. (C–C1) The specific LMT metabolite, MET-1, was detected by HPLC-UV. MET-1 standard is shown in the insert. Note that MET-1 levels were significantly higher in EPI-ECs compared to HBMECs (data are expressed as area under the curve, AUC). Results are expressed as mean ± SEM. The asterisk indicates p < 0.05.
We evaluated whether LMT metabolism is associated with the production of the known metabolite MET-1 (Fig. 4C). An internal standard of MET-1 was used to identify the corresponding signal in the samples (insert in Fig. 4C). Validation of the HPLC methods used to detect LMT and MET-1 is provided in Table 2. Retention time for MET-1 was 1.5–1.7 min, as reported previously (Saracino et al., 2007). We found a signal corresponding to MET-1 in both EPI-ECs and HBMECs (Fig. 4C). EPI-ECs produced higher levels of MET-1, consistent with elevated LMT metabolism, as compared to control cells. Taken together, these results are suggestive of a functional correlate of UGT1A4 in the brain endothelial cells used.
We measured LMT and MET-1 levels in brain and blood specimens obtained from patients with TLE who received LMT prior to surgery (Fig. 5A–A1). LMT and MET-1 levels were detected in the brain and blood samples available (Fig. 5B). Of interest, two unknown peaks (labeled as 2 and 3 in Fig. 5B) were found in brain samples, suggesting a nonhepatic, possibly BBB drug metabolism. The exact molecular nature of these peaks remains to be determined.
Figure 5.

Detection of LMT and MET-1 in brain and blood specimens of human TLE. (A–A1) Traces in red indicate the brain profile, whereas blue traces indicate the serum. Note the presence of a peak corresponding to LMT and MET-1. (A2) Typical standard runs for LMT and MET-1 matching the retention times for the samples analyzed. (B) Peak areas (mAU) are plotted. Note that LMT and MET-1 are present in brain and serum specimens; two unknown peaks (2 and 3), possibly corresponding to other LMT metabolites, were present in the brain. The asterisk indicates p < 0.05.
Discussion
Taken together our initial results suggest that UGT1A4 is expressed at the BBB and in neuronal cells, although at variable levels. Brain endothelial UGT1A4 metabolizes its AED substrate LMT. Brain levels of MET-1 were found in two patients receiving LMT before surgery. These results support the hypothesis linking brain metabolic enzymes to central nervous system (CNS) distribution of drugs (Dauchy et al., 2008, 2009; Ghosh et al., 2010, 2011a,b, 2012; Shawahna et al., 2011).
UGT1A4 expression in human brain
The expression of metabolic enzymes in the rodent and human brain has been known for many years (Ghersi-Egea et al., 1987, 1995, 2001). However, only recently was this evidence corroborated by studies conducted using an immortalized brain capillary endothelial cell line and isolated human brain microvessels (Dauchy et al., 2008, 2009; Shawahna et al., 2011). Additional data suggested a possible role for metabolic enzymes in the drug-resistant epileptic brain (Ghosh et al., 2011b).
The significance of drug metabolizing enzymes in the “normal” or in the “pathologic” brain is not well understood and controversy exists on quantitative aspects of their expression. For example, no significant UGT messenger RNA (mRNA) levels were found in isolated human brain microvessels (Shawahna et al., 2011), whereas endothelial expression of UGT enzymes in brain capillaries was reported by others (Minn et al., 1991). Our data indicate variable patterns of BBB and neuronal UGT1A4 expression in TLE brains. Moreover, UGT1A isoforms were detected in pyramidal cells and astrocytes in rodent brain (Martinasevic et al., 1998; Gradinaru et al., 2012), whereas the data presented herein show only occasional glial staining for UGT1A4. These differences can be ascribed to intrinsic differences between experimental models and humans, disease characteristics, and clinical variables.
Do brain metabolic enzymes play a role in drug resistance?
Previous findings and the data presented herein support a paradigm shift in our understanding of sites of drug biotransformation. Although our studies were limited by design to AEDs, it is important to underscore that UGT and CYP metabolize many other CNS drugs. Our findings suggest that, although the lion’s share of biotransformation of xenobiotics can be accounted for by hepatic phase I and phase II enzymes (Brodie et al., 2013), an additional downstream mechanism may take place in the proximity to neurons. In the epileptic brain this was shown to occur at the BBB, but it is reasonable to assume that other forms of multiple drug resistance share similar mechanisms (Ghosh et al., 2011b).
However, several questions remain unanswered. It is not clear whether metabolic enzyme expression is the result of uncontrolled seizure activity, a correlate of the underlying pathology (e.g., focal dysplasia, hippocampal sclerosis), or both. Moreover, several xenobiotics, including AEDs, induce metabolic enzyme expression in the liver (Brodie et al., 2013). A comprehensive study is required to elucidate whether history of medication and exposure to AED can induce metabolic enzymes expression in brain cells.
We are aware that the lack of control brain tissues and brain cells represents a critical issue. Therefore, brain resections from drug-respondent patients are rarely available. In this study, we have used adjacent, relatively normal brain areas as comparison tissue (Fig. 1A) and commercially available human endothelial cells obtained from a nonepileptic brain (see Material and methods). Further studies are necessary to elucidate the exact determinants of metabolic enzyme expression in the human epileptic brain.
Functional significance of UGT1A4 expression in brain cells
The overexpression of UGT1A4 in EPI-ECs supports the hypothesis of impaired brain drug distribution in drug-resistant epileptic brain (or the “pharmacokinetic hypothesis of multiple drug resistance”). According to this hypothesis, drugs could be metabolized at the blood–brain interface before reaching the parenchymal target (Ghosh et al., 2011b) or by neurons themselves. The resulting metabolites may have increased, or no, pharmacologic potency, or even assume neurotoxic properties (Ghosh et al., 2012). These phenomena may, however, be exploited so that a prodrug is biotransformed into an active metabolite only at the BBB or in focal epileptic regions, thereby increasing therapeutic efficacy and decreasing extra-CNS side effects. Phase I and phase II metabolic enzymes act in concert with multidrug transporter proteins (Ghosh et al., 2011b), and recent data show that CYP3A4 and MDR1 are co-expressed at the epileptic human BBB (Ghosh et al., 2011a). In the past, a number of studies have shown the overexpression of a spectrum of multidrug transporter proteins, particularly MDR1 (Potschka et al., 2002, 2004; Loscher & Potschka, 2005; van Vliet et al., 2006).
Neuronal expression of UGT1A4 was found in TLE brains (Fig. 2). As previously demonstrated for other cyto-chrome enzymes (e.g., CYP3A4), UGT1A4 was preferentially expressed by healthy-appearing neurons (Marchi et al., 2004; Ghosh et al., 2011a). The presence of metabolic enzymes in brain cells has been shown to exert a cyto-protective role via detoxification/elimination pathways (de Leon, 2003). Therefore, expression of metabolic enzymes could allow cellular survival under hostile conditions, such as those found in epileptic brain. However, the correlation between DAPI condensation and presence of metabolic enzymes does not necessarily imply causality, as other proteins could be up- or down-regulated in response to stressors.
Metabolic enzyme expression is regulated by the nuclear receptors pregnane X receptor (PXR) and the constitutive androstane/activated receptor (CAR). PXR and CAR respond to xenobiotics or endogenous compounds modulating the metabolism and excretion of xenobiotics in the liver and intestine (Tolson & Wang, 2010). Recent evidence has shown the expression of PXR and CAR expression in the mammalian cerebrovasculature has been recently reported (Bauer et al., 2004, 2006; Wang et al., 2010). Whether the PXR/CAR system regulates metabolic enzyme expression in the epileptic brain remains to be elucidated.
In conclusion, our study provides initial evidence on the pattern of UGT1A4 brain expression in the human epileptic brain. Additional studies are required to unveil the pathophysiologic and clinical factors that determining metabolic enzyme expression and their possible relevance to drug resistance.
Supplementary Material
Figure S1. (A) Examples of UGT1A4 staining obtained using two primary antibodies (#1 and #2; see also Methods). (B) Lack of significant glial UGT1A4 staining in the cohort of TLE tissues analyzed.
Acknowledgments
Supported by R01 NS078307-01 and Epilepsy Foundation to Nicola Marchi; HD057256, NS074621, MH093302, UH2NS080701 to Damir Janigro; and NARSAD and AHA 13SDG13950015 to Chaitali Ghosh.
Footnotes
Disclosure
None of the authors has any conflict of interest to disclose. We confirm that we have read the Journal’s position on issue involved in ethical publication and affirm that this report is consistent with those guidelines.
Supporting Information
Additional Supporting Information may be found in the online version of this article
References
- Abbott NJ. Dynamics of CNS barriers: evolution, differentiation, and modulation. Cell Mol Neurobiol. 2005;25:5–23. doi: 10.1007/s10571-004-1374-y. [DOI] [PMC free article] [PubMed] [Google Scholar]
- Abbott NJ, Khan EU, Rollinson CM, Reichel A, Janigro D, Dombrowski SM, Dobbie MS, Begley DJ. Drug resistance in epilepsy: the role of the blood-brain barrier. Novartis Found Symp. 2002;243:38–47. [PubMed] [Google Scholar]
- Anderson GD. Pharmacogenetics and enzyme induction/inhibition properties of antiepileptic drugs. Neurology. 2004;63:S3–S8. doi: 10.1212/wnl.63.10_suppl_4.s3. [DOI] [PubMed] [Google Scholar]
- Anderson GD. Pharmacokinetic, pharmacodynamic, and pharmacogenetic targeted therapy of antiepileptic drugs. Ther Drug Monit. 2008;30:173–180. doi: 10.1097/FTD.0b013e318167d11b. [DOI] [PubMed] [Google Scholar]
- Bauer B, Hartz AM, Fricker G, Miller DS. Pregnane X receptor up-regulation of P-glycoprotein expression and transport function at the blood-brain barrier. Mol Pharmacol. 2004;66:413–419. doi: 10.1124/mol.66.3.. [DOI] [PubMed] [Google Scholar]
- Bauer B, Yang X, Hartz AM, Olson ER, Zhao R, Kalvass JC, Pollack GM, Miller DS. In vivo activation of human pregnane X receptor tightens the blood-brain barrier to methadone through P-glycoprotein up-regulation. Mol Pharmacol. 2006;70:1212–1219. doi: 10.1124/mol.106.023796. [DOI] [PubMed] [Google Scholar]
- Brodie MJ, Mintzer S, Pack AM, Gidal BE, Vecht CJ, Schmidt D. Enzyme induction with antiepileptic drugs: cause for concern? Epilepsia. 2013;54:11–27. doi: 10.1111/j.1528-1167.2012.03671.x. [DOI] [PubMed] [Google Scholar]
- Dauchy S, Dutheil F, Weaver RJ, Chassoux F, Daumas-Duport C, Couraud PO, Scherrmann JM, de WI, Decleves X. ABC transporters, cytochromes P450 and their main transcription factors: expression at the human blood-brain barrier. J Neurochem. 2008;107:1518–1528. doi: 10.1111/j.1471-4159.2008.05720.x. [DOI] [PubMed] [Google Scholar]
- Dauchy S, Miller F, Couraud PO, Weaver RJ, Weksler B, Romero IA, Scherrmann JM, de WI, Decleves X. Expression and transcriptional regulation of ABC transporters and cytochromes P450 in hCMEC/D3 human cerebral microvascular endothelial cells. Biochem Pharmacol. 2009;77:897–909. doi: 10.1016/j.bcp.2008.11.001. [DOI] [PubMed] [Google Scholar]
- de Leon J. Glucuronidation enzymes, genes and psychiatry. Int J Neuropsychopharmacol. 2003;6:57–72. doi: 10.1017/S1461145703003249. [DOI] [PubMed] [Google Scholar]
- Dombrowski SM, Desai SY, Marroni M, Cucullo L, Goodrich K, Bingaman W, Mayberg MR, Bengez L, Janigro D. Overexpression of multiple drug resistance genes in endothelial cells from patients with refractory epilepsy. Epilepsia. 2001;42:1501–1506. doi: 10.1046/j.1528-1157.2001.12301.x. [DOI] [PubMed] [Google Scholar]
- Ghersi-Egea JF, Walther B, Perrin R, Minn A, Siest G. Inducibility of rat brain drug-metabolizing enzymes. Eur J Drug Metab Pharmacokinet. 1987;12:263–265. doi: 10.1007/BF03189910. [DOI] [PubMed] [Google Scholar]
- Ghersi-Egea JF, Perrin R, Leininger-Muller B, Grassiot MC, Jeandel C, Floquet J, Cuny G, Siest G, Minn A. Subcellular localization of cytochrome P450, and activities of several enzymes responsible for drug metabolism in the human brain. Biochem Pharmacol. 1993;45:647–658. doi: 10.1016/0006-2952(93)90139-n. [DOI] [PubMed] [Google Scholar]
- Ghersi-Egea JF, Leininger-Muller B, Cecchelli R, Fenstermacher JD. Blood-brain interfaces: relevance to cerebral drug metabolism. Toxicol Lett. 1995;82–83:645–653. doi: 10.1016/0378-4274(95)03510-9. [DOI] [PubMed] [Google Scholar]
- Ghersi-Egea JF, Strazielle N, Murat A, Edwards J, Belin MF. Are blood-brain interfaces efficient in protecting the brain from reactive molecules? Adv Exp Med Biol. 2001;500:359–364. doi: 10.1007/978-1-4615-0667-6_59. [DOI] [PubMed] [Google Scholar]
- Ghosh C, Gonzalez-Martinez J, Hossain M, Cucullo L, Fazio V, Janigro D, Marchi N. Pattern of P450 expression at the human blood-brain barrier: roles of epileptic condition and laminar flow. Epilepsia. 2010;51:1408–1417. doi: 10.1111/j.1528-1167.2009.02428.x. [DOI] [PMC free article] [PubMed] [Google Scholar]
- Ghosh C, Marchi N, Desai NK, Puvenna V, Hossain M, Gonzalez-Martinez J, Alexopoulos AV, Janigro D. Cellular localization and functional significance of CYP3A4 in the human epileptic brain. Epilepsia. 2011a;52:562–571. doi: 10.1111/j.1528-1167.2010.02956.x. [DOI] [PMC free article] [PubMed] [Google Scholar]
- Ghosh C, Puvenna V, Gonzalez-Martinez J, Janigro D, Marchi N. Blood-brain barrier P450 enzymes and multidrug transporters in drug resistance: a synergistic role in neurological diseases. Curr Drug Metab. 2011b;12:742–749. doi: 10.2174/138920011798357051. [DOI] [PMC free article] [PubMed] [Google Scholar]
- Ghosh C, Marchi N, Hossain M, Rasmussen P, Alexopoulos AV, Gonzalez-Martinez J, Yang H, Janigro D. A pro-convulsive carbamazepine metabolite: quinolinic acid in drug resistant epileptic human brain. Neurobiol Dis. 2012;46:692–700. doi: 10.1016/j.nbd.2012.03.010. [DOI] [PMC free article] [PubMed] [Google Scholar]
- Gradinaru D, Minn AL, Artur Y, Minn A, Heydel JM. Effect of oxidative stress on UDP-glucuronosyltransferases in rat astrocytes. Toxicol Lett. 2012;213:316–324. doi: 10.1016/j.toxlet.2012.07.014. [DOI] [PubMed] [Google Scholar]
- Loscher W, Potschka H. Drug resistance in brain diseases and the role of drug efflux transporters. Nat Rev Neurosci. 2005;6:591–602. doi: 10.1038/nrn1728. [DOI] [PubMed] [Google Scholar]
- Loscher W, Sills GJ. Drug resistance in epilepsy: why is a simple explanation not enough? Epilepsia. 2007;48:2370–2372. doi: 10.1111/j.1528-1167.2007.01260_2.x. [DOI] [PubMed] [Google Scholar]
- Marchi N, Hallene KL, Kight KM, Cucullo L, Moddel G, Bingaman W, Dini G, Vezzani A, Janigro D. Significance of MDR1 and multiple drug resistance in refractory human epileptic brain. BMC Med. 2004;2:37. doi: 10.1186/1741-7015-2-37. [DOI] [PMC free article] [PubMed] [Google Scholar]
- Marchi N, Gonzalez-Martinez J, Nguyen MT, Granata T, Janigro D. Transporters in drug-refractory epilepsy: clinical significance. Clin Pharmacol Ther. 2010;87:13–15. doi: 10.1038/clpt.2009.225. [DOI] [PMC free article] [PubMed] [Google Scholar]
- Martinasevic MK, King CD, Rios GR, Tephly TR. Immunohistochemical localization of UDP-glucuronosyltransferases in rat brain during early development. Drug Metab Dispos. 1998;26:1039–1041. [PubMed] [Google Scholar]
- Minn A, Ghersiegea JF, Perrin R, Leininger B, Siest G. Drug-metabolizing-enzymes in the brain and cerebral microvessels. Brain Res Rev. 1991;16:65–82. doi: 10.1016/0165-0173(91)90020-9. [DOI] [PubMed] [Google Scholar]
- Oby E, Janigro D. The blood-brain barrier and epilepsy. Epilepsia. 2006;47:1761–1774. doi: 10.1111/j.1528-1167.2006.00817.x. [DOI] [PubMed] [Google Scholar]
- Perucca E, French J, Bialer M. Development of new antiepileptic drugs: challenges, incentives, and recent advances. Lancet Neurol. 2007;6:793–804. doi: 10.1016/S1474-4422(07)70215-6. [DOI] [PubMed] [Google Scholar]
- Potschka H, Fedrowitz M, Loscher W. P-Glycoprotein-mediated efflux of phenobarbital, lamotrigine, and felbamate at the blood-brain barrier: evidence from microdialysis experiments in rats. Neurosci Lett. 2002;327:173–176. doi: 10.1016/s0304-3940(02)00423-8. [DOI] [PubMed] [Google Scholar]
- Potschka H, Baltes S, Loscher W. Inhibition of multidrug transporters by verapamil or probenecid does not alter blood-brain barrier penetration of levetiracetam in rats. Epilepsy Res. 2004;58:85–91. doi: 10.1016/j.eplepsyres.2003.12.007. [DOI] [PubMed] [Google Scholar]
- Rambeck B, Jurgens UH, May TW, Pannek HW, Behne F, Ebner A, Gorji A, Straub H, Speckmann EJ, Pohlmann-Eden B, Loscher W. Comparison of brain extracellular fluid, brain tissue, cerebrospinal fluid, and serum concentrations of antiepileptic drugs measured intraoperatively in patients with intractable epilepsy. Epilepsia. 2006;47:681–694. doi: 10.1111/j.1528-1167.2006.00504.x. [DOI] [PubMed] [Google Scholar]
- Saracino MA, Bugamelli F, Conti M, Amore M, Raggi MA. Rapid HPLC analysis of the antiepileptic lamotrigine and its metabolites in human plasma. J Sep Sci. 2007;30:2249–2255. doi: 10.1002/jssc.200700110. [DOI] [PubMed] [Google Scholar]
- Shawahna R, Uchida Y, Decleves X, Ohtsuki S, Yousif S, Dauchy S, Jacob A, Chassoux F, Daumas-Duport C, Couraud PO, Terasaki T, Scherrmann JM. Transcriptomic and quantitative proteomic analysis of transporters and drug metabolizing enzymes in freshly isolated human brain microvessels. Mol Pharm. 2011;8:1332–1341. doi: 10.1021/mp200129p. [DOI] [PubMed] [Google Scholar]
- Tolson AH, Wang H. Regulation of drug-metabolizing enzymes by xenobiotic receptors: PXR and CAR. Adv Drug Deliv Rev. 2010;62:1238–1249. doi: 10.1016/j.addr.2010.08.006. [DOI] [PMC free article] [PubMed] [Google Scholar]
- van Vliet EA, van Schaik R, Edelbroek PM, Redeker S, Aronica E, Wadman WJ, Marchi N, Vezzani A, Gorter JA. Inhibition of the multidrug transporter P-glycoprotein improves seizure control in phenytoin-treated chronic epileptic rats. Epilepsia. 2006;47:672–680. doi: 10.1111/j.1528-1167.2006.00496.x. [DOI] [PubMed] [Google Scholar]
- Wang X, Sykes DB, Miller DS. Constitutive androstane receptor-mediated up-regulation of ATP-driven xenobiotic efflux transporters at the blood-brain barrier. Mol Pharmacol. 2010;78:376–383. doi: 10.1124/mol.110.063685. [DOI] [PMC free article] [PubMed] [Google Scholar]
Associated Data
This section collects any data citations, data availability statements, or supplementary materials included in this article.
Supplementary Materials
Figure S1. (A) Examples of UGT1A4 staining obtained using two primary antibodies (#1 and #2; see also Methods). (B) Lack of significant glial UGT1A4 staining in the cohort of TLE tissues analyzed.