

Abstract
Epidermal growth factor receptor (EGFR) pathway activation is a frequent event in human carcinomas. Mutations in EGFR itself are, however, rare, and the mechanisms regulating EGFR activation remain elusive. Leucine-rich immunoglobulin repeats-1 (LRIG1), an inhibitor of EGFR activity, is one of four genes identified that predict patient survival across solid tumour types including breast, lung, melanoma, glioma, and bladder. We show that deletion of Lrig1 is sufficient to promote murine airway hyperplasia through loss of contact inhibition and that re-expression of LRIG1 in human lung cancer cells inhibits tumourigenesis. LRIG1 regulation of contact inhibition occurs via ternary complex formation with EGFR and E-cadherin with downstream modulation of EGFR activity. We find that LRIG1 LOH is frequent across cancers and its loss is an early event in the development of human squamous carcinomas. Our findings imply that the early stages of squamous carcinoma development are driven by a change in amplitude of EGFR signalling governed by the loss of contact inhibition.
Keywords: EGFR, LRIG1, squamous cell carcinoma, lung cancer, pre-invasive, E-cadherin, cell-cell contact
Introduction
Dysregulation of EGFR signalling is a common feature of various lung diseases such as asthma, lung fibrosis, and lung cancer 1,2. EGFR signalling is also crucial for lung development as Egfr-null mice have defects in both branching and differentiation, whilst segregation of EGFR and its ligands regulates repair 3–5.
The EGFR family is a group of four structurally similar tyrosine kinases (EGFR, HER2/neu, ErbB-3, and ErbB-4) that dimerize upon ligand binding. EGFR is an important lung oncogene and is overexpressed in virtually all squamous carcinomas. Intriguingly, overexpression of EGFR is one of the earliest abnormalities in the bronchial epithelium of smokers and is present in all stages of pre-invasive squamous cell carcinoma including basal cell hyperplasia, squamous metaplasia, dysplasia, and carcinoma in situ 6. We hypothesize that tissue homeostasis is maintained via strong endogenous regulation of EGFR signalling and that loss of this regulation leads to early-stage tumourigenesis.
Leucine-rich repeats and immunoglobulin like-domains (LRIG1) is one such inhibitor and in the epidermis it has been found to maintain epidermal stem cells in a non-proliferative state via negative regulation of EGFR signalling 7,8, with its loss being observed in psoriatic lesions and epidermal squamous cell carcinomas 9,10. There is, in fact, strong bioinformatic evidence of LRIG1’s role in tumourigenesis, with a recent study showing that LRIG1 was one of only four mis-expressed genes that relate to patient survival across epithelial cancer types 11. The mechanism for this is unknown.
In the following experiments, we show that LRIG1 is expressed in the epithelium of the upper murine airways. Loss of Lrig1 in murine airways leads to epithelial hyperproliferation, which is recapitulated with in vitro organotypic cultures where Lrig1-deficient cells fail to undergo cell–cell contact inhibition. We demonstrate that LRIG1 forms a ternary complex between LRIG1, E-cadherin, and EGFR, which upon cell–cell contact negatively regulates EGFR signalling. In human lung cancer cell lines, we show that re-expression of LRIG1 reduces cell growth and inhibits tumourigenesis in vivo. LRIG1 LOH occurs across many tumour types and particularly in squamous cell carcinomas. Finally, we demonstrate that LRIG1 may be an important trigger of carcinogenesis at the pre-invasive carcinoma stage by showing that LRIG1 loss is an early and consistent event in the pathogenesis of pre-invasive lung cancer lesions.
Materials and methods
Animal experiments
Mouse husbandry and experimentation
Adult, 2- to 4-month-old mice were used for experiments, housed in individually ventilated cages on a 12 h light/dark cycle, and allowed access to food and water ad libitum. Lrig1-null mice were a kind gift from Sathoshi Itami 9. All transgenic mice were maintained on a mixed background of 129, C57/Bl6, and CD1 inbred strains. Homozygote-deleted Lrig1 mice were compared with sex-matched littermate heterozygote Lrig1 mice as controls. Of note, heterozygote littermates were compared with wild-type littermates and found to have no difference in airway epithelial morphology, cellularity or proliferation (Supplementary Figure 1). Hence the breeding programme consisted of breeding a heterozygote with a knockout to maximize experimental mice numbers and subsequent experiments compared heterozygote littermates with knockouts. For experiments involving tracheal repair, mice were anaesthetized with isofluorane and tracheas damaged via oropharyngeal instillation of 15 µl of 2% polidocanol (a detergent agent that removes the airway epithelium, leaving an intact basement membrane) (Sigma, Dorset, UK) 12. BrdU was injected intraperitoneally (Zymed 00–0103; 100 µl concentrated reagent per 10 g body weight, intraperitoneally, 2 h pre-sacrifice). Tracheal samples were fixed in 4% paraformaldehyde and paraffin-embedded or snap-frozen in OCT. Mice were sacrificed by sodium pentobarbitol overdose and sentinel screenings for common murine pathogens were used throughout the course of these studies. All in vivo experiments involved a minimum sample size of five animals per group, were repeated at least twice, and were performed under the terms of a UK Home Office project licence.
Tissue preparation, histology, and antibody staining
Human and murine tissue sections were fixed in 10% neutral buffered formalin or 4% paraformaldehyde, processed, and sectioned at 4 µm thickness. Human biopsy samples were obtained via fibre optic bronchoscopy, with patient consent under institutional ethical approval. Human and murine haematoxylin and eosin (H&E) staining was performed using an automated staining system (TissueTek). All human biopsy specimens were subjected to routine histopathological diagnosis by two consultant lung histopathologists (MF and AN). Air–liquid interface (ALI) culture whole-mounts were fixed overnight in 4% paraformaldehyde prior to antibody immunostaining.
Immunofluorescent or immunohistochemical human and murine tissue section and/or ALI whole-mount antibody staining followed standard conditions 13. Species-appropriate secondary antibodies included streptavidin-HRP (DAKO, Cambridgeshire, UK) (Ki67) or directly conjugated Alexafluor dyes (all other primary antibodies). For immunofluorescence or immunohistochemistry, we used the following antibodies: LRIG1 (S Itami, University of Osaka, Japan), LRIG1 (rabbit; Abcam, Cambridge, MA, USA), K14 (rabbit; Covance, Leeds, UK), K14 (LL002) (mouse IgG3; F Watt, CRUK, Cambridge), CCSP (goat; gift from B Stripp, Duke University, USA) 14, acetylated tubulin (mouse; Sigma), Ki67 (rabbit; Sigma), BrdU (ICR1) (mouse; AbD Serotec, Kidlington, UK), CDH1 (rat; Sigma), CDH1 (mouse; Watt, CRUK, UK), flag1 (mouse; Sigma), and EGFR1 (mouse; Abcam). Secondary antibodies were conjugated to HRP, Alexa555, Alexa633 or Alexa488 (Invitrogen, Paisley, UK). Images were acquired using a Leica TCS Tandem or SPE confocal or an Olympus bright-field microscope. Confocal images were imported into Volocity software (Perkin Elmer, Bucks, UK) for accurate measurement of intensity. Four representative z-stack images acquired with a 40× objective were analysed for each of three animals in Lrig-null and Het groups. All images were post-processed using Adobe Photoshop (Photomerge, rotate, crop, brightness, and contrast adjustments).
Morphometry and statistical analysis
Epithelial height and cell density were determined using Volocity image analysis software. We quantified the abundance of specific tracheal cell phenotypes as a function of epithelial basement membrane length 15. Two-tailed unpaired t-tests were performed to assess the significance of differences between epithelial heights and signal intensity between two groups and the Mann–Whitney U-test was used for cell phenotype and proliferation. One-way ANOVA and Tukey’s multiple comparison test were performed to assess the signal intensity from fluorescent images between three groups. Statistical significance was accepted at p < 0.05 for all analyses, and error bars represent the standard error of the mean. All statistical analyses were performed using GraphPad Prism and Microsoft Excel.
Human cell culture and retroviral infection
A549 and H357 cells were transduced with pBabePuro-Lrig1Flag and pBabe Puro 8. A549 cells were grown in DMEM + 10% FBS + l-glutamine. Transduction of cancer cells was carried out as previously described 16. Briefly, ecotropic Phoenix packaging cells were transiently transfected with retroviral vectors, and virus-containing supernatants were used to infect AM12 packaging cells, as described previously 17. Stably transduced AM12 cells were cultured with 2.5 µg/ml puromycin. Cancer cells were transduced with retroviral vectors either by co-culture with AM12 cells 18 or by incubation with AM12 supernatant 17. All cells were obtained from Cancer Research UK, London Research Institute (CRUK, London, UK) and were authenticated by the integrin expression profile (H357) and SpC expression (A549) 19.
Murine in vitro culture
Mouse tracheal epithelial cells (MTECs) were harvested using aseptic techniques, pooled, cleaned, and digested in pronase as previously described 20. Enzyme isolated cells were counted and seeded in 12-well Transwell dishes (Sigma) at 2 × 10⁵ cells per well in MTEC/plus. Upon visually reaching confluence (usually day 9 post-plating), the media was changed to MTEC/basic plus retinoic acid to enhance differentiation at an air–liquid interface (ALI) 20. Cells were harvested at indicated time points and subjected to immunostaining and immunoblotting. BrdU was added 3 h before cell fixation (ZYMED 00–0103: in vivo 100 µl concentrated reagent per 10 g body weight, intraperitoneal, 2 h pre-sacrifice; in vitro exp 1 : 100). In some experiments, cells were incubated overnight with MTEC/basic medium with no growth factors.
Subcutaneous tumour model
Eight-week-old male, NOD/SCID IL2 Rγ knockout mice were used for tumourigenesis experiments. All mouse studies were performed in accordance with British Home Office procedural and ethical guidelines. Animals were housed in pathogen-free conditions with filtered air, and autoclaved food and water were available ad libitum. H357 empty vector and LRIG1 transduced cells were injected in a suspension of two million cells in a total of 200 µl, subcutaneously in the right flank with a 29 G needle. Tumours were measured every 2–5 days with callipers, and the volume was calculated as (4/3)πr3, where r is the estimated radius 21.
Immunoblotting and immunoprecipitation
Cells were scraped from in vitro cultures into RIPA buffer supplemented by complete protease inhibitors (Roche, West Sussex, UK) and phosSTOP phosphatase inhibitor (PhosphoSafe™ Extraction Reagent Novagen). Equal amounts of protein were loaded and immunoblotted using the antibodies indicated. Lysates for immunoprecipitation were prepared by scraping cells into NP40 buffer [20 mm Tris–HCl (pH 8), 137 mm NaCl, 10% glycerol, 1% Nonidet P-40 (NP-40), 2 mm EDTA, supplemented by complete protease inhibitor] at 4°C on an agitator for 30 min. For immunoblotting and immunoprecipitation, we used the following antibodies: phospho-EGFR1 (rabbit; Invitrogen), EGFR (rabbit 1005; Santa Cruz Biotechnology, Santa Cruz, CA, USA), phospho-ERK1/2 (rabbit; Cell Signaling, Beverley, MA, USA), ERK2 (goat; Santa Cruz Biotechnology), flag1 (mouse; Sigma), CDH1 (mouse; Watt, CRUK, UK), phospho-Akt (mouse; Cell Signaling), and β-actin (mouse; Sigma).
In situ hybridization assay
In situ probes were generated from LRIG1 cDNA as described previously 9. Hybridization with a β-actin antisense probe served as a positive control and was performed as described previously 22.
RNA isolation and quantitative real-time PCR
RNA was extracted from cultured or freshly isolated MTECs and human A549, H357 and BEAS-2b cells using a commercially available SV RNA isolation kit (Promega, Madison, WI, USA). Carcinoma in situ (CIS) lesions and a normal area of epithelium biopsied at the same bronchoscopy were laser microdissected from formalin-fixed, paraffin-embedded (FFPE) tissues from ten patients. Briefly, multiple sections of each sample were cut, with the first and last in a series stained with H&E for inspection by two lung pathologists. After confirming the diagnosis and dewax/staining the samples using the Arcturus® Paradise® PLUS Reagent System (Applied Biosystems, Foster City, CA, USA), we laser capture microdissected the samples using the Zeiss Palm Microbeam system (Carl Zeiss, Cambridge, UK and Quanta Biosciences, Leicestershire, UK). RNA was extracted from both microdissected CIS and normal lung epithelium FFPE tissues using the RNeasy FFPE kit (Qiagen, Valencia, CA, USA). RNA concentration was measured using the Qubit® 2.0 Fluorometer (Invitrogen, Carlsbad, CA, USA). RNA integrity was analysed using the Agilent 2100 Bioanalyzer (Agilent, Santa Clara, CA, USA). Reverse transcription (RT) was performed with qScript™ cDNA SuperMix (Quanta Biosciences) according to the manufacturer’s protocol. Real-time quantitative RT-PCR analysis was executed on an Eppendorf real-time PCR machine, using TaqMan gene expression assay probes (Applied Biosystems) for LRIG1 (Hs01006148_m1) and EGFR (Hs01076073_m1) and TaqMan endogenous control probes (Applied Biosystems) for 18s rRNA (Hs03928990_g1), β2-M (Hs00187842_m1), and HPRT (Hs01003267_m1). As the size of most RNA fragments from typical FFPE samples is around 100 nucleotides, all the TaqMan gene expression assay and endogenous probes were chosen to produce amplicons as short as possible (lower than 73 nt). Expression of the LRIG1 and EGFR mRNA was quantified using the threshold cycle (Ct) method and normalized to the amount of 18S rRNA, HPRT, and β2-M. The mean of several Cts of the housekeeping genes had to be lower than 30, otherwise the sample was treated as unsuitable for qRT-PCR. Each sample was tested in triplicate and a sample without template was included in each run as a negative control.
Loss of heterozygosity (LOH) analysis
AffymetrixSNP 6.0 data were provided by the Wellcome Trust Sanger Institute Cancer Genome Project. The PICNIC algorithm uses a hidden Markov model approach to estimate allele-specific integer copy numbers 23. We defined all genomic regions with no copy of at least one LRIG1 allele as LRIG1 LOH. Genomic regions showing zero copies of the minor allele and two or more copies of the major allele were defined as copy neutral LOH. The percentage of cell lines showing no LOH, copy neutral LOH, and hemizygous deletions was counted for (i) all lung cancer cell lines and (ii) all squamous cell lines. The data were obtained from the Wellcome Trust Sanger Institute Cancer Genome Project website, http://www.sanger.ac.uk/genetics/CGP.
DNA was extracted from ten microdissected CIS and ten matched normal lung epithelium FFPE tissues using the Arcturus® PicoPure® DNA Extraction Kit (ABI). LOH was analysed by PCR amplification using one informative LRIG1 microsatellite marker (66457092–66457543). The fluorescent-labelled primer sequences for the microsatellite marker were (6FAM)-5′-TCTTTAAGAAGACTCCCTGTTTGTT-3′ and 5′-GCCCCCTGCTGTCAAACT-3′. PCR reactions were run on an ABI 373 DNA sequencer, with real-time fluorescence detection of PCR products. An internal size standard was used in each lane to give accurate base-pair determinations. Data were inspected using the Peak Scanner software (ABI).
Allele ratios were determined by measuring the fluorescence intensity (peak height) of the smaller (base-pair) allele 1 relative to the FU intensity of the larger allele 2 (A/B). LOH was determined by assessing the ratio of peak heights in CIS tissue samples relative to the ratio in the corresponding normal samples; a two-fold or greater change in the allelic ratio was considered evidence of LOH.
Results
Lrig1 loss causes hyperproliferation of the murine upper airways with increased EGFR phosphorylation
Using immunofluorescence and in situ hybridization, we showed that normal murine airways express LRIG1 throughout the trachea and first few bronchial divisions (Figures 1a and 1b, day 0/undamaged, and Supplementary Figure 2). LRIG1 is expressed ubiquitously in the airways during steady-state homeostasis with co-immunofluorescence staining seen with keratin 14-positive cells (basal), Clara-cell secretory protein-positive cells (Clara cells), and acetylated tubulin-positive cells (ciliated) (data not shown).
Figure 1.
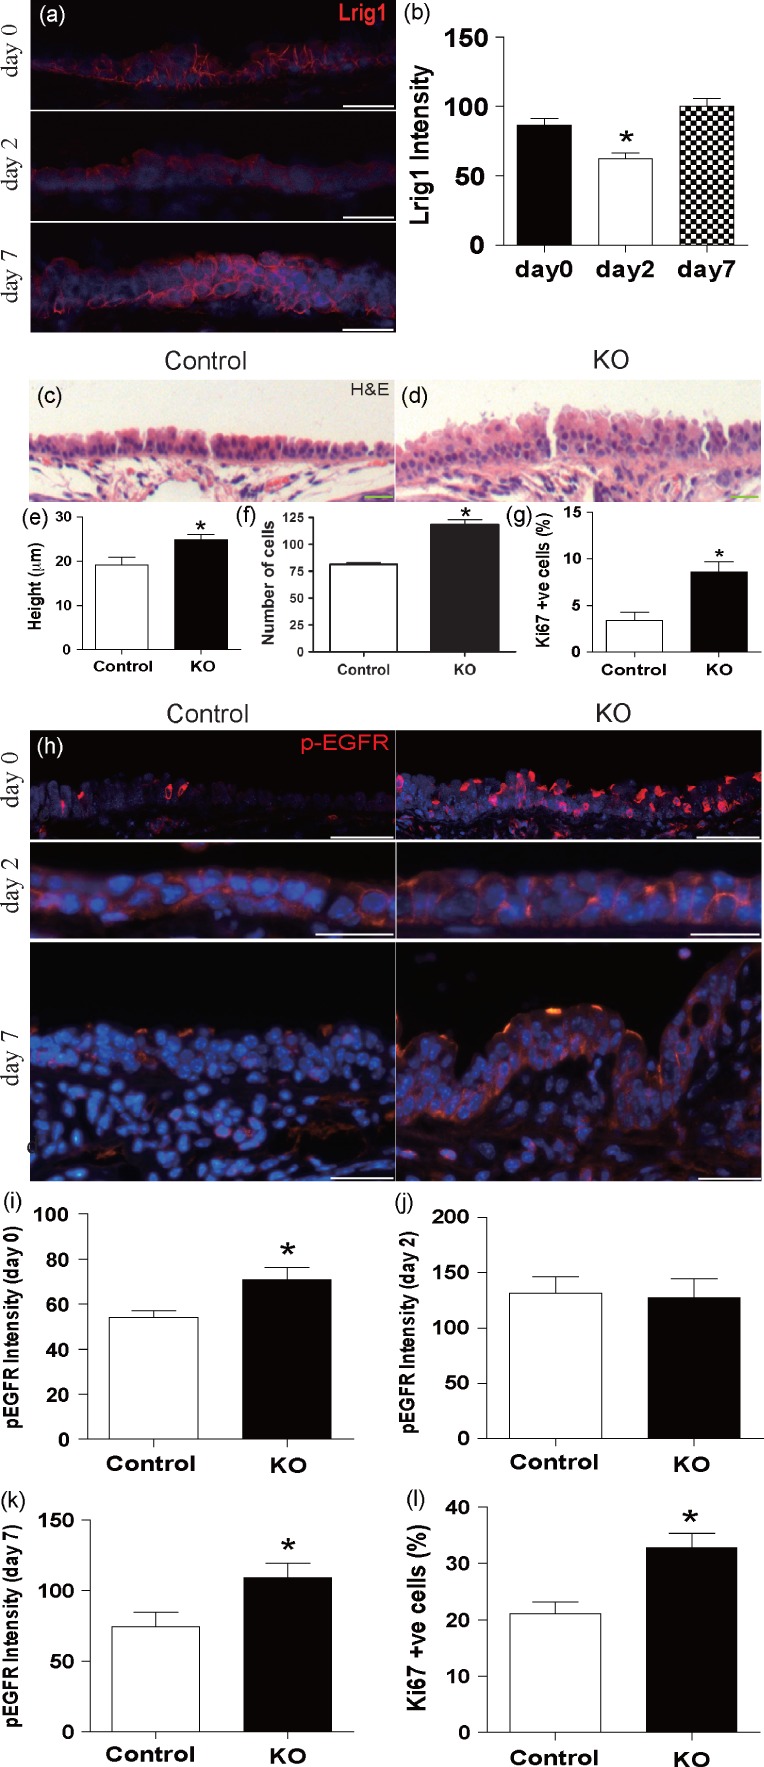
Deletion of Lrig1 causes hyperproliferation of the upper airways. (a, b) Immunofluorescence with a histogram of the signal intensity for LRIG1 in normal murine tracheal epithelium before polidocanol-generated tracheal injury (day 0), and days 2 and 7 after injury (one-way ANOVA and Tukey’s multiple comparison test; *day 0 versus day 2, p = 0.004). (c–g) Comparison of Lrig1−/− mice with littermate controls. (c–f) H&E staining with quantification of tracheal epithelial thickness and number of cells per 200 µm of basement membrane (unpaired t-test, mean ± SEM, 24.9 ± 1.2 µm versus 19.1 ± 1.7 µm; p = 0.03 and 118.3 ± 8.9 versus 81.3 ± 3.0; *p = 0.001). (g) Ki67 immunostaining and corresponding quantification (Mann–Whitney test, 8.6% ± 1.1% versus 3.4% ± 0.3%, p = 0.03). (h) Immunostaining of phospho-EGFR in Lrig1−/− mice (KO) and littermate tracheal epithelium before polidocanol-generated tracheal injury with fluorescence intensity histograms at (i) day 0 (*unpaired t-test p = 0.04), and (j) day 2 (p = 0.85) and (k) day 7 (*p = 0.04) after injury. (l) Proliferation index of Ki67 immunoreactivity in Lrig1−/− and littermate control tracheal epithelium day 7 post-injury. (All statistical values, mean ± SEM; **Mann–Whitney test, p = 0.03.) Scale bars = 20 µm.
As EGFR signalling is known to be important during tissue repair, we first analysed whether Lrig1 expression changes upon airway epithelial damage after oropharyngeal instillation of the detergent polidocanol. By indirect immunofluorescence and in situ hybridization, we observed a transient reduction in LRIG1 expression 48 h post-injury (Figures 1a and 1b and Supplementary Figure 2). This coincided with the onset of the proliferative phase of the injury response (Supplementary Figure 3).
In order to determine whether Lrig1 is required for airway homeostasis, we analysed tissue from the Lrig1 knockout mouse model 9. Loss of LRIG1 was confirmed by immunofluorescence (Supplementary Figure 4a) and caused a significant increase in epithelial thickness and the number of cells per 200 µm of basement membrane in the trachea and first two bronchial generations compared with littermate controls (mean ± SEM; 24.9 ± 1.2 mm versus 19.1 ± 1.7 mm; unpaired t-test p = 0.03; and 118.3 ± 8.9 versus 81.3 ± 3.0; unpaired t-test p = 0.001, Figures 1c–1f). Ki67 staining of the trachea and bronchi demonstrated that the increased thickness is associated with increased proliferation in the Lrig1−/− airway epithelium (8.6% ± 1.1% of Lrig1−/− versus 2.4% ± 0.3% of control cells express Ki67; Mann–Whitney; p = 0.03; Figure 1g). In spite of the significant changes to the epithelium, the proportion of basal, Clara, and ciliated cells was maintained upon loss of LRIG1 (Supplementary Figures 4b–4d). We conclude that LRIG1 controls proliferation within the upper airways without affecting lineage-specific differentiation.
Figure 4.
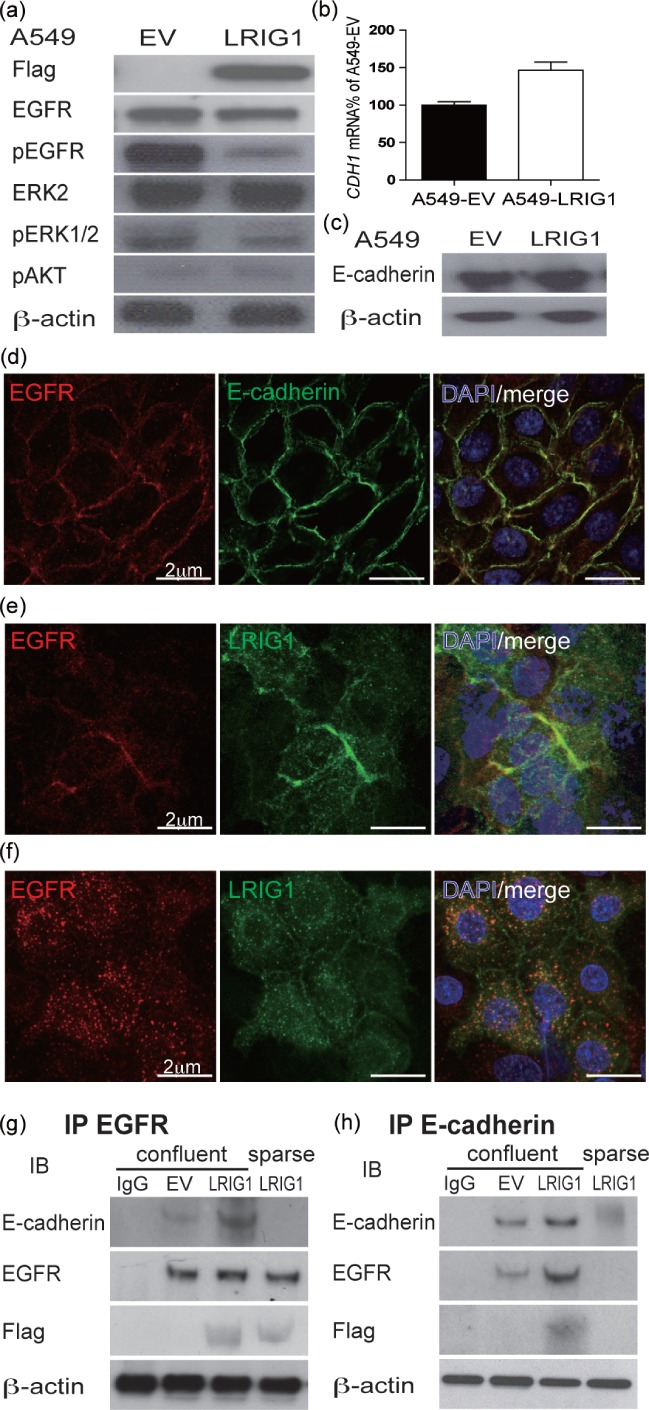
LRIG1 reduces EGFR signalling after co-localizing at adherens junctions with EGFR and E-cadherin. (a) Immunoblots of A549-EV and A549-LRIG1 cells with the indicated antibodies showing LRIG1 reduction in EGFR/ERK phosphorylation. (b) qPCR of E-cadherin (CHD1) in A549-EV and A549-LRIG1. (c) Immunoblot of A549-EV and A549-LRIG1 cells for E-cadherin. (d) Confocal image of E-cadherin and EGFR co-localization with immunostaining. (e) EGFR and LRIG1 co-localization; (f) this association was blocked with the addition of EDTA for 2 h to cultures to disrupt the adherens junction. (g) EGFR and (h) E-cadherin immunoprecipitation experiments of cell lysates from A549-EV and A549-LRIG1 cells show that LRIG1, EGFR, and E-cadherin form a ternary complex at cell confluence (subsequent immunoblots with the indicated antibodies).
In the epidermis, LRIG1 regulates EGFR signalling 8. Immunofluorescence staining for activated EGFR showed increased pEGFR levels in Lrig1 KO mice during steady-state homeostasis (Figures 1h, day 0, and 1i). Following injury by polidocanol, the levels of pEGFR increased in control animals in line with cellular proliferation (Supplementary Figure 3) and the difference between Lrig1 KO and control animals disappeared (Figures 1h, day 2, and 1j). In control animals, the levels of EGFR activation subsequently returned to normal by day 7, but remained elevated in the Lrig1−/− mice (Figures 1h, day 7, and 1k). This is associated with increased proliferation at day 7 in Lrig1−/− mice compared with littermate controls (32.7% ± 5.1% versus 21.1% ± 4.1%, Mann–Whitney p = 0.03) (Figure 1l). The dynamic expression pattern of LRIG1 during injury suggests that it controls either airway cell differentiation or proliferation. As Lrig1−/− mice display normal epithelial differentiation (Figure 1), this indicates that LRIG1 controls proliferation.
Lrig1 depletion leads to a failure of density-dependent growth inhibition in murine tracheal epithelial cells and human cancer cell lines
To further examine the hyperproliferative phenotype of the Lrig1−/− mouse airways, we used murine tracheal epithelial cell (MTEC) air–liquid interface (ALI) cultures 24. In ALI cultures, the initial proliferative phase of the culture was carried out submerged in media until day 9, followed by a differentiation phase of confluent cells at an ALI (Figure 2a). Proliferation in sub-confluent MTEC cultures was examined at day 7 in submerged cultures or after moving to ALI at day 14 by incubating with BrdU 3 h before harvest. Day 7 pre-confluent cultures showed equivalent cellular proliferation in Lrig1−/− and control MTECs (Figure 2b). In contrast, proliferation of Lrig1−/− MTECs post-confluence (day 14) was significantly increased compared with littermate controls (Figure 2c). Cell fate decisions of confluent ALI Lrig1−/− cultures were again normal, with equivalent levels of K14 and acetylated tubulin-expressing cells (Figures 2d and 2e). Protein analysis from Lrig1−/− and control MTEC cultures demonstrated increased activation of the EGFR pathway under conditions with and without the EGF ligand (Figure 2f). Thus, LRIG1 regulates proliferation and EGFR responsiveness in MTEC cultures.
Figure 2.
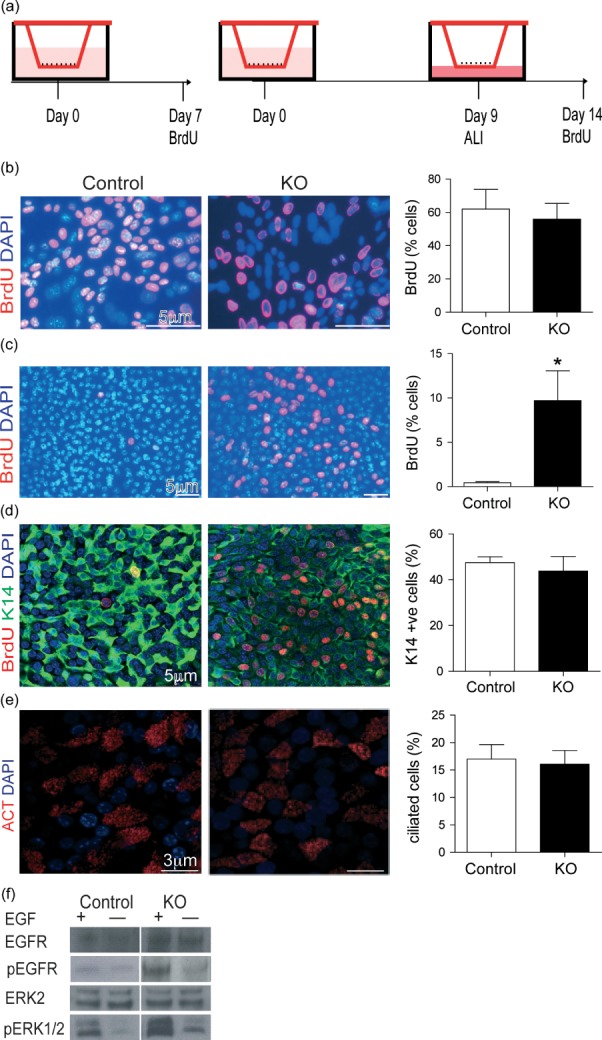
Lrig1−/− (KO) tracheal epithelial cells show continued proliferation at cell confluence in air–liquid interface culture. (a) Diagram of ALI culture and experimental time points. (b) Immunostaining of BrdU in MTEC culture pre-confluence and corresponding quantification (KO versus control, 55.9% ± 9.5% versus 62.0% ± 11.8%, p > 0.05, n = 4). (c) Immunostaining of BrdU in MTEC cultures at day 14 (5 days after cell confluence) showed increased BrdU immunostaining in Lrig1−/− MTECs compared with controls (9.7% ± 3.4% versus 0.5% ± 0.1%, p = 0.03, n = 4). (d) Co-staining of keratin 14 (K14, green) with BrdU (red) and (e) acetylated tubulin (ACT, red), showing no difference between KO and control MTEC differentiation at ALI culture day 14 (control cells K14-positive 47.0% ± 11.4% versus KO cells 54.2% ± 9.2%, p > 0.05; control cells ACT-positive 17.0% ± 2.6% versus KO cells 16.1% ± 2.5%, p > 0.05). (f) Immunoblots showing increased ERK1/2 phosphorylation of KO MTECs compared with controls. Cells were growth factor-starved for 14 h and then stimulated or not for 30 min with 20 ng/ml EGF. All statistical values, mean ± SEM; Mann–Whitney U-test.
The loss of contact inhibition in the Lrig1−/− airway epithelial cells suggests that LRIG1 may be a tumour suppressor in lung cancer cells. Human lung A549 (adenocarcinoma) and H357 (squamous) cancer cell lines show little or no expression of LRIG1 compared with normal human bronchial epithelial cells (BEAS-2B), while having high expression of EGFR (Figure 3a). These cell lines were transduced with a retrovirus expression vector encoding a flag-tagged LRIG1 construct or empty vector control (transduction confirmed by immunofluorescence, immunoblotting, and qPCR, Figures 3b and 3c) and effects on proliferation were examined pre- and post-confluence. At pre-confluence, overexpression of LRIG1 did not affect proliferation (A549: 78.2% ± 3.8% versus 74.9% ± 4.4%, p > 0.05; H357: 58.0% ± 6.6% versus 56.1% ± 3.9%, p > 0.05) (Figures 3d and 3f). However, upon confluence, expression of exogenous Lrig1 caused a significant reduction in proliferation (A549s: 13.3% ± 0.7% versus 6.1% ± 1.7%, p = 0.03; H357: 56.3% ± 7.7% versus 40.1% ± 6.9%, p = 0.03) (Figures 3e and 3g). Hence, the re-expression of LRIG1 is sufficient to restore cell–cell contact inhibition. Moreover, this is specific to cancerous cells lines, as normal bronchial epithelial cells (BEAS-2B cells) that express endogenous LRIG1 show no change in cell proliferation upon expression of exogenous LRIG1 (Supplementary Figure 5).
Figure 3.

LRIG1 transduction induces density-dependent growth inhibition in human cancer cells and inhibits tumourigenesis. (a) qPCR of endogenous LRIG1 and EGFR transcripts shows loss of LRIG1 in cancer cells (A549 and H357) compared with control human airway cells (BEAS-2B). (b, c) Immunostaining of flag in empty vector (EV) and LRIG1flag transduced cells, (b) A549s and (c) H357 cells, with LRIG1 qPCR and immunoblotting for flag confirming expression. (d, e) A549 and (f, g) H357 immunostaining of BrdU in EV and LRIG1 transduced cells at pre- and post-confluence, with the corresponding histogram of BrdU-positive cells (A549, *p = 0.03). (h–j) LRIG1 transduction inhibits tumourigenicity in an immunocompromised mouse model. Nine of ten mice grew tumours in the H357-EV cell group, as opposed to only one of 11 in the LRIG1 transduced group. Original magnification: (b, c) ×40; (d–g) ×10.
To examine LRIG1 effects on tumourigenicity, we retrovirally transduced the LRIG1-negative human squamous carcinoma cell line H357 with LRIG1 or empty vector control and cells were injected subcutaneously into immunocompromised mice. In the empty vector group, nine of ten tumours grew over 7 weeks, while only one of 11 grew in the LRIG1 transduced cells (Figures 3h–3j).
LRIG1 complexes with E-cadherin and EGFR at the adherens junction
In order to understand how LRIG1 affects proliferation upon cell–cell contact, we first examined the activation of the EGFR signalling pathways in LRIG1-null cells compared with LRIG1 transduced cells. We found that introduction of LRIG1 to human cancer cells reduced phospho-EGFR levels and the downstream effecter phospho-ERK1/2, while having no effect on the activation of Akt (Figure 4a). Homophilic E-cadherin interactions are known to affect EGFR signalling in a similar manner 25, and we hypothesized that LRIG1 controls EGFR activity via functional adherens junctions. While LRIG1 transduction did not alter E-cadherin levels (Figures 4b and 4c), we did, however, observe that EGFR and E-cadherin, as well as EGFR and LRIG1, co-localized at cell–cell contacts in a calcium-dependent manner (Figures 4d–4f). Co-immunoprecipitation experiments showed a modest interaction between E-cadherin and EGFR in the absence of LRIG1. This interaction was greatly enhanced upon LRIG1 transduction, showing that the three molecules form a ternary complex upon confluence (Figures 4g and 4h). We conclude that in both murine tracheal epithelial cells and human lung cancer cells, LRIG1 is required for effective density-dependent growth inhibition through inhibition of the EGFR–ERK1/2 pathway and that it forms a ternary complex at the cell membrane with E-cadherin and EGFR upon cell–cell contact.
LRIG1 gene expression is reduced in human pre-invasive lung cancer samples compared with patient matched controls and is associated with LOH in both pre-invasive samples and squamous cell cancer cell lines
As loss of LRIG1 causes hyperproliferation in vivo and failure of contact inhibition in vitro, we hypothesized that LRIG1 loss is an early initiation step for the development of cancers in the airways. This will lead to the formation of hyperplastic lesions and an environment prone to accumulation of additional genetic abnormalities 26.
mRNA and protein analysis of ten matched samples, comparing a pre-invasive carcinoma in situ (CIS) lesion with a normal airway biopsy taken from the same individual at the same time, showed reduced gene expression and immunoreactivity for LRIG1 in pre-invasive tissue compared with normal epithelium in all ten patients (Figures 5a and 5b). The reduction in LRIG1 expression was functionally mirrored by increased EGFR signalling (Figures 5c and 5d). This strongly identifies loss of LRIG1 as an early event in the pathogenesis of squamous cell lung cancer.
Figure 5.
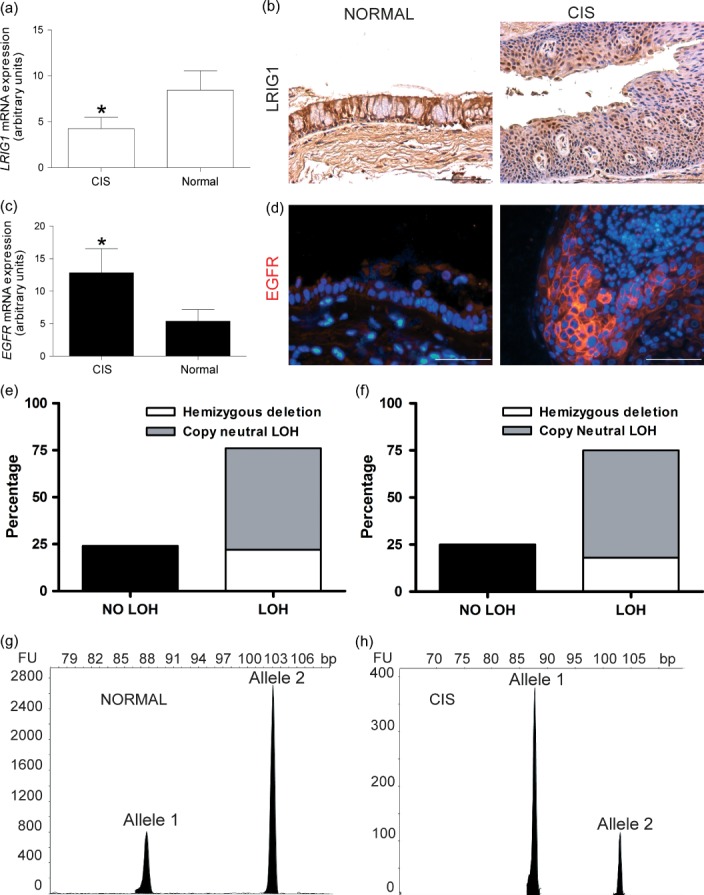
Early loss of LRIG1 in pre-invasive lung cancer lesions. (a) qPCR analysis of relative mRNA expression of LRIG1 in CIS and normal lung epithelium samples. There was a two-fold change of the LRIG1 mRNA level between CIS (n = 9) and patient matched normal (n = 10) samples (*p = 0.048). (b) Representative LRIG1 immunostained section of normal human lung epithelium and CIS lesions showing the loss of LRIG1 in CIS samples compared with patient matched controls. (c) qPCR analysis of relative mRNA expression for EGFR in CIS and normal lung epithelium samples showing a 2.4-fold change between CIS (n = 9) and normal (n = 10) samples (*p = 0.049). (d) Representative EGFR immunostaining of human lung CIS and normal epithelial sample showing EGFR up-regulation in CIS samples. (e, f) Frequency of LOH at the LRIG1 locus in lung and squamous cancer cell lines, respectively, as revealed by analysis of the Sanger Institute SNP-CGH. (g, h) LOH analysis with microsatellite marker in a matched patient–normal sample showing LOH of the LRIG1 locus.
Several studies have shown that loss of LRIG1 occurs in cancer and is associated with a poor prognosis 10,11,27-29. We performed loss of heterozygosity (LOH) analysis at the LRIG1 locus in 138 lung cancer and 37 squamous cell carcinoma cell lines as part of the Sanger Cancer Genome Project, which was carried out using the Affymetrix SNP6.0 array in conjunction with a bespoke algorithm (PICNIC: Predicting Integral Copy Numbers In Cancer) 23. This analysis showed that LOH at the LRIG1 locus had occurred in 75% of the lung cancer cell lines. Fifty-seven per cent of the cell lines showed copy neutral LOH and 18% showed hemizygous deletion (Figure 5e). Furthermore, 76% of the squamous cell carcinoma cell lines including those from the cervix, lung, head and neck, oesophagus, skin, tongue, upper aerodigestive tract, upper respiratory tract, and vulva had LOH of LRIG1 (Figure 5f). In all but one case, LOH was due to whole-arm loss or large chromosomal alteration on the 3p region, and so was not specifically targeted to the LRIG1 locus, but all do overlap with the LRIG1 locus (Supplementary Figures 6a and 6b).
Intriguingly, LOH also occurred in pre-invasive lung cancer lesions. Microsatellite LOH analysis was performed on the same ten pre-invasive lung cancer lesions and their patient matched controls using a heterozygous microsatellite marker within the LRIG1 gene, and revealed LRIG1 LOH in four pre-invasive lung cancer samples (Figures 5g and 5h). The lack of frozen tissue from these samples meant that we were unable to examine promoter methylation or seek a gene mutation in the remaining allele.
Discussion
Our data identify LRIG1 as an important regulator of tissue homeostasis in the major airways. We have demonstrated that LRIG1 acts as a tumour suppressor and forms a ternary complex at adherens junctions with E-cadherin and EGFR. LRIG1 controls EGFR/ERK1/2 activation upon cell–cell contact. Pre-invasive lung cancer lesions are characterized by loss of contact inhibition, increased epithelial proliferation, and elevated EGFR activation 6. Our findings therefore identify loss of LRIG1 as an early event in the pathogenesis of squamous cell lung carcinomas and provide insight into elevated EGFR activation in pre-invasive lesions. As loss of LRIG1 has been identified as one of four key events that predict patient outcome across five tumour types including 129 lung squamous cell carcinoma patients 11, we propose that this may be a general mechanism for controlling homeostasis in other epithelial tissues such as the epidermis 7. This has widespread implications for the role of cell–cell contact inhibition and regulation of EGFR signalling in development, tissue homeostasis, and disease.
EGFR and E-cadherin are known to co-localize on cell–cell contact, as we too have demonstrated. While E-cadherin protein levels increase five times at cell confluence, EGFR mRNA and protein levels remain constant but tyrosine kinase activity is reduced 30. The mechanism by which EGFR activation is reduced at cell confluence was not previously understood. A postulated way of producing this fall in EGFR phosphorylation is a direct inhibitory interaction between E-cadherin and EGFR but to our knowledge there are no data to support this. Our data show, however, that the endogenous EGFR inhibitory molecule LRIG1 is also recruited to the complex at cell confluency and is required for density-dependent growth inhibition.
LRIG1 is expressed in all tissues 31, and endogenous and synthetic LRIG1 has been confirmed to be plasma membrane-bound by cell surface biotinylation/precipitation and confocal immunofluorescence and laser microscopy 19. Previous data suggest that LRIG1 blocks EGFR activation through two possible mechanisms. First, LRIG1 transcript and protein are known to be up-regulated after EGF stimulation, which is thought to be a negative feedback mechanism, whereby it associates with all four EGFR analogues and both proteins are subsequently ubiquitinated by ubiquitin ligases 32. Alternatively, LRIG1 has been postulated to bind EGFR in a monomeric ‘attenuated’ state. This is because LRIG1 with the intracellular domain, including c-Cbl E3 ubiquitin ligase binding domain deleted, still attenuates EGFR activity without physical down-regulation of the protein and without competing for EGF binding 33. Our data suggest that the latter may be the case in density-dependent growth inhibition as we see no down-regulation of the EGFR protein itself but a dramatic fall in EGFR activity at cell–cell contact with LRIG1 expression.
In our extremely rare human samples of pre-invasive cancer lesions that have a matched local biopsy of normal airways, we have demonstrated loss of LRIG1 expression and LOH in four of ten lesions, but none in normal biopsies. It is tempting to hypothesize that this goes some way to understanding the mechanism of LRIG1 loss in the airways of smokers but our samples had DNA that was too degraded to examine for methylation or mutation abnormalities in the remaining allele. Our murine data demonstrating a clear phenotypic difference between Lrig1-null mice and heterozygotes mean that the LOH that we see in humans is unlikely to result in haploinsufficiency as a cause for the human pre-invasive lesions.
In addition to being unable to definitively define the genetic cause for loss of LRIG1 expression in the human pre-invasive lung cancer lesions, a further weakness in our study is the lack of definitive proof that the ternary complex formation leads to cell–cell contact inhibition. We have shown that LRIG1 is required and that LRIG1 forms a ternary complex with EGFR and E-cadherin but have not definitively demonstrated that the complex is necessary. To study this further, it would be interesting to make a series of E-cadherin mutants to try to inhibit LRIG1 binding in a bid to block cell–cell contact inhibition in the presence of LRIG1.
In summary, we have established LRIG1 as an important tumour suppressor gene in lung cancer in vitro and in vivo, with its loss occurring in the pre-invasive stages of human squamous carcinoma development. LRIG1 loss appears to be among the earliest abnormalities occurring in pre-cancerous airway epithelium, possibly leading to abnormal areas of proliferative epithelium that attract subsequent genetic mutations. Examination of data from expression profiling of CIS lesions confirms LRIG1 loss in CIS with a six-fold fall compared with normal epithelium 34. Whether this phenotype can be reversed may have an important impact on future chemopreventative strategies.
Acknowledgments
We would like to thank Richard Poulsom and Rosemary Jeffery at the Histopathology Laboratory at CR-UK London Research Institute for their technical expertise and help with in situ hybridization. We thank Steve Bottoms for tissue processing and embedding, and members of the UCL Centre for Respiratory Research for helpful comments and critical evaluation of the manuscript. We thank Chris Boshoff and Daniel Hochhauser for their help with the manuscript. SJ is a Wellcome Trust Senior Fellow in Clinical Science and is supported by the Rosetrees Trust. AG is a recipient of a European Research Council Starting Investigator award. KJ is a Wellcome Trust Career Development Fellow. Laser capture microdissection was performed in the UCL Cancer Institute and supported by the Experimental Cancer Medicine Centre. This work was partially undertaken at UCLH/UCL, which received a proportion of funding from the Department of Health’s NIHR Biomedical Research Centre’s funding scheme (SJ). The funders had no role in study design, data collection and analysis, decision to publish, or preparation of the manuscript.
Author contribution statement
LL, VHT, TAG, KBJ, AG, and SMJ conceived and designed the experiments. LL, VHT, ZY, DE, KK, NA, and NJH performed the experiments. LL, VHT, TAG, DE, KBJ, AG, and SMJ analysed the data. AN, MF, MK, CS, NAW, BC, FMW, JG, KBJ, AG, and SMJ contributed reagents/materials/analysis tools. VHT, AG, and SJ wrote the paper.
SUPPORTING INFORMATION ON THE INTERNET
The following supporting information may be found in the online version of this article.
No significant difference in airway epithelial morphology, cellularity or proliferation was found between LRIG1 WT and HET mice.
Deletion of Lrig1 causes hyperproliferation of the upper airways.
Demonstration of polidocanol damage to the upper airways.
Lrig1 deletion does not affect cell fate decisions in vivo.
LRIG1 transduction does not affect density-dependent growth inhibition in normal epithelial BEAS-2B cells with endogenous LRIG1 expression.
(a, b) Regions of allelic loss for each cancer cell line that showed LOH of the LRIG1 locus.
References
- 1.Puddicombe SM, Polosa R, Richter A, et al. Involvement of the epidermal growth factor receptor in epithelial repair in asthma. FASEB J. 2000;14:1362–1374. doi: 10.1096/fj.14.10.1362. [DOI] [PubMed] [Google Scholar]
- 2.Tyner JW, Kim EY, Ide K, et al. Blocking airway mucous cell metaplasia by inhibiting EGFR antiapoptosis and IL-13 transdifferentiation signals. J Clin Invest. 2006;116:309–321. doi: 10.1172/JCI25167. [DOI] [PMC free article] [PubMed] [Google Scholar]
- 3.Kim S, Schein AJ, Nadel JA. E-cadherin promotes EGFR-mediated cell differentiation and MUC5AC mucin expression in cultured human airway epithelial cells. Am J Physiol Lung Cell Mol Physiol. 2005;289:L1049–L1060. doi: 10.1152/ajplung.00388.2004. [DOI] [PubMed] [Google Scholar]
- 4.Miettinen PJ, Warburton D, Bu D, et al. Impaired lung branching morphogenesis in the absence of functional EGF receptor. Dev Biol. 1997;186:224–236. doi: 10.1006/dbio.1997.8593. [DOI] [PubMed] [Google Scholar]
- 5.Vermeer PD, Einwalter LA, Moninger TO, et al. Segregation of receptor and ligand regulates activation of epithelial growth factor receptor. Nature. 2003;422:322–326. doi: 10.1038/nature01440. [DOI] [PubMed] [Google Scholar]
- 6.Rusch V, Klimstra D, Linkov I, et al. Aberrant expression of p53 or the epidermal growth factor receptor is frequent in early bronchial neoplasia and coexpression precedes squamous cell carcinoma development. Cancer Res. 1995;55:1365–1372. [PubMed] [Google Scholar]
- 7.Jensen KB, Collins CA, Nascimento E, et al. Lrig1 expression defines a distinct multipotent stem cell population in mammalian epidermis. Cell Stem Cell. 2009;4:427–439. doi: 10.1016/j.stem.2009.04.014. [DOI] [PMC free article] [PubMed] [Google Scholar]
- 8.Jensen KB, Watt FM. Single-cell expression profiling of human epidermal stem and transit-amplifying cells: Lrig1 is a regulator of stem cell quiescence. Proc Natl Acad Sci U S A. 2006;103:11958–11963. doi: 10.1073/pnas.0601886103. [DOI] [PMC free article] [PubMed] [Google Scholar]
- 9.Suzuki Y, Miura H, Tanemura A, et al. Targeted disruption of LIG-1 gene results in psoriasiform epidermal hyperplasia. FEBS Lett. 2002;521:67–71. doi: 10.1016/s0014-5793(02)02824-7. [DOI] [PubMed] [Google Scholar]
- 10.Tanemura A, Nagasawa T, Inui S, et al. LRIG-1 provides a novel prognostic predictor in squamous cell carcinoma of the skin: immunohistochemical analysis for 38 cases. Dermatol Surg. 2005;31:423–430. doi: 10.1111/j.1524-4725.2005.31108. [DOI] [PubMed] [Google Scholar]
- 11.Rouam S, Moreau T, Broet P. Identifying common prognostic factors in genomic cancer studies: a novel index for censored outcomes. BMC Bioinformatics. 2010;11:150. doi: 10.1186/1471-2105-11-150. [DOI] [PMC free article] [PubMed] [Google Scholar]
- 12.Macpherson H, Keir P, Webb S, et al. Bone marrow-derived SP cells can contribute to the respiratory tract of mice in vivo. J Cell Sci. 2005;118:2441–2450. doi: 10.1242/jcs.02375. [DOI] [PubMed] [Google Scholar]
- 13.Giangreco A, Lu L, Mazzatti DJ, et al. Myd88 deficiency influences murine tracheal epithelial metaplasia and submucosal gland abundance. J Pathol. 2011;224:190–202. doi: 10.1002/path.2876. [DOI] [PMC free article] [PubMed] [Google Scholar]
- 14.Reynolds SD, Zemke AC, Giangreco A, et al. Conditional stabilization of beta-catenin expands the pool of lung stem cells. Stem Cells. 2008;26:1337–1346. doi: 10.1634/stemcells.2008-0053. [DOI] [PMC free article] [PubMed] [Google Scholar]
- 15.Giangreco A, Reynolds SD, Stripp BR. Terminal bronchioles harbor a unique airway stem cell population that localizes to the bronchoalveolar duct junction. Am J Pathol. 2002;161:173–182. doi: 10.1016/S0002-9440(10)64169-7. [DOI] [PMC free article] [PubMed] [Google Scholar]
- 16.Janes SM, Ofstad TA, Campbell DH, et al. Transient activation of FOXN1 in keratinocytes induces a transcriptional programme that promotes terminal differentiation: contrasting roles of FOXN1 and Akt. J Cell Sci. 2004;117:4157–4168. doi: 10.1242/jcs.01302. [DOI] [PubMed] [Google Scholar]
- 17.Legg J, Jensen UB, Broad S, et al. Role of melanoma chondroitin sulphate proteoglycan in patterning stem cells in human interfollicular epidermis. Development. 2003;130:6049–6063. doi: 10.1242/dev.00837. [DOI] [PubMed] [Google Scholar]
- 18.Janes SM, Watt FM. Switch from alphavbeta5 to alphavbeta6 integrin expression protects squamous cell carcinomas from anoikis. J Cell Biol. 2004;166:419–431. doi: 10.1083/jcb.200312074. [DOI] [PMC free article] [PubMed] [Google Scholar]
- 19.Nilsson J, Starefeldt A, Henriksson R, et al. LRIG1 protein in human cells and tissues. Cell Tissue Res. 2003;312:65–71. doi: 10.1007/s00441-003-0697-1. [DOI] [PubMed] [Google Scholar]
- 20.You Y, Richer EJ, Huang T, et al. Growth and differentiation of mouse tracheal epithelial cells: selection of a proliferative population. Am J Physiol Lung Cell Mol Physiol. 2002;283:L1315–L1321. doi: 10.1152/ajplung.00169.2002. [DOI] [PubMed] [Google Scholar]
- 21.Loebinger MR, Giangreco A, Groot KR, et al. Squamous cell cancers contain a side population of stem-like cells that are made chemosensitive by ABC transporter blockade. Br J Cancer. 2008;98:380–387. doi: 10.1038/sj.bjc.6604185. [DOI] [PMC free article] [PubMed] [Google Scholar]
- 22.Poulsom R, Longcroft JM, Jeffery RE, et al. A robust method for isotopic riboprobe in situ hybridisation to localise mRNAs in routine pathology specimens. Eur J Histochem. 1998;42:121–132. [PubMed] [Google Scholar]
- 23.Greenman CD, Bignell G, Butler A, et al. PICNIC: an algorithm to predict absolute allelic copy number variation with microarray cancer data. Biostatistics. 2010;11:164–175. doi: 10.1093/biostatistics/kxp045. [DOI] [PMC free article] [PubMed] [Google Scholar]
- 24.Giangreco A, Lu L, Mazzatti D, et al. Myd88 deficiency influences murine tracheal epithelial differentiation and submucosal gland abundance. J Pathol. 2011;224:190–202. doi: 10.1002/path.2876. [DOI] [PMC free article] [PubMed] [Google Scholar]
- 25.Qian X, Karpova T, Sheppard AM, et al. E-cadherin-mediated adhesion inhibits ligand-dependent activation of diverse receptor tyrosine kinases. EMBO J. 2004;23:1739–1748. doi: 10.1038/sj.emboj.7600136. [DOI] [PMC free article] [PubMed] [Google Scholar]
- 26.Hanahan D, Weinberg RA. Hallmarks of cancer: the next generation. Cell. 2011;144:646–674. doi: 10.1016/j.cell.2011.02.013. [DOI] [PubMed] [Google Scholar]
- 27.Jensen KB, Jones J, Watt FM. A stem cell gene expression profile of human squamous cell carcinomas. Cancer Lett. 2008;272:23–31. doi: 10.1016/j.canlet.2008.06.014. [DOI] [PMC free article] [PubMed] [Google Scholar]
- 28.Lindstrom AK, Ekman K, Stendahl U, et al. LRIG1 and squamous epithelial uterine cervical cancer: correlation to prognosis, other tumour markers, sex steroid hormones, and smoking. Int J Gynecol Cancer. 2008;18:312–317. doi: 10.1111/j.1525-1438.2007.01021.x. [DOI] [PubMed] [Google Scholar]
- 29.Guo D, Nilsson J, Haapasalo H, et al. Perinuclear leucine-rich repeats and immunoglobulin-like domain proteins (LRIG1-3) as prognostic indicators in astrocytic tumours. Acta Neuropathol. 2006;111:238–246. doi: 10.1007/s00401-006-0032-5. [DOI] [PubMed] [Google Scholar]
- 30.Takahashi K, Suzuki K. Density-dependent inhibition of growth involves prevention of EGF receptor activation by E-cadherin-mediated cell–cell adhesion. Exp Cell Res. 1996;226:214–222. doi: 10.1006/excr.1996.0221. [DOI] [PubMed] [Google Scholar]
- 31.Nilsson J, Vallbo C, Guo D, et al. Cloning, characterization, and expression of human LIG1. Biochem Biophys Res Commun. 2001;284:1155–1161. doi: 10.1006/bbrc.2001.5092. [DOI] [PubMed] [Google Scholar]
- 32.Gur G, Rubin C, Katz M, et al. LRIG1 restricts growth factor signalling by enhancing receptor ubiquitylation and degradation. EMBO J. 2004;23:3270–3281. doi: 10.1038/sj.emboj.7600342. [DOI] [PMC free article] [PubMed] [Google Scholar]
- 33.Goldoni S, Iozzo RA, Kay P, et al. A soluble ectodomain of LRIG1 inhibits cancer cell growth by attenuating basal and ligand-dependent EGFR activity. Oncogene. 2007;26:368–381. doi: 10.1038/sj.onc.1209803. [DOI] [PubMed] [Google Scholar]
- 34.Lonergan KM, Chari R, Coe BP, et al. Transcriptome profiles of carcinoma-in-situ and invasive non-small cell lung cancer as revealed by SAGE. PLoS One. 2010;5:e9162. doi: 10.1371/journal.pone.0009162. [DOI] [PMC free article] [PubMed] [Google Scholar]
Associated Data
This section collects any data citations, data availability statements, or supplementary materials included in this article.
Supplementary Materials
No significant difference in airway epithelial morphology, cellularity or proliferation was found between LRIG1 WT and HET mice.
Deletion of Lrig1 causes hyperproliferation of the upper airways.
Demonstration of polidocanol damage to the upper airways.
Lrig1 deletion does not affect cell fate decisions in vivo.
LRIG1 transduction does not affect density-dependent growth inhibition in normal epithelial BEAS-2B cells with endogenous LRIG1 expression.
(a, b) Regions of allelic loss for each cancer cell line that showed LOH of the LRIG1 locus.