Abstract
Since the early 1980’s, the enhanced backscattering (EBS) phenomenon has been well-studied in a large variety of non-biological materials. Yet, until recently the use of conventional EBS for the characterization of biological tissue has been fairly limited. In this work we detail the unique ability of EBS to provide spectroscopic, polarimetric, and depth-resolved characterization of biological tissue using a simple backscattering instrument. We first explain the experimental and numerical procedures used to accurately measure and model the full azimuthal EBS peak shape in biological tissue. Next we explore the peak shape and height dependencies for different polarization channels and spatial coherence of illumination. We then illustrate the extraordinary sensitivity of EBS to the shape of the scattering phase function using suspensions of latex microspheres. Finally, we apply EBS to biological tissue samples in order to measure optical properties and observe the spatial length-scales at which backscattering is altered in early colon carcinogenesis.
Index Terms: Enhanced backscattering, polarized light Monte Carlo, backscattering spectroscopy, cancer detection
I. Introduction
ENHANCED backscattering (EBS) is a coherence phenomenon in which rays traveling time-reversed paths within a scattering medium constructively interfere resulting in an angular intensity peak centered in the exact backscattering direction [1]–[4]. The shape of the angular EBS peak forms a Fourier pair with the spatial intensity distribution of backscattered light [5]. As a result, the EBS peak is extremely sensitive to the optical scattering, absorption, and polarization properties which alter the spatial intensity distribution of backscattered light. Utilizing this sensitivity, EBS has been studied in many substances including aqueous solutions, fractal aggregates [6], periodic dielectric slabs [7], amplifying random media [8], cold atoms [9], and liquid crystals [10].
However, the application of conventional EBS in biological tissue has been fairly limited [11]–[14] due in large part to a number of experimental factors which have made EBS inconvenient for the characterization of weakly scattering multilayered media such as biological tissue. These difficulties include very sharp peaks that are potentially masked by speckle noise, the inability to acquire spectroscopic measurements, and the lack of an appropriate model to extract tissue optical properties. In order to overcome these difficulties, low-coherence enhanced backscattering (LEBS) which combines spectrally resolved detection with broadband illumination from a thermal source was developed in 2004 [15]. This novel application of EBS enables spectroscopic analysis which can yield valuable information about nano-scale structural composition as well as the presence of chromophores (e.g. hemoglobin and melanin) which are present within the specimen under observation [16]. In addition, the spatial coherence length (Lsc) of the illumination can be easily controlled according to the van Cittert-Zernike theorem [17]. This is advantageous because it simultaneously reduces the presence of speckle noise while providing a method to selectively interrogate the optical signal from within different depths of a sample. It is these benefits which have helped LEBS become a promising technology for the early detection of colorectal [18] and pancreatic cancer [19], [20] by observing alterations in epithelial tissue structure which are not otherwise identifiable using conventional histology.
More recently, the study of spectroscopic EBS has been extended into the fully coherent regime with the development of affordable broadband lasers [21]. Previously, it had been shown that if a two-dimensional (backscattering as function of θx and θy) EBS peak is acquired, the LEBS peak for any Lsc can be obtained through post-processing without any loss of information [16]. This means that the LEBS signal originating from different depths within a biological tissue specimen can be reconstructed using a single EBS measurement. Therefore, the most advantageous way to realize the depth-selective abilities of LEBS is to use fully coherent EBS.
One of the main goals of optical characterization of biological media is to determine the optical properties of the tissue under observation. Of primary interest are the scattering mean free path ls, absorption coefficient μa, anisotropy factor g = 〈cos(θ)〉, and a second parameter of the scattering phase function D which we describe in the Methods section. In order to relate the EBS peak to these optical properties, some general model is needed. The most commonly used description of the EBS peak shape was derived by Akkermans et al using a scalar diffusion approximation [5]. This analytical formulation provides a reasonable estimation of the peak shape in the helicity preserving polarization channel, but cannot predict the complicated azimuthal behavior of the peak in other polarization channels and does not take into consideration the shape of the phase function. As an attractive alternative, polarized light Monte Carlo simulations give an exact solution to the radiative transfer equation (provided that a sufficient number of rays are traced). Modeling of the EBS peak using Monte Carlo simulations is fairly common and demonstrates an excellent agreement with experiment [12], [22]–[24], [26], [29], [34], [36]. In addition all effects of partial spatial coherence illumination and polarization can be described using this model [16], [25], [26], [30], [34], [36].
In this paper, we first discuss the experimental and numerical methodologies used to accurately measure and model the EBS peak. Next, we explore the effects of polarization on the azimuthal shape of the peak using an aqueous suspension of latex microspheres and demonstrate the extraordinary sensitivity of EBS to the shape of the phase function. We then demonstrate the effects of partial coherence illumination on the shape of the EBS peak as well as its sensitivity to rays exiting the medium at different spatial locations. Finally, we demonstrate the application of EBS to biological tissue and illustrate the usefulness of LEBS for observing alterations which occur in early stage cancer.
II. Materials and methods
A. Theoretical Overview of EBS
The EBS intensity cone originates from the constructive interference which occurs between a multiply scattered ray and its corresponding time-reversed partner (a direct consequence of the reciprocity theorem). Conceptually, it is useful to understand this effect through analogy with the diffraction pattern observed in a simple Young’s double pinhole experiment [16], [22], [25]. Consider a single time-reversed path-pair in which the exit points of the two rays are separated by some distance. The diffraction pattern from this single time-reversed path-pair is simply the Fourier transform of two delta functions, which gives rise to a sine wave pattern. In a semi-infinite scattering medium, an infinite number of time-reversed path-pairs with different spatial separations will combine to form the EBS peak. As such, under a scalar approximation the EBS peak is simply the summed diffraction pattern from all possible sets of time-reversed path-pairs or, in other words, the Fourier transform of the spatial reflectance profile of light in a random scattering medium illuminated by an infinitely narrow pencil beam, Ims(x, y). Here, Ims(x, y) represents the intensity of multiply scattered light which exits the medium at a position (x,y) away from where it entered and in a direction that is anti-parallel to the incident beam. Since rays undergoing single scattering (Iss) cannot form time-reversed paths, they do not contribute to the EBS interference signal. Normalizing by the diffuse baseline which is composed of all orders of scattering, the two dimensional EBS peak can be represented as [22]:
| (1) |
Simplifying Eq. 1, the appropriately normalized spatial intensity distribution can be written as p(x, y) and the Fourier transform operation can be denoted with the ℱ symbol:
| (2) |
Under a scalar theory, each path-pair can completely interfere and the predicted peak height reaches a value that is twice the incoherent baseline (in the absence of single scattering). However, in reality the vector wave nature of electromagnetic radiation plays a large role in determining the shape and height of the EBS peak, as will be demonstrated in the Results section. In the strictest sense, the reciprocity theorem is only fully satisfied if the illumination and collection polarizations states are exactly the same. Thus, to a first approximation an EBS peak is only expected to appear in the polarization preserving channels (i.e. linear co-polarized (xx) and helicity preserving (++)). In this case, each multiply scattered ray must possess a time-reversed partner which exits with the same magnitude and accumulated phase. As a result, path-pairs exiting at any (x,y) separation have perfectly correlated phase and can fully interfere. However, even in the orthogonal polarization channels (i.e. linear cross-polarized (xy) and opposite helicity (+−)) an EBS peak can still be observed [13], [22], [24], [27]. In this case, the reciprocity theorem no longer guarantees that each sequence of scattering events is fully reversible. As a result, light rays which are scattered into the orthogonal polarized channel may or may not have a time-reversed partner with which to interfere. In order to describe the ability of rays arriving at a particular separation to interfere, we introduce the degree of phase correlation function pc(x, y) which modulates the shape of Ims(x, y) for the orthogonal polarization channels. When pc = 1 the entire portion of intensity arriving at particular separation can interfere and when pc = 0 none of the intensity can interfere. Modifying the calculations of Lenke and Maret [28] for the case of no external magnetic field, pc can be calculated from the degree of linear and circular polarization:
| (3) |
where l is the path-length through which rays travels. These distributions are easily found using polarized Monte Carlo simulations [22], [28], [29]. In general, pc is nearly 1 for very short path-lengths. As l increases, a larger proportion of rays travel through irreversible sequences of scattering events and pc → 0 as l → ∞ [29]. In addition to the polarization channels just introduced, we also use the notation (xo) and (+o) to represent linear illumination with unpolarized collection and circular illumination with unpolarized collection, respectively.
For samples such as biological tissue in which the spot size is not significantly larger than a transport mean free path it is necessary to find the effective spatial intensity distribution of light which remains inside the illumination spot size. This is because rays which exit outside of the illumination spot do not have a time-reversed partner and therefore will not contribute to the EBS interference signal. Typically the effective intensity distribution within an illumination spot is found by convolving Ims(x, y) (i.e. scattering medium spatial impulse-response) with the illumination spot size [30]. However, the EBS interference signal is dependent on the relative separations between path-pairs as opposed to their absolute position within the illumination spot. As a result, the effective EBS intensity distribution, , can be found by averaging truncated versions of Ims(x, y) from every position within the illumination spot:
| (4) |
where A is a function which represents the illumination spot size and the area of integration, Ω, is over the area of the illumination spot. Typically, the illumination spot is a circle and A is a top hat function (i.e. A = 1 for every position within the illumination spot and 0 outside). Note that the numerator in Eq. 4 is different from either a convolution or cross-correlation operation. This can be simplified as:
| (5) |
where ACF is the normalized autocorrelation function and s represents the function which modulates the shape of Ims(x, y) due to a finite spot size.
Under partial spatial coherence illumination, the interference signal is modulated by a coherence function c(x, y) which attenuates the signal for rays exiting outside of the spatial coherence area. In other words, c(x, y) works as a spatial filter that limits the contribution from longer path-pair separations allowing the measurement to emphasize information present at smaller path-pair separations. The regime where is known as the low-coherence or LEBS regime [15].
Combining the contributions from all of the functions which modulate the shape of p(x, y) and therefore alter the measurable EBS peak we obtain the following equation [29]:
| (6) |
where mtf(x, y) represents the modulation transfer function of the detection system. It is important to note that functions p and pc are instrinsic sample dependent properties while functions c, s, and mtf are extrinsic illumination and system properties [16].
In the following sections where it is useful to observe the radial intensity distribution we use the rotational sum of peff (x, y) which we denote as peff (r). This represents the summed intensity that exits the scattering medium in radial annuli which is located at a distance r away from its entrance point:
| (7) |
B. Experimental Instrumentation, Data Collection and Processing
The schematic for our experimental setup can be found in other publications [16], [25], [29]. The illumination consists of two broadband illumination sources which span the entire regime between complete incoherence and perfect spatial coherence. In order to obtain partial spatial coherence, a Xenon lamp (Oriel Instruments) is focused onto an aperture wheel with six high power tungsten apertures (Lenox laser) ranging in diameter from 0.25 mm to 1.75 mm. These apertures act as secondary sources which are collimated by a 200 mm focal length lens. According to the van-Cittert Zernike theorem, the coherence function can be obtained by computing the Fourier transform of the angular intensity distribution of each secondary source provided that the incident illumination is completely incoherent [17]. Since circular apertures are used, the coherence function takes the shape of a first-order Bessel function of the first kind J1:
| (8) |
where λ is the wavelength of illumination, f is the focal length of the collimating lens, and d is the diameter of the aperture. The coherence function for each aperture was verified by measuring the angular intensity distribution with a mirror directing the illumination beam towards the camera as well as with a series of Young’s double pinhole experiments [16]. Infinite spatial coherence is obtained using a broadband supercontinuum laser source (SuperK Versa, NKT photonics) coupled into a single mode fiber (Thorlabs; mode field diameter of 4.6 µm at 680 nm) which is then connected to the aperture wheel. It should be noted that although the single mode fiber output has a finite beam extent it can be regarded as spatially coherent, and so the van-Cittert Zernike theorem no longer applies.
After collimation, the beam passes through an iris which limits the beam diameter between 2–10 mm in size before being directed onto the sample. Backscattered light from the sample is then collected by a 50/50 non-polarizing antireflection coated plate beam splitter before being focused onto a CCD camera (PIXIS 1024B eXcelon, Princeton Instruments) by a 100 mm focal length achromatic lens. The alignment of the camera relative to the focusing lens is controlled with a motorized translation stage placed under the camera. Optimal alignment is achieved when the peak height is maximized. A liquid crystal tunable filter (LCTF, CRi instruments) attached to the camera separates the light into its component wavelengths. This configuration can detect angular backscattering of up to 7.5776° with 0.0074° resolution and wavelengths between 500 – 720 nm with 20 nm filter bandwidth.
When performing polarization experiments, special attention should be paid to the polarization effects of all optical elements within the system. For example, LCTFs are naturally linear polarizers. It should also be noted that non-polarizing beam splitters are not perfect for all wavelengths and all incident angles. As such, it is important to properly normalize when comparing different polarization states. For a backscattering setup, the optimal configuration is to place a linear polarizer directly preceding and following the beam splitter with a removable quarter-wave plate placed between the beam splitter and the sample. We have found the best configuration is to orient the analyzer and LCTF so they collect light that is TE polarized with respect to the plate beam splitter. All linear and elliptical polarization combinations are then selected by rotating the illumination polarizer (with quarter-wave plate for elliptical and without for linear).
Experimental data collection consists of four CCD camera measurements: 1) scattering sample 2) ambient background 3) reflectance standard (spectralon > 98% reflectance, Ocean Optics) and 4) flat field. The flat field is collected by illuminating the sample with essentially spatially incoherent light (Lsc < 10 µm) directly from the xenon lamp and collecting the linear cross-polarized channel. This measurement configuration ensures that the flat field contains no coherent portion and thus provides a measurement of the isolated incoherent baseline shape.
To process the data, the scattering sample and reflectance standard are first background subtracted. The scattering sample is then normalized by the total unpolarized incoherent intensity measured from the reflectance standard, and divided by the flat field which corrects both aberrations in the camera as well as vignetting in the incoherent baseline which occurs due to rays which exit the scattering medium outside of the illumination spot. The EBS peak is obtained by subtracting the incoherent baseline with a plane fit using data from an annular ring that is 3 degrees away from the maximum peak intensity.
The unpolarized incoherent intensity with which we normalize the scattering sample is the incoherent backscattered intensity that would be measured if the illumination and collection were completely unpolarized. The incoherent intensity for a particular polarization channel is measured by sampling an angular region on the CCD which is > 3 degrees away from the maximum peak intensity of the spectralon reflectance standard. The unpolarized incoherent intensity arriving at the sample can then be found based on a priori knowledge of the depolarization characteristics of the reflectance standard, as well as the amount of intensity lost due to specular reflection at the sample surface.
Conventionally, the EBS peak for a particular sample is normalized with respect to its own incoherent baseline. However, we choose to normalize by a reflectance standard because it makes measurements from different polarization channels and from samples with different absorption levels and thicknesses directly comparable. In addition, it avoids the common practice of placing an aperture at the sample surface in order to reject light which has traveled outside of the illumination spot [22].
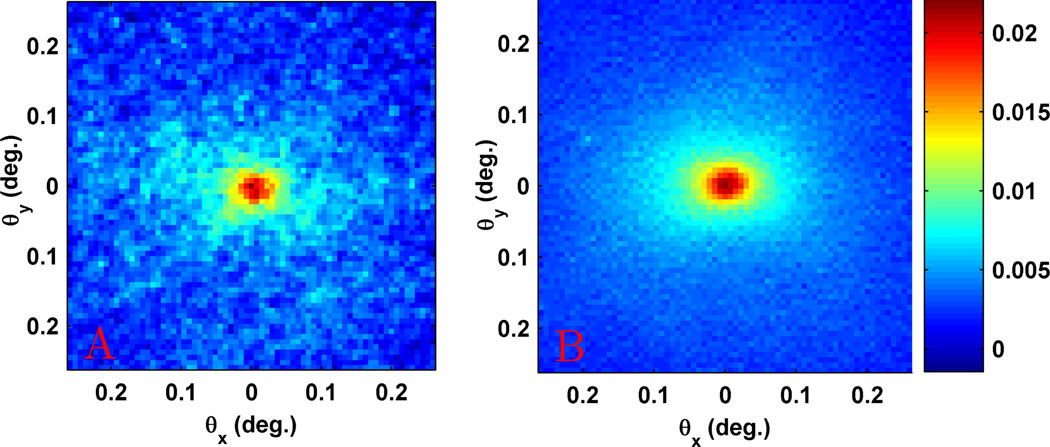
A common experimental difficulty experienced in EBS measurements of either biological tissue or stationary samples is the presence of large amounts of speckle noise which obscure the peak [13], [25]. In order to reduce this problem, some sort of ensemble averaging of the independent speckle patterns is needed. In LEBS, this is possible without moving the sample since every coherence area generates its own unique speckle pattern and there are thousands of coherence areas within each illumination spot [15]. In EBS, ensemble averaging must be performed by physically moving the sample. Yoon et al [13] found that a gentle shaking of the sample was sufficient to eliminate speckle, but used a rotating electric motor for increased consistency. For our tissue measurements we use a small vibration motor attached to the sample stage. This provides a small amount of motion that does not perturb the sample, but is sufficient to greatly reduce the speckle signal. In addition, since we use broadband illumination combined with spectrally resolved detection, the speckle signal is further reduced by the short temporal coherence length. Fig. 1a shows the speckle pattern observed for a stationary colon tissue section while Fig. 1b shows the speckle reduction obtained by gently vibrating the same sample.
Fig. 1.
(a) Speckle filled EBS measurement from stationary colon tissue. (b) Speckle reduction obtained with vibration motor placed on sample stage.
C. Modeling light propagation in biological tissue with the Whittle-Matérn family of correlation functions
In order to understand and parameterize the propagation of light within a random scattering medium, certain assumptions about that sample’s composition must be made. In biomedical applications, the Henyey-Greenstein phase function which was originally developed for the light scattering of interstellar dust is commonly used to model the propagation of light within biological tissue. However, in its basic form this is only a single parameter scalar approximation of the phase function which does not incorporate the effects of polarization. As an alternative, Mie theory can be used to fully model the effects of polarization in a sample composed entirely of spherical particles. This can be very useful for experimental validation purposes or when modeling biological tissue as a composition of cells with a limited number of different sizes. However, with structures ranging in size from a few tens of nanometers (e.g. chromatin fibers, ribosomes, cytoskeleton and other macromolecular structures) to microns (e.g. organelles in cells, collagen fibers in connective tissue matrix) to tens of microns (e.g. cells) light scattering in intact biological tissue may be better described as a continuous distribution of refractive index (RI) fluctuations [31]. Therefore, as a model to describe the expected RI correlation function Bn(r) within biological tissue we use a three-parameter model based on the Whittle-Matérn family of correlation functions [32]–[34]:
| (9) |
where KD−3 is the modified Bessel function of the second kind with order D − 3, lc describes the length scale of tissue heterogeneity, dn2 is the variance of the fluctuating portion of RI, and D is a parameter which describes the shape of the correlation function [32]. Beginning when D is ∞, the function is Gaussian in shape. As D decreases, the contribution of smaller length-scales becomes more prominent and the function takes the form of a decaying exponential (with lc being the exponential decay rate) when D = 4. When 0 < D < 3, the function exhibits a power law distribution for r ≪ lc and is by definition a fractal in which the fractal dimension is D. Thus, the Whittle-Matérn family of correlation functions encompasses many realistic distributions of scattering length-scales present in biological tissue.
According to the Wiener-Khinchin theorem, the power spectral density Φn(κ) at spatial frequency is the Fourier transform of Bn(r):
| (10) |
Applying the Born approximation for linear polarized plane wave illumination, the differential scattering cross section per unit volume can be calculated as [32], [35]:
| (11) |
where θ is the polar angle, ϕ is the azimuthal angle with ϕ = 0 oriented in the direction of the polarization vector, k is the wavenumber within the scattering medium. The phase function can then be found by normalizing Eq. 11 such that the integral over all solid angle is equal to unity. In the following section we use the Stokes vector formalism to generalize this result for any polarization.
The scattering coefficient (μs = 1/ls) can be found by integrating σ(θ, ϕ) over all solid angle. In biological tissue with klc ≪ 1 the dependencies of μs can be simplified as [36]:
| (12) |
Similarly, the dependencies of g can be found by computing the average cosine of the polar scattering angle 〈cos(θ)〉 :
| (13) |
From the dependencies of μs and g we can find the reduced scattering coefficient :
| (14) |
Optically it is useful to describe tissue in terms of a RI correlation function, since RI fluctuations give rise to scattering. Alternatively, RI fluctuations can also be described in terms of mass density fluctuations. This is because according to the Gladstone-Dale relationship, RI (n) is a linear function of local mass density (ρ) [37]:
| (15) |
where nm is the RI in the surrounding medium and αs is the specific refractive increment (cm3/g) with values between ~0.17 to 0.2 for biological materials (e.g. proteins, lipids, carbohydrates). This relationship is valid in biological materials for ρ up to ~ 50% [38]. Therefore, the shape of Bn(r) also provides information about the distribution of mass within the specimen.
D. Polarized light Monte Carlo simulations
Monte Carlo simulations provide an invaluable method to solve the radiative transfer equation when an analytical solution is either difficult or impossible to obtain. In the following paragraphs, we discuss the implementation of polarized light Monte Carlo simulations of Ims(x, y) for two cases: 1) discrete spherical particles (Mie) and 2) media with a continuous distribution of RI fluctuations (Whittle-Matérn, WM). We use the Mie simulations to validate our experimental procedure and explore the shape of the peak for different polarizations using well-controlled particle sizes, while we use the WM simulations to describe measurements of intact tissue. Both of these codes are based on modifications to the open source meridian plane polarized light Monte Carlo code developed by Ramella-Roman et al [41]. These modified codes can be found on our laboratory website [39].
Our scattering medium is modeled as a thick slab of fixed concentration and geometry with an of 100 µm and slab thickness that is 10 . This geometry limits transmission through the slab to less than 2% of the incident number of rays. Samples with other values of are obtained by rescaling the positions in the grid. In the case of the Mie simulations we account for dispersion of both water and polystyrene [40], [42]. Once the medium parameters are specified, an infinitely narrow collimated beam is directed into the scattering medium oriented orthogonally to the surface and initiated with a polarization state described by the Stokes vector. At each scattering event, the Stokes vector is updated according to [41]:
| (16) |
where So is the incident stokes vector [Io, Qo, Uo, Vo], R(ϕ) is a rotation matrix that rotates the reference frame into the scattering plane, M(θ) is the Mueller matrix for a single scattering event, R(γ) is a rotation matrix that rotates the reference frame back to the meridian plane, and Ss is the resulting scattered stokes vector [Is, Qs, Us, Vs]. The phase function, F(θ, ϕ) can be found by performing the matrix operation M(θ) R(ϕ)So and finding the resulting total intensity component:
| (17) |
where mij are elements of the Mueller matrix for a single scattering event. For the case of spherical particles, the Mueller matrix can be calculated according to Mie theory and takes the form [43]:
| (18) |
For the WM simulations, the Mueller matrix takes the form [44]:
| (19) |
After a multiply scattered ray exits the medium, the (x,y) position are tracked according to the position of the last scattering event within the medium in a two-dimensional grid whose dimensions are chosen prior to running the simulation [34]. Rays which exit outside of the grid are stored in the peripheral pixels and are used to properly normalize the data. Single scattering rays are stored in a separate array. To increase the efficiency of the simulations we track all rays which exit within 10 degrees around the exact backscattering angle since it was found that Ims(x, y) changes negligibly within this range [34].
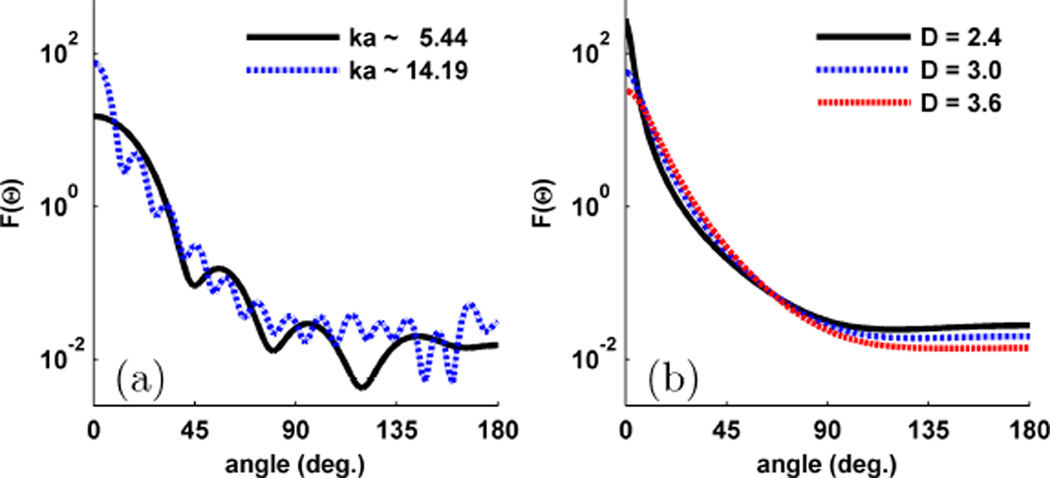
We conclude this section by observing the differences between the Mie and WM phase functions as shown in Fig. 2. Fig. 2a shows the Mie phase function for two spheres with different size parameter (ka) but the same g of 0.9. Both Mie phase functions exhibit oscillations in the scattering angle that are characteristic of scattering from spheres. However, while g is the same in each case, the sphere with larger ka has many higher order oscillations which are capable of altering Ims(x, y) [25], [34]. On the other hand, with the WM phase function shown in Fig. 2b we can independently control the width of the phase function by specifying g and the shape of the phase function by specifying D. Thus by modeling light scattering with the WM family of correlation functions we can both obtain a more physical understanding of the composition of biological tissue and a more flexible two-parameter phase function. The general trends of the WM phase function and Ims(x, y) can be found in detail in another publication [34].
Fig. 2.
Example of different Mie and WM phase functions for g = 0.9. (a) The Mie phase function for two different diameter spheres. (b) The WM phase function for different values of D.
III. Results
A. Reduction of Enhancement Factor
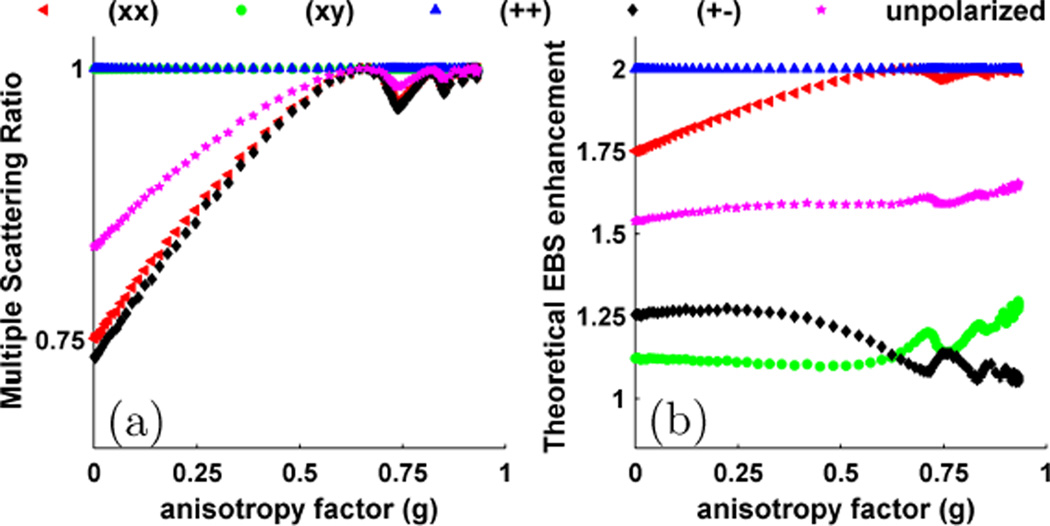
Using Monte Carlo simulations we first observe two properties which reduce the EBS enhancement factor (i.e. the relative height of the peak at x = y = 0) from its theoretical value of 2: single scattering and polarization. Fig. 3a shows the Monte Carlo simulation of the multiple scattering ratio for the different polarization channels as a function of g. For the helicity preserving (++) and linear cross polarized (xy) channels MSR is identically equal to 1 since these channels reject single scattered light. However, for other channels, MSR is dependent on the shape of the phase function. For Rayleigh scatterers (i.e. ka~1) with g = 0, MSR is 0.8357, 0.7514, and 0.7342 for the un-polarized, linear co polarized (xx), and opposite helicity (+−) channels, respectively. Performing a Beer’s law calculation of the single scattered intensity which reaches the medium surface, it can be found that for unpolarized light the MSR should equal 5/6, giving our result less than 0.3 % error. The lower MSR observed for the (xx) and (+−) channels results from a rotation of a portion of the multiply scattered light into the opposite channels. As g increases, the phase function becomes more forward directed and the MSR approaches 1 for all channels.
Fig. 3.
(a) Monte Carlo simulations to determine the multiple scattering ratio for backscattered light in different polarization channels as function of g. (b) Shows the theoretical EBS enhancement factor for different polarization channels as a function of g.
Fig. 3b shows the theoretical EBS enhancement for different polarization channels obtained using the calculations described by Lenke and Maret, and exhibits a qualitative match with their simulation results [22]. The reduction from the ideal value of 2 results from the combined effect of single scattered light and irreversible scattering rotations of intensity into the orthogonal polarization channels. For the (++) channel, single scattering is completely suppressed and each time-reversed pair is fully reversible according to the reciprocity theorem. As such, the theoretical enhancement factor in this channel is identically equal to 2 for all g. For the (xx) channel, the reduction in enhancement factor is due solely to single scattering and therefore follows the shape of the MSR shown in Fig. 3a. The strong reduction in the enhancement factor for the (xy) and (+−) channels occurs because only a small percentage of the initial polarized intensity is transferred into the orthogonal channels through a fully reversible path.
As a quantitative validation of our Monte Carlo results, we compare our values of the enhancement factor for Rayleigh scatterers with those calculated by Mishchenko using a separate numerical technique. Table I shows an excellent agreement between our results and those obtained by Mishchenko (rounded to four decimal points) [27].
TABLE I.
Enhancement factor for Rayleigh scatterers
| Polarization | Our Simulation | Mishchenko |
|---|---|---|
| (xx) | 1.7514 | 1.7521 |
| (++) | 2.0000 | 2 |
| (xy) | 1.1233 | 1.1202 |
| (+−) | 1.2549 | 1.2510 |
| Unpolarized | 1.5384 | 1.5368 |
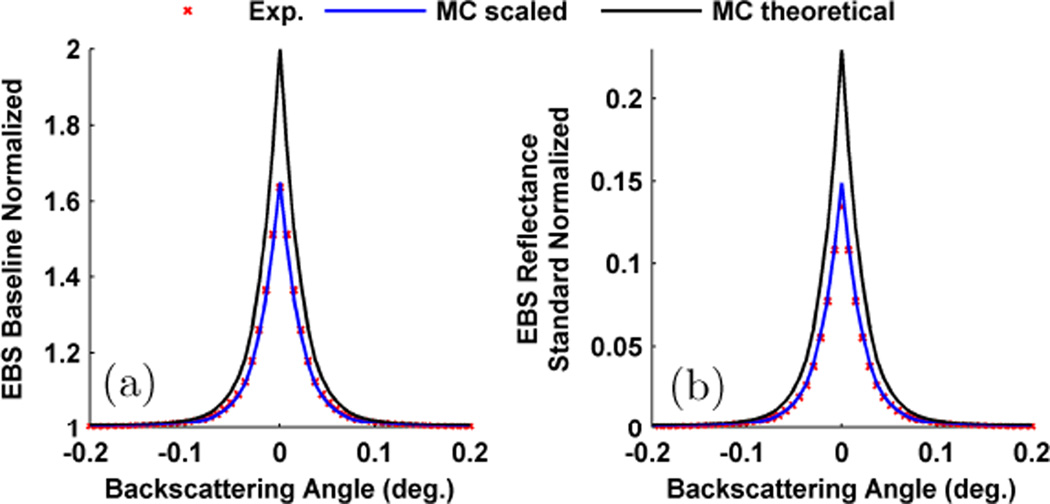
While the theoretical values for the enhancement factor in different polarization channels is well accepted, experimentally measured peaks rarely reach the expected value [5], [22], [45]; although excellent agreement has been reported [46]. In addition to the causes discussed above, other reasons such as finite beam spot size, finite sample thickness, imaging system resolution, and speckle noise have often been implicated in reducing the EBS peak from its theoretical value. However, even when all of these factors are considered our experiments fail to achieve the theoretical enhancement factor. As a demonstration, Fig. 4 shows the (++) channel measured from a suspension of 0.65 µm diameter microspheres in water with and g = 0.86 at 633 nm. In this experiment, the illumination spot size and sample thickness were maintained at > 30 times . In order to reject rays which exit outside of the illumination spot, an aperture with the same diameter as the illumination spot was placed directly over the sample. Fig. 4a shows the peak when the sample was normalized by its own baseline while Fig. 4b shows the peak when normalized by the unpolarized incoherent intensity as measured from the spectralon reflectance standard. Both of these plots show independent normalizations, and in each case the experimentally measured peak is lower than the theoretically predicted one. In order to achieve agreement, we must scale the theoretical peaks by a constant multiplicative value of 0.65 for each normalization. This type of one-parameter fit is commonly used in EBS [22], [45], [47], [48] and LEBS literature [16], [25], [34], [48]. Within the range of optical properties expected from tissue it has previously been observed that a single multiplicative value provides excellent agreement between experiment and Monte Carlo [25]. In addition, in this publication we observe that the same scaling factor (used to achieve the best agreement with theory) is the same for each polarization channel and as such all channels are directly comparable and combinable. The origin of this scaling factor is still not well understood but is actively being pursued.
Fig. 4.
Rotational average of the (++) EBS peak for a microsphere phantom with and g = 0.87 measured at 633 nm. (a) Peak obtained when normalized by the samples own diffuse baseline. (b) Peak obtained when normalized by the unpolarized incoherent intensity. In each case the theoretical peak must be scaled by 0.65 to obtain a match with experiment.
B. Azimuthal Dependencies
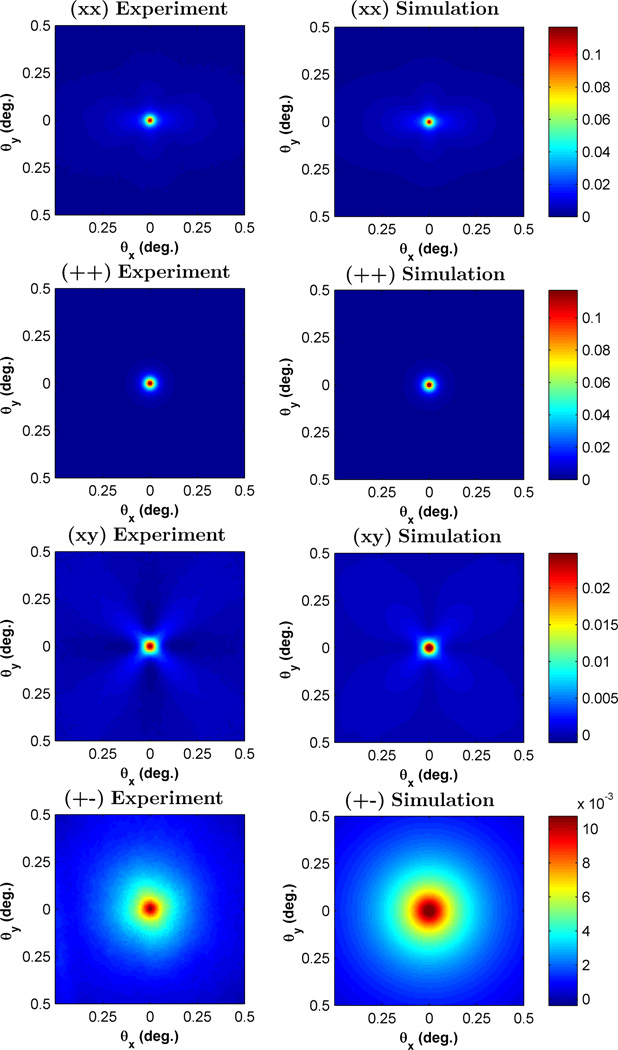
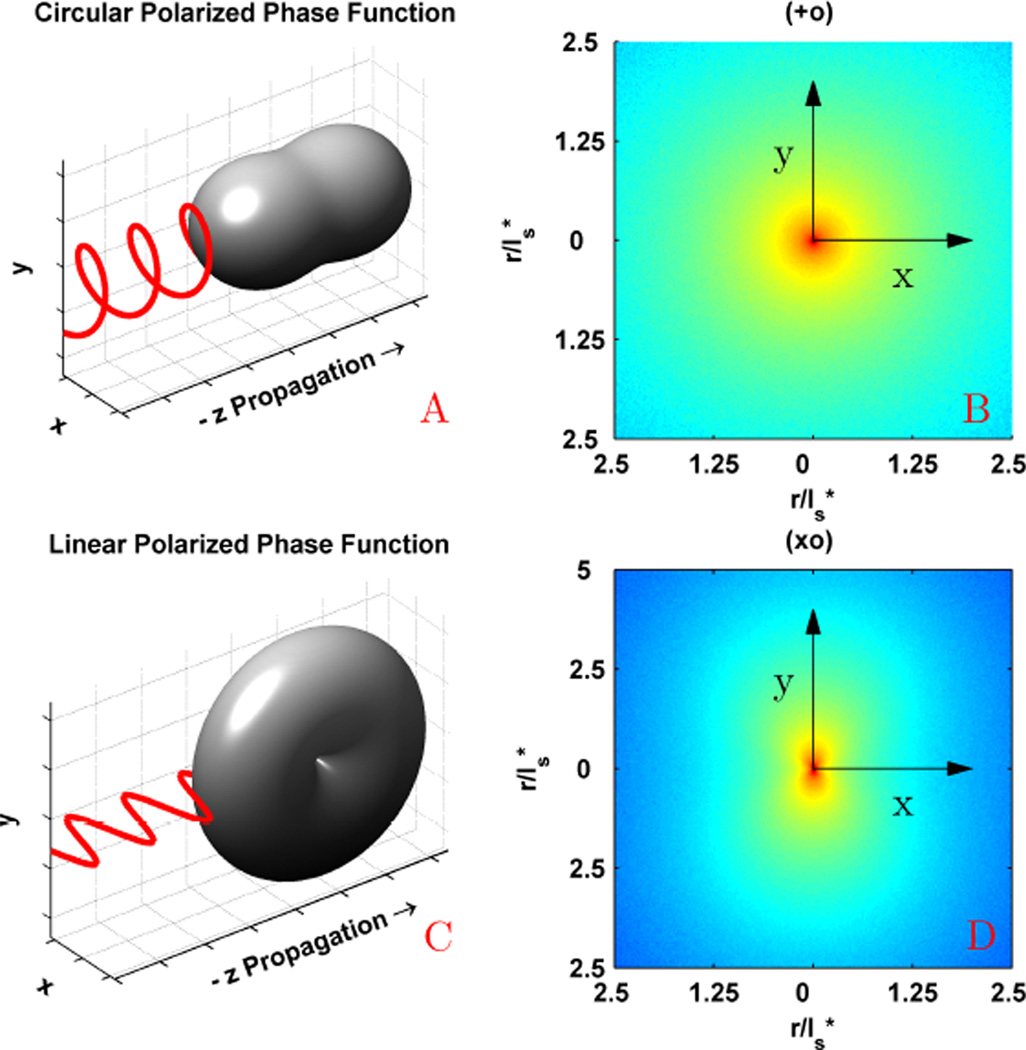
In order to understand the effect of polarization on the azimuthal shape of the EBS peak, we studied the suspension of latex microspheres described above. Fig. 5 displays the comparison between the experimentally measured and Monte Carlo simulated 2D angular EBS intensity peak for the (xx), (++), (xy), and (+−) polarization channels. For the (++) and (+−) channels the peak is azimuthally symmetric while for the (xx) and (xy) channels the peak is azimuthally asymmetric. These observations can be understood by considering the general shape of the phase function for polarized illumination. In Fig. 6 we show the dipole phase function for linear and circular polarized illumination along with the corresponding Monte Carlo simulated Ims(x, y) with unpolarized collection. Under circularly polarized illumination (Fig.6a), the phase function is rotationally symmetric about the azimuthal angle. As a result, the (+o) channel representing circular illumination with unpolarized collection (Fig. 6b) is also be rotationally symmetric. On the other hand, under linear polarized illumination (Fig. 6c), the phase function has a reduced probability in the direction of the polarization vector due to the dipole radiation pattern or dipole factor and less intensity will be scattered in the direction of the polarization vector. As a result, in the (xo) channel representing linear illumination with unpolarized collection (Fig. 6d) Ims(x, y) has increased intensity in a direction that is orthogonal to the incident polarization direction. After Fourier transform, this results in an EBS peak which is elongated in a direction that is parallel to the polarization direction (Fig. 9b,d). The (++) and (+−) channels achieved by decomposing the (+o) channel are also azimuthally symmetric since there is nothing to break the symmetry. However, decomposing the (xo) channel into the (xx) and (xy) channels results in more complicated dependencies. Since light is transferred into the cross polarized channel most efficiently at 45° with respect to the x and y axes, the (xy) component exhibits a ’four leaf clover’ or ’X’ pattern [22], [24]. The remainder of rays which are not depolarized into the cross channel will then form the (xx) component. As a result, the (xx) peak is in general elongated in the direction of the polarization, but also shows decreased intensity in the diagonal directions due to depolarization.
Fig. 5.
Comparison of the experimental EBS intensity peak with Monte Carlo simulation for the (xx), (++), (xy) and (+−) polarization channels. The sample was a suspension of latex microspheres with g = 0.87 and ls* = 205 µm at 633 nm illumination. The first column shows the experimental peaks while the second column shows the Monte Carlo simulated peaks. Simulation scaled by 0.65 to obtain a match with experiment.
Fig. 6.
Correspondence between the scattering phase function (a,c) and the Monte Carlo Ims(x, y) (b,d) for a medium composed of rayleigh scatterers. (a) Phase function for light with circular polarization in the x-y plane and (b) the resulting Ims(x,y) for the (+o) channel. (c) Phase function for light with linear along the x-axis and (d) the resulting Ims(x,y) for the (xo) channel. For each phase function rendering, the scattering particle is location at the origin.
Fig. 9.
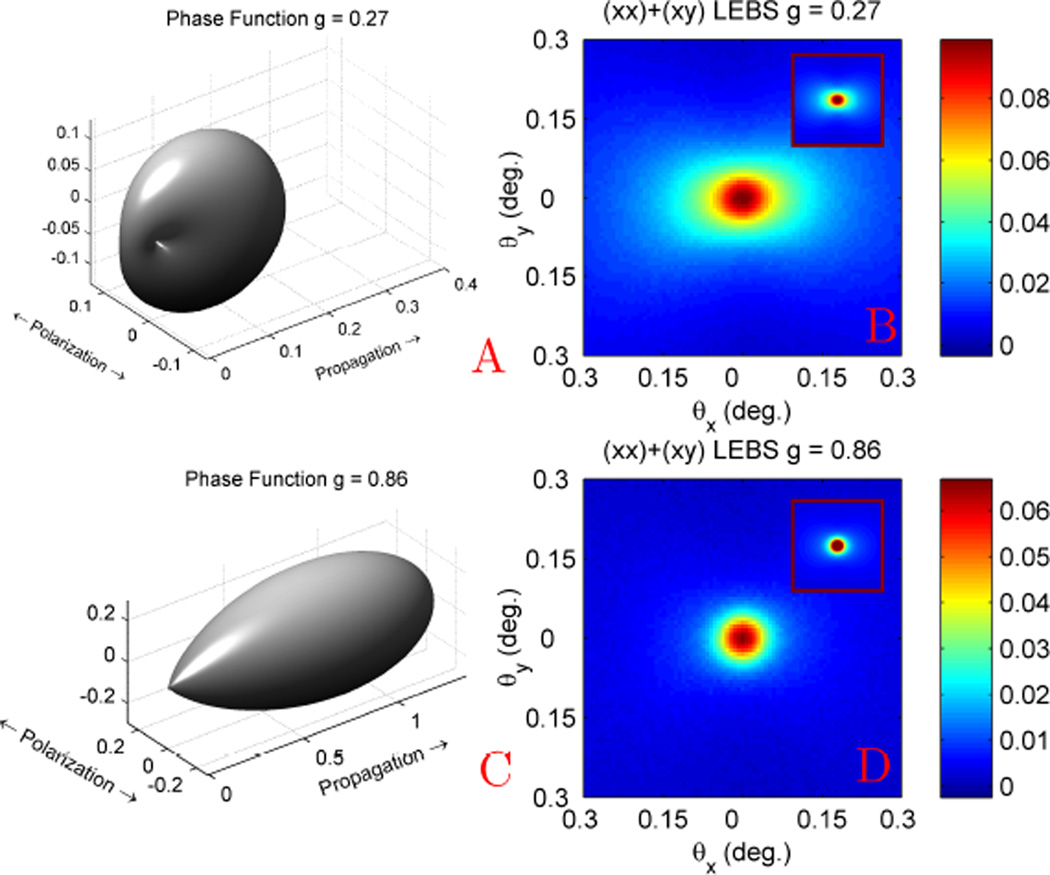
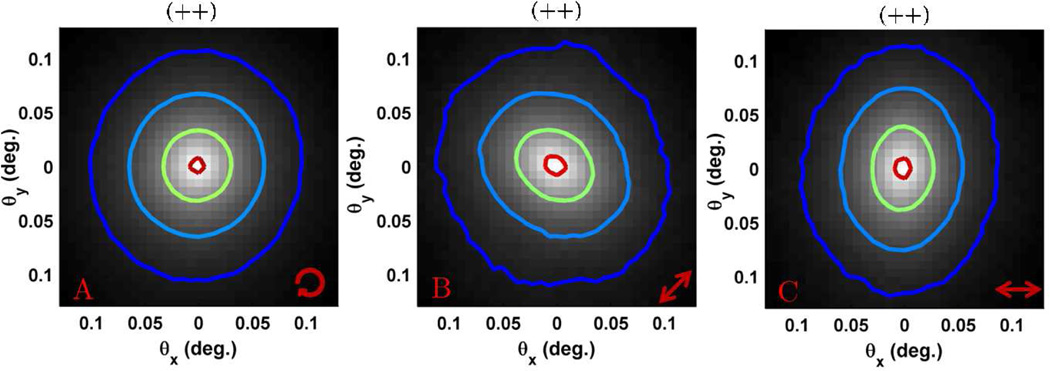
Illustration of the sensitivity of (L)EBS to the shape of the phase function. (a) Linear polarized phase function with g = 0.27 for microspheres with 0.20 µm diameter at 680 nm and (b) LEBS measurement (Lsc = 173 µm). (c) Linear polarized phase function with g = 0.86 for microspheres with 0.65 µm diameter at 680 nm and corresponding LEBS measurement (d). The insets in b and d depict scaled Monte Carlo simulations. Simulation scaled by 0.65 to obtain a match with experiment.
As a final remark about the effects of polarization on the azimuthal EBS shape, it should be noted that in the absence of optical activity or preferred scattering direction due to sample structural orientation, the backscattering Mueller matrix is symmetric [49]. As a result, if we reverse the illumination and collection polarizers in our EBS instrument, the resulting peak must be the same. This means for example, that the (xo) channel gives the same result as the (ox) channel representing unpolarized illumination with linear polarized collection.
C. Partial Spatial Coherence Illumination - LEBS
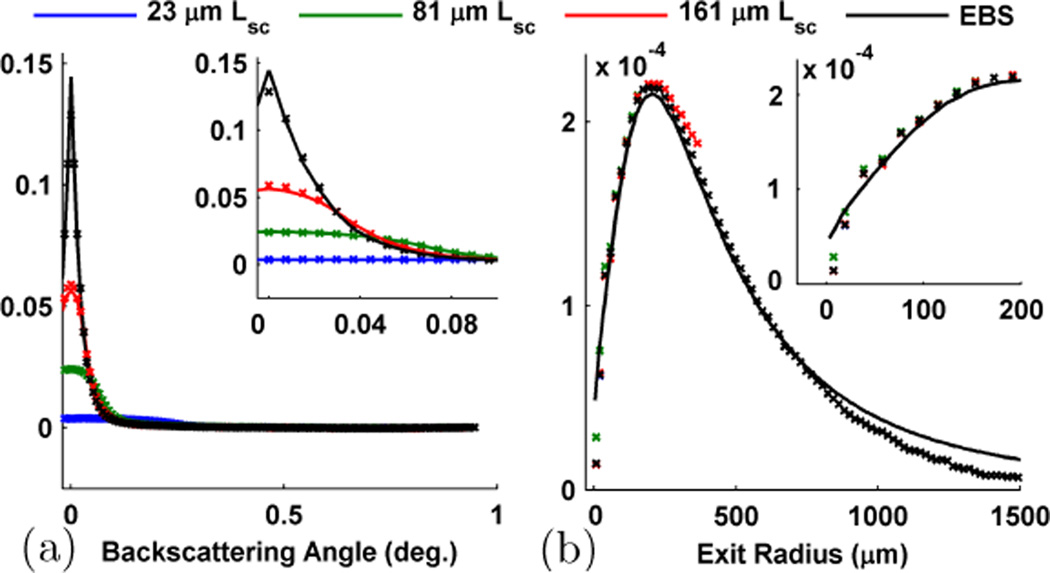
As discussed in theoretical overview section, the effect of partial spatial coherence illumination (used in LEBS) can be understood as a filtering operation in the spatial domain. With decreasing Lsc, the radial extent of the c(r) filter is also decreased resulting in the attenuation of higher frequency information. Because of this, the very sharp EBS peak becomes shorter and more rounded as Lsc decreases. The alteration of the peak shape for different Lsc can be seen in Fig. 7a which shows the rotational average of the (++) channel. Likewise, thinking in a more physical fashion the c(r) filter preserves the optical signal originating from short transport paths while rejecting the signal from very long transport paths. Thus by altering Lsc, LEBS provides a method to selectively isolate the optical signal originating from the length-scales in which we are interested in. It is important to note that within the spatial coherence area, p(r) can still be accurately obtained as shown in Fig. 7b [16]. One way to demonstrate the ability of LEBS to extract the features of p(r) at different exit radii is through the observation of the enhancement factor. According to the Fourier relationship between p(r) and LEBS, the enhancement factor is simply and so provides a measurement of the total coherent intensity which falls within c(r). For a particular illumination geometry the shape of c(r) is fixed, and any changes in the enhancement factor must be attributed to the shape and height of p(r).
Fig. 7.
Demonstration of the effect of partial spatial coherence illumination on the EBS peak (i.e. LEBS). (a) Rotational average of the (++) EBS peak for a sample illuminated with different Lsc. (b) p(r) as measured from different Lsc. In each case the solid lines represent Monte Carlo simulations and the symbols represent the experiment. The insets are magnified views showing the distributions at small values of angle and radius. Simulation scaled by 0.65 to obtain a match with experiment.
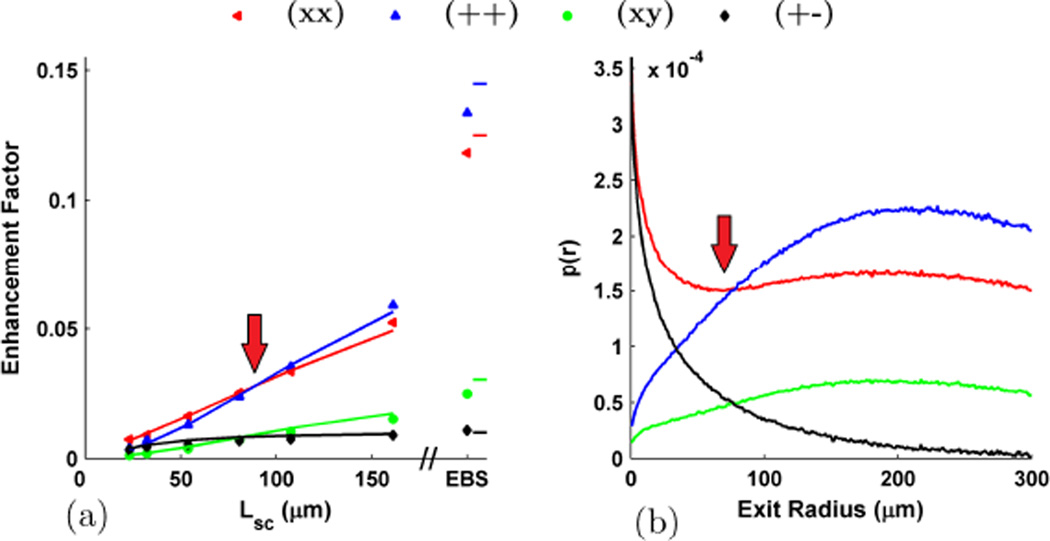
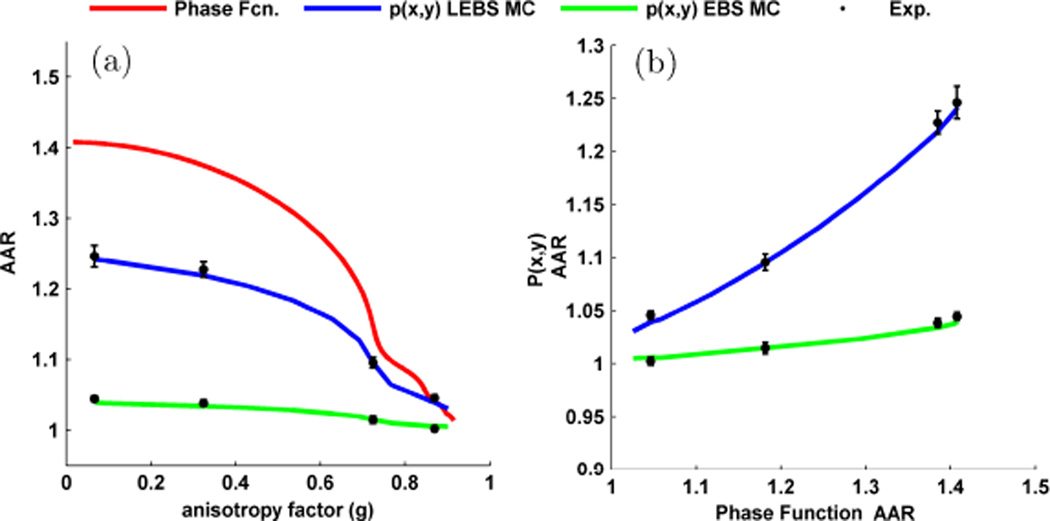
Fig. 8a shows the experimental LEBS enhancement factor obtained with different Lsc using the microsphere suspension described in Fig. 4. As expected, with increasing Lsc a larger proportion of the p(r) falls within c(r) and therefore the enhancement factor monotonically increases. The fact that the enhancement factor scales with Lsc for all polarization channels confirms that the observed angular intensity distributions in each of these channels are indeed accurately interpreted as resulting from a coherent interference phenomenon. One interesting aspect of the trends in Fig. 8a is the crossover that occurs between the (xx) and (++) channels at ~ 95 µm Lsc as well as the one that occurs between the (xy) and (+−) channels at ~ 80 µm Lsc. This result is explained by observing the Monte Carlo simulated p(r)s shown in Fig. 8b and noting the similar crossovers which occurs at ~ 80 µm exit radius. The crossover in enhancement identifies the location in which the total coherent intensity in the different polarization channels is identical. One of the important benefits of using LEBS is that it provides the ability to focus on the low-order scattering events in which information about the shape of the phase function is preserved [25], [34]. Consider the LEBS peaks shown in Fig. 9 which shows the (xo) channel obtained by summing the (xx) and (xy) components. As discussed above, the peak exhibits an elongation in the direction of the polarization as a result of the dipole factor in the phase function. When g is low (Fig. 9a) the dipole factor is very prominent and there is a high degree of anisotropy in the observed LEBS peak (Fig. 9b). With increasing g, the phase function becomes more forward directed and the contribution of the dipole factor is reduced (Fig. 9c). As a result, the LEBS peak mimics the phase function and becomes more rotationally symmetric (Fig. 9d). In order to quantify this anisotropy we measure the intensity dispersed in a direction orthogonal to the polarization as a ratio to the intensity dispersed in a direction parallel to the polarization, which we denote as the azimuthal anisotropy ratio (AAR). In Fig. 10a, the AAR for the phase function (red) is calculated according to Mie theory, the AAR for LEBS (blue) is calculated by converting the LEBS peak for Lsc = 161 µm to p(x, y), and the AAR for EBS (green) by converting to the full length p(x, y). In each case, the AAR monotonically decreases with g, approaching a value of 1 for g = 1. Experimental measurements of suspensions with g = 0.07, 0.32, 0.72, and 0.87 show excellent agreement with Monte Carlo for both the EBS and LEBS case. However, using LEBS we can better focus on the low order scattering events and obtain greater sensitivity to g (Fig. 10b).
Fig. 8.
(a) Enhancement factor for the different polarization channels when the microsphere suspension is illuminated with light of different Lsc. Solid lines represent Monte Carlo simulations and the symbols represent the experiment (this includes the EBS values on the right). (b) the corresponding p(r) for each polarization channel in a. Arrows indicate the location of the crossovers discussed in the text. Simulation scaled by 0.65 to obtain a match with experiment.
Fig. 10.
Comparison between the AAR for the phase function and p(x, y).(a) AAR for the phase function, p(x, y) measured from LEBS (Lsc = 173µm), and p(x, y) measured from EBS as a function of g. (b) Plot of AAR for EBS and LEBS vs. AAR for the phase function shows a monotonic relationship. LEBS exhibits an increased sensitivity to the shape of the phase function.
D. Measurement of optical properties in biological tissue
In this section we demonstrate experimental measurements of biological tissue using broadband EBS. As a first example we show measurements taken from the medullary cavity of a chicken thigh bone using the (++) polarization channel in Fig. 11. As discussed in the previous sections the (++) channel is expected to be azimuthally symmetric. However, the high level of structural orientation in thigh bone leads to a preferred direction of scattering (anisotropic scattering) [51]. This fact needs to be considered when using EBS to quantify highly oriented biological structures such as bone, muscle, skin, or artery [51]. Fig. 11a shows the azimuthally symmetric EBS peak obtained by rotating the sample during measurement. Fig. 11b,c shows the anisotropic peak measured for a stationary bone oriented in two different directions. For these measurements, light is preferentially scattered in a spatial direction that is parallel to bone axis. After Fourier transformation the EBS peak is elongated orthogonal to this direction.
Fig. 11.
EBS measurements from the medullary cavity of a chicken thigh bone using (++) polarization. The arrow in the lower right hand side indicates the orientation of the major bone axis. (a) rotating sample (b) bone oriented in the +45° direction (c) bone oriented in the horizontal direction
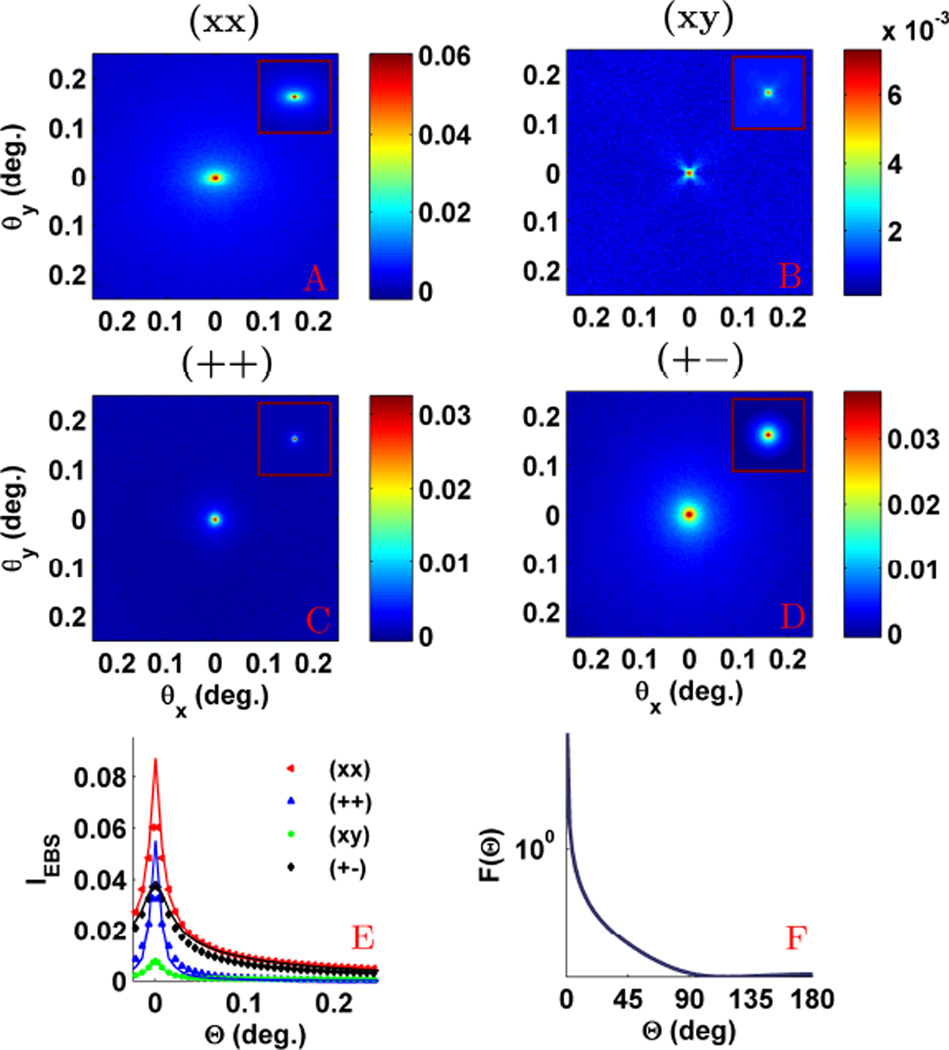
Next we provide an estimate for g, ls, D, and total Hemoglobin (Hb) concentration measured from a fresh chicken liver specimen. The corresponding EBS measurements for each polarization channel are shown in Fig. 12a–e. These measurements use 700 nm illumination so that the attenuation of longer path-lengths is not greatly altered by Hb absorption. The two dimensional peaks for each polarization channel exhibit the characteristic azimuthal dependencies discussed above and show no apparent alterations in shape from local anisotropies in tissue structure. This occurs because even though the local p(x, y) for a particular location on the tissue surface may be preferentially skewed in a certain direction due to tissue structure, these random distributions are completely averaged over the 6 mm spot size.
Fig. 12.
Experimental EBS measurement from a chicken liver sample at 700 nm illumination. (a–d) shows the EBS peaks in the (xx), (xy), (++), and (+−) polarization channels, respectively. (e) Rotational averages of each polarization channel with symbols representing experiment. The WM fit is shown in solid lines for the (xx) and (++) channels. (f) WM phase function for g = 0.95 and D = 2.2. Simulation scaled by 0.65 to obtain a match with experiment.
To determine the optical scattering properties we perform a bounded minimization (tissue relevant regime: g = 0.7–0.98, ls = 5–1000 µm, D = 2–4) which minimizes the sum of squared error between the experimentally measured (xx) EBS peak and a database of WM simulations. The resulting fit gives g = 0.95, ls = 52.5 µm, and D = 2.2. The values of g and ls fall within the range obtained from liver tissue in other publications [50] and the value of D indicates that liver tissue exhibits mass fractal geometry. The corresponding WM simulated EBS peaks are displayed in the insets of Fig. 12a–d. Fig. 12f shows the WM phase function corresponding to our chicken liver sample with D = 2.2 and g = 0.95.
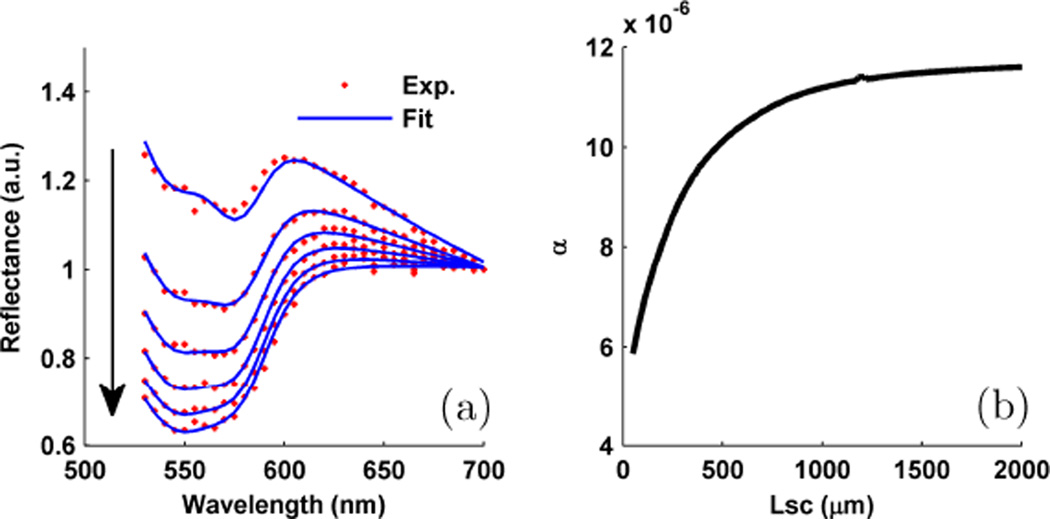
The quantification of optical absorption is obtained through spectroscopic (530–700 nm) analysis of LEBS enhancement factor. Using the post-processing algorithm discussed in detail in another publication [16] we observe the enhancement spectrum for different Lsc in Fig. 13a. In each spectrum, the intensity dips due to Hb absorption are clearly visible. With increasing Lsc (as indicated by the arrow) the path-length through which the light rays travel also increases. As a result, a larger absorption dip is visible for larger Lsc. Using a Beer’s law algorithm [16], we quantify the amount of total Hb (THb, i.e. oxy + deoxy) absorption using a variable, α (mol/L*cm), which represents the product of Hb concentration and average ray path-length. The excellent algorithm fit is represented by the blue curves in Fig. 13a. The resulting value is seen to increase with increasing Lsc as shown in in Fig. 13b. In order to convert the LEBS α parameter to total hemoglobin concentration we divide by the average path-length obtained through WM Monte Carlo simulations and convert to units of g/L. Because our tissue sample is fairly homogenous we found that hemoglobin concentration is nearly flat across all Lsc. Using the spectrum from the EBS regime (i.e. Lsc → ∞), we obtain a hemoglobin concentration of 1.85 g/L.
Fig. 13.
Spectroscopic LEBS analysis to quantify optical absorption. (a) LEBS enhancement spectrum recorded from chicken liver along with the theoretical Hb absorption fit. The arrow indicates the spectrum measured with increasing Lsc. (b) Total Hb α parameter for increasing Lsc.
E. Measurement of p (r) in field carcinogenesis
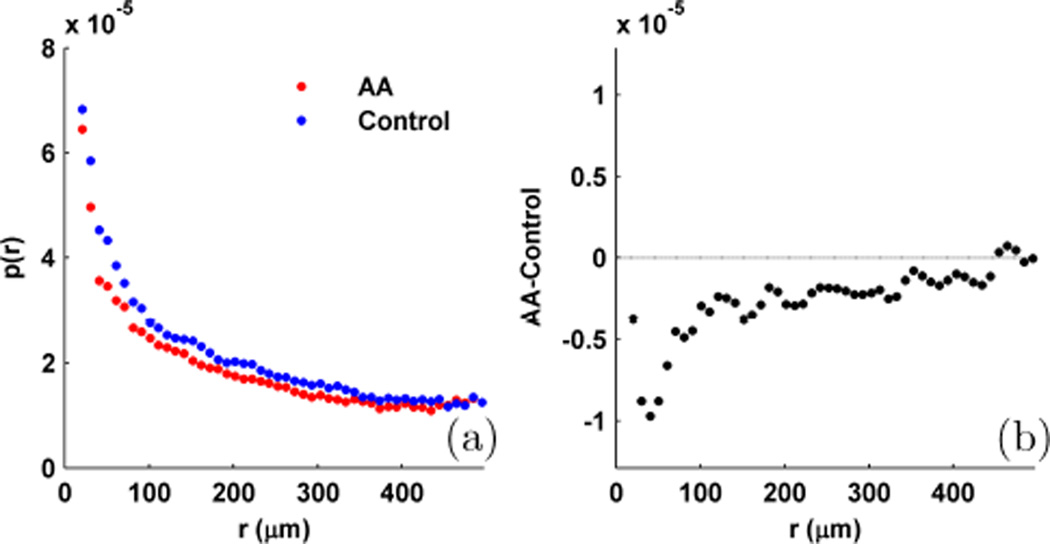
While liver is a fairly homogeneous tissue and can be well-modeled as a single effective medium, in more layered tissue structures it is useful to convert the experimental EBS peaks to p(r) through inverse Fourier transform to gain better insight into how the tissue is structured. Since rays exiting at larger radial separations on average tend to travel deeper within the sample, we can infer information about the depth-profile of the optical signal by observing p(r) at different exit radii. In Fig. 14 we use this capability to demonstrate the sensitivity of EBS to the subtle (i.e. histologically undetectable) alterations in the structure of colonic mucosa that occur as a result of field carcinogenesis (the concept that alterations which lead to neoplastic growth in one section of an organ are also detectable in the rest of that organ). For this study, a minimum of 5 LEBS measurements (Lsc = 166 µm at 650 nm with (xx) polarization) were acquired from the epithelial side of histologically normal-appearing human rectal biopsies collected in accordance with the institutional review board at NorthShore University HealthSystems. The thickness of each biopsy was maintained at 1 mm using a glass coverslip placed over a 1 mm spacer. Fig. 14a shows the comparison between the average p(r) measured from 11 patients harboring an advanced adenoma (AA, size 10 mm diameter) and 39 control patients with no apparent dysplasia. Qualitatively, the two distributions look very similar since the optical properties and structure is similar between the two samples. However, in accordance with previous findings p(r) is lower for the AA group, suggesting that may be reduced as the patient progresses towards a more cancerous state [18], [25].
Fig. 14.
Measurement of p(r) from rectal biopsies using LEBS with Lsc = 166 µm at 650 nm with (xx) polarization. (a) average p(r) measured from rectal biopsy. Compares 11 advanced adenomas (AA) vs. 39 control patients. (b) Difference (AA-control) between p(r)’s shown in panel a.
To determine the location of the maximal difference in p(r) we subtract the two distributions (AA-control) as displayed in Fig. 14b. The largest difference in shape occurs at an exit radius of 40 µm indicating that the observed changes are caused by low-order scattering events that interrogate the most superficial layers of colonic mucosa.
IV. Discussion and conclusion
The ultimate goal of optical characterization of layered media such as biological tissue is to solve the so-called inverse problem in which depth-resolved measurements of the full shape of the differential scattering cross section is combined with information about the concentrations of different chromophores. While this is a difficult goal to achieve, having more ways in which to view the problem provides more opportunities to fully characterize the sample properties. In this paper we have presented the unique ability of EBS to provide polarimetric, spectroscopic, and depth-resolved characterization of biological tissue using an easy to implement backscattering instrument. We have shown an extraordinary sensitivity to the shape of the scattering phase function, with capability to distinguish higher order parameters than the anisotropy factor.
LEBS has shown great promise for the early detection of colorectal and pancreatic cancer by sensing alterations in tissue structure caused by field carcinogenesis which are not otherwise detectable using conventional methods. This is hypothesized to occur because LEBS selectively interrogates p(x, y) at subdiffusion length-scales in which information about the superficial layers of tissue as well as the phase function are not obscured by higher order scattering. In this publication, we further corroborate this hypothesis with the demonstration that in colon cancer p(r) is maximally altered at a very small length-scale (~ 40 µm) which would be difficult to sense using a typical diffuse backscattering probe.
Still, there are situations in which it is more opportune to use EBS as opposed to LEBS, and vice versa. As a research aid in which one specialized instrument is desired for a wide range of applications, EBS is the better choice. This is because 1) the laser source provides more efficient coupling of light onto the sample and therefore better SNR and 2) EBS enables full measurement of p(x, y), with no loss of information at small length-scales [16]. On the other hand, since EBS requires a broadband laser source and an extremely sensitive CCD detector it would be prohibitively expensive and complicated to implement as a population-wide cancer screening modality. Therefore, as a diagnostic medical device which is specifically optimized to detect the changes that occur in early cancer carcinogenesis, LEBS is the better choice.
Currently, our WM Monte Carlo simulations are only valid for modeling homogeneous media with random RI fluctuations. Future progress in the use of EBS for tissue characterization will be focused on developing numerical models of layered media to better understand the potential to resolve each optical property as a function of depth.
Acknowledgment
The authors would like to thank İlker R. Çapoğlu, Allen Taflove, and Prabhakar Pradhan for helpful theoretical discussions.
This study was supported by National Institute of Health grant numbers RO1CA128641 and RO1EB003682. A.J. Radosevich is supported by a National Science Foundation Graduate Research Fellowship under Grant No. DGE-0824162.
Biographies

Andrew J Radosevich received the B.S. degree in biomedical engineering from Columbia University, New York City, NY in 2009. He is currently pursuing a Ph.D. degree in biomedical engineering from Northwestern University, Evanston, IL.
His current research interests include the numerical modeling and experimental observation of enhanced backscattering spectroscopy for use in the early diagnosis and treatment of colon and pancreatic cancers.
Mr. Radosevich is the recipient of a three year National Science Foundation graduate research fellowship awarded in 2011.

Jeremy D. Rogers Jeremy D. Rogers received the B.S. degree in physics from Michigan Technological University, Houghton, in 1999, and the M.S. and Ph.D. degrees in optical sciences from the College of Optical Sciences, University of Arizona, Tucson, in 2003 and 2006, respectively. He is currently a Postdoctoral Fellow in biomedical engineering at Northwestern University, Evanston. His research interests include theoretical and numerical modeling of light scattering as well as lens design and development of instrumentation for basic research and application to optical metrology.

Vladimir Turzhitsky received the B.S. in biomedical engineering from Rensselaer Polytechnic Institute, Troy, NY in 2004, and his M.S. and Ph.D. in biomedical engineering from Northwestern University, Evanston IL in 2006 and 2009, respectively. He then continued at Northwestern University as a Postdoctoral fellow. Currently, he is a Postdoctoral Fellow at Harvard University and at the Biomedical Imaging and Spectroscopy Laboratory at Beth Israel Deaconess Medical Center, Boston MA. His interests include the development of light scattering and imaging techniques in the fields of biology and medicine.

Nikhil N. Mutyal received the B.Sc. and M.Sc. degrees in chemistry from the Indian Institute of Technology Kanpur, Kanpur, India. He is currently working toward the Ph.D. degree in biomedial engineering at Northwestern University, Evanston, IL.
His current research interests include finding new markers and therapeutics for the diagnosis and treatment of cancer, studying the biological origins of changes in optical properties in the progression of cancer, and developing instrumentation (fiber-optic probes) to detect these changes using low-coherence enhanced backscattering spectroscopy.

Ji Yi received the B.S. and M.S. degree in biomedical engineering from Tsinghua University, Beijing, P.R. China in 2005 and Northwestern University, Evanston, IL in 2009 respectively. He is currently working towards Ph.D. degree in biomedical engineering at Northwestern University.
His current research interests include using spectroscopic optical coherence tomography to quantify tissue optical properties and other spectra-related optical imaging techniques. He is also interested in optical biosensing for tumorous cell detection and optical instrumentation.

Hemant K. Roy received the B.S. degree (summa cum laude) in molecular biology from Vanderbilt University, Nashville, TN, in 1985, and the M.D. degree with distinction from Northwestern University, Evanston, IL, in 1989.
He completed his internal medicine training at Beth Israel Hospital/Harvard Medical School, Cambridge, MA, in 1992, and gastroenterology training at the University of Chicago, Chicago, IL, from 1992 to 1995. His current research interests include colon cancer prevention. He is engaged in the investigation of noncyclooxygenase mechanisms for apoptosis from nonsteroidal antiinflammatory agents and has been one of the pioneers the use of polyethylene glycol in chemoprevention. His translational group works on development of novel colorectal cancer screening strategies. He is currently a Clinical Associate Professor of medicine at the University of Chicago, Pritzker School of Medicine, Chicago, IL. He is also at NorthShore University HealthSystems, Evanston, IL, where he is the Director of Research and the Vice Chair of the section of Gastroenterology and the Duckworth Chair of Cancer Research.

Vadim Backman received the Ph.D. degree in medical engineering fromHarvard University, Cambridge, MA, and Massachusetts Institute of Technology, Cambridge, in 2001.
He is currently a Professor of biomedical engineering at Northwestern University, Evanston, IL, a Program Leader in cancer bioengineering, nanotechnology and chemistry at the Robert H. Lurie Comprehensive Cancer Institute, Chicago, IL, and a member of the Professional Staff in the Division of Gastroenterology, NorthShore University Health-Systems, Evanston. He is engaged in translational research, which is focused on bridging these technological and biological innovations into clinical practice. His current research interests include biomedical optics, spectroscopy, microscopy, development of analytical approaches to describe light transport in biological media, and optical microscopy for nanoscale cell analysis.
Dr. Backman is the recipient of numerous awards, including being selected as one of the top 100 young innovators in the world by the Technology Review Magazine and the National Science Foundation CAREER Award.
Contributor Information
Andrew J. Radosevich, Department of Biomedical Engineering, Northwestern University, Evanston, IL 60208 USA.
Jeremy D. Rogers, Department of Biomedical Engineering, Northwestern University, Evanston, IL 60208 USA.
Vladimir Turzhitsky, Department of Biomedical Engineering, Northwestern University, Evanston, IL 60208 USA.
Nikhil N. Mutyal, Department of Biomedical Engineering, Northwestern University, Evanston, IL 60208 USA.
Ji Yi, Department of Biomedical Engineering, Northwestern University, Evanston, IL 60208 USA.
Hemant K. Roy, Department of Internal Medicine, NorthShore University HealthSystems, Evanston, IL 60201 USA, and also with the Pritzker School of Medicine, University of Chicago, Chicago, IL 60637 USA.
Vadim Backman, Department of Biomedical Engineering, Northwestern University, Evanston, IL 60208 USA, and also with the Robert H. Lurie Comprehensive Cancer Institute, Chicago, IL 60611 USA. He is also with the Division of Gastroenterology, NorthShore University HealthSystems, Evanston, IL 60201 USA.
References
- 1.Kuga Y, Ishimaru A. Retroreflectance from a Dense Distribution of Spherical-Particles. J Opt Soc Am A. 1984;vol. 1:831–835. [Google Scholar]
- 2.Tsang L, Ishimaru A. Backscattering Enhancement of Random Discrete Scatterers. J Opt Soc Am A. 1984;vol. 1:836–839. [Google Scholar]
- 3.Wolf PE, Maret G. Weak Localization and Coherent Backscattering of Photons in Disordered Media. Phys Rev Lett. 1985;vol. 55:2696–2699. doi: 10.1103/PhysRevLett.55.2696. [DOI] [PubMed] [Google Scholar]
- 4.Van albada MP, Lagendijk A. Observation of Weak Localization of Light in a Random Medium. Phys Rev Lett. 1985;vol. 55:2692–2695. doi: 10.1103/PhysRevLett.55.2692. [DOI] [PubMed] [Google Scholar]
- 5.Akkermans E, Wolf PE, Maynard R. Coherent Backscattering of Light by Disordered Media - Analysis of the Peak Line-Shape. Phys Rev Lett. 1986 Apr 7;vol. 56:1471–1474. doi: 10.1103/PhysRevLett.56.1471. [DOI] [PubMed] [Google Scholar]
- 6.Ishii K, Iwai T, Asakura T. Polarization properties of the enhanced backscattering of light from the fractal aggregate of particles. Opt Rev. 1997 Nov-Dec;vol. 4:643–647. [Google Scholar]
- 7.Mcgurn AR, Christensen KT, Mueller FM, Maradudin AA. Anderson Localization in One-Dimensional Randomly Disordered Optical-Systems That Are Periodic on Average. Phys Rev B. 1993 May 15;vol. 47:13120–13125. doi: 10.1103/physrevb.47.13120. [DOI] [PubMed] [Google Scholar]
- 8.Wiersma DS, van Albada MP, Lagendijk A. Coherent Backscattering of Light from Amplifying Random-Media. Phys Rev Lett. 1995 Aug 28;vol. 75:1739–1742. doi: 10.1103/PhysRevLett.75.1739. [DOI] [PubMed] [Google Scholar]
- 9.Labeyrie G, de Tomasi F, Bernard JC, Muller CA, Miniatura C, Kaiser R. Coherent backscattering of light by cold atoms. Phys Rev Lett. 1999 Dec 20;vol. 83:5266–5269. [Google Scholar]
- 10.Vithana HKM, Asfaw L, Johnson DL. Coherent Backscattering of Light in a Nematic Liquid-Crystal. Phys Rev Lett. 1993 Jun 7;vol. 70:3561–3564. doi: 10.1103/PhysRevLett.70.3561. [DOI] [PubMed] [Google Scholar]
- 11.Yoo KM, Tang GC, Alfano RR. Coherent Backscattering of Light from Biological Tissues. Appl Opt. 1990 Aug 1;vol. 29:3237–3239. doi: 10.1364/AO.29.003237. [DOI] [PubMed] [Google Scholar]
- 12.Eddowes MH, Mills TN, Delpy DT. Monte-Carlo Simulations of Coherent Backscatter for Identification of the Optical Coefficients of Biological Tissues in-Vivo. Appl Opt. 1995 May 1;vol. 34:2261–2267. doi: 10.1364/AO.34.002261. [DOI] [PubMed] [Google Scholar]
- 13.Yoon G, Roy DNG, Straight RC. Coherent Backscattering in Biological Media - Measurement and Estimation of Optical-Properties. Appl Opt. 1993 Feb 1;vol. 32:580–585. doi: 10.1364/AO.32.000580. [DOI] [PubMed] [Google Scholar]
- 14.Yoo KM, Liu F, Alfano RR. Biological-Materials Probed by the Temporal and Angular Profiles of the Backscattered Ultrafast Laser-Pulses. J Opt Soc Am B. 1990 Aug;vol. 7:1685–1693. [Google Scholar]
- 15.Kim YL, Liu Y, Turzhitsky VM, Roy HK, Wali RK, Backman V. Coherent backscattering spectroscopy. Opt Lett. 2004 Aug 15;vol. 29:1906–1908. doi: 10.1364/ol.29.001906. [DOI] [PubMed] [Google Scholar]
- 16.Radosevich AJ, Turzhitsky VM, Mutyal NN, Rogers JD, Stoyneva V, Tiwari AK, De La Cruz M, Kunte DP, Wali RK, Roy HK, Backman V. Depth-resolved measurement of mucosal microvascular blood content using low-coherence enhanced backscattering spectroscopy. Biomed Opt Express. 2010;vol. 1:1196–1208. doi: 10.1364/BOE.1.001196. [DOI] [PMC free article] [PubMed] [Google Scholar]
- 17.Born M, Wolf E, Bhatia AB. Principles of optics : electromagnetic theory of propagation, interference and diffraction of light. 7th (expanded) ed. Cambridge [England] ; New York: Cambridge University Press; 1999. [Google Scholar]
- 18.Roy HK, Turzhitsky V, Kim Y, Goldberg MJ, Watson P, Rogers JD, Gomes AJ, Kromine A, Brand RE, Jameel M, Bogovejic A, Pradhan P, Backman V. Association between Rectal Optical Signatures and Colonic Neoplasia: Potential Applications for Screening. Cancer Res. 2009 May 15;vol. 69:4476–4483. doi: 10.1158/0008-5472.CAN-08-4780. [DOI] [PMC free article] [PubMed] [Google Scholar]
- 19.Liu Y, Brand RE, Turzhitsky V, Kim YL, Roy HK, Hasabou N, Sturgis C, Shah D, Hall C, Backman V. Optical markers in duodenal mucosa predict the presence of pancreatic cancer. Clin Cancer Res. 2007 Aug 1;vol. 13:4392–4399. doi: 10.1158/1078-0432.CCR-06-1648. [DOI] [PubMed] [Google Scholar]
- 20.Turzhitsky V, Liu Y, Hasabou N, Goldberg M, Roy HK, Backman V, Brand R. Investigating population risk factors of pancreatic cancer by evaluation of optical markers in the duodenal mucosa. Disease Markers. 2008;vol. 25:313–321. doi: 10.1155/2008/958214. [DOI] [PMC free article] [PubMed] [Google Scholar]
- 21.Muskens OL, Lagendijk A. Broadband enhanced backscattering spectroscopy of strongly scattering media. Opt. Express. 2008;16:1222–1231. doi: 10.1364/oe.16.001222. [DOI] [PubMed] [Google Scholar]
- 22.Lenke R, Maret G. Multiple Scattering of Light: Coherent Backscattering and Transmission. In: Brown W, Mortensen K, editors. Scattering in Polymerica and Colloidal Systems. 2000. [Google Scholar]
- 23.Muinonen K. Coherent backscattering of light by complex random media of spherical scatterers: numerical solution. Waves in Random Media. 2004 Jul;vol. 14:365–388. [Google Scholar]
- 24.Sawicki J, Kastor N, Xu M. Electric field Monte Carlo simulation of coherent backscattering of polarized light by a turbid medium containing Mie scatterers. Opt. Exp. 2008 Apr 14;vol. 16:5728–5738. doi: 10.1364/oe.16.005728. [DOI] [PubMed] [Google Scholar]
- 25.Turzhitsky V, Rogers JD, Mutyal NN, Roy HK, Backman V. Characterization of Light Transport in Scattering Media at Subdiffusion Length Scales with Low-Coherence Enhanced Backscattering. IEEE Journal of Selected Topics in Quantum Electronics. 2010 May-Jun;vol. 16:619–626. doi: 10.1109/JSTQE.2009.2032666. [DOI] [PMC free article] [PubMed] [Google Scholar]
- 26.Rogers JD, Stoyneva V, Turzhitsky V, Mutyal NN, Pradhan P, Capoglu IR, Backman V. Alternate formulation of enhanced backscattering as phase conjugation and diffraction: derivation and experimental observation. Opt Exp. 2011;vol. 19:11922–11931. doi: 10.1364/OE.19.011922. [DOI] [PMC free article] [PubMed] [Google Scholar]
- 27.Mishchenko MI, Travis LD, Lacis AA. Multiple scattering of light by particles : radiative transfer and coherent backscattering. Cambridge ; New York: Cambridge University Press; 2006. [Google Scholar]
- 28.Lenke R, Maret G. Magnetic field effects on coherent backscattering of light. European Physical Journal B. 2000;17:171–185. [Google Scholar]
- 29.Radosevich AJ, Mutyal NN, Turzhitsky V, Rogers JD, Yi J, Taflove A, Backman V. Measurement of the spatial backscattering impulse- response at short length-scales with polarized enhanced backscattering (EBS) Opt Lett. doi: 10.1364/OL.36.004737. (submitted) [DOI] [PMC free article] [PubMed] [Google Scholar]
- 30.Wang LH, Jacques SL, Zheng LQ. CONV - convolution for responses to a finite diameter photon beam incident on multi-layered tissues. Computer Methods and Programs in Biomedicine. 1997 Nov;vol. 54:141–150. doi: 10.1016/s0169-2607(97)00021-7. [DOI] [PubMed] [Google Scholar]
- 31.Xu M, Alfano RR. Fractal mechanisms of light scattering in biological tissue and cells. Opt Lett. 2005 Nov 15;vol. 30:3051–3053. doi: 10.1364/ol.30.003051. [DOI] [PubMed] [Google Scholar]
- 32.Rogers JD, Capoglu IR, Backman V. Nonscalar elastic light scattering from continuous random media in the Born approximation. Opt Lett. 2009 Jun 15;vol. 34:1891–1893. doi: 10.1364/ol.34.001891. [DOI] [PMC free article] [PubMed] [Google Scholar]
- 33.Guttorp P, Gneiting T. Studies in the history of probability and statistics XLIX On the Matern correlation family. Biometrika. 2006 Dec;vol. 93:989–995. [Google Scholar]
- 34.Turzhitsky V, Radosevich A, Rogers JD, Taflove A, Backman V. A predictive model of backscattering at subdiffusion length scales. Biomed Opt Express. 2010;vol. 1:1034–1046. doi: 10.1364/BOE.1.001034. [DOI] [PMC free article] [PubMed] [Google Scholar]
- 35.Ishimaru A. Wave propagation and scattering in random media. New York: IEEE Press-Oxford University Press; 1997. [Google Scholar]
- 36.Turzhitsky V, Radosevich AJ, Rogers JD, Mutyal NN, Backman V. Measurement of optical scattering properties with low-coherence enhanced backscattering spectroscopy. J Biomed Opt. 2011 doi: 10.1117/1.3589349. [DOI] [PMC free article] [PubMed] [Google Scholar]
- 37.B P. Distribution of Protein within Normal Rat Lens. Investigative Ophthalmology and Visual Science. 1969;vol. 8:258–270. [PubMed] [Google Scholar]
- 38.Barer R, Joseph S. Refractometry of Living Cells .1. Basic Principles. Quarterly Journal of Microscopical Science. 1954;vol. 95:399–423. [Google Scholar]
- 39. http://biophotonics.bme.northwestern.edu/resources/index.html. [Google Scholar]
- 40.Mcneil GT. Metrical Fundamentals of Underwater Lens System. Optical Engineering. 1977;vol. 16:128–139. [Google Scholar]
- 41.Ramella-Roman JC, Prahl SA, Jacques SL. Three Monte Carlo programs of polarized light transport into scattering media: part I. Opt. Exp. 2005 Jun 13;vol. 13:4420–4438. doi: 10.1364/opex.13.004420. [DOI] [PubMed] [Google Scholar]
- 42.Boundy RH. Styrene: its polymers, copolymers, and derivatives. New York: Reinhold; 1952. [Google Scholar]
- 43.Hulst HCvd. Light scattering by small particles. New York: Wiley; 1957. [Google Scholar]
- 44.Moscoso M, Keller JB, Papanicolaou G. Depolarization and blurring of optical images by biological tissue. J Opt Soc Am A. 2001 Apr;vol. 18:948–960. doi: 10.1364/josaa.18.000948. [DOI] [PubMed] [Google Scholar]
- 45.Ospeck M, Fraden S. Influence of Reflecting Boundaries and Finite Interfacial Thickness on the Coherent Backscattering Cone. Phys Rev E. 1994 May;vol. 49:4578–4589. doi: 10.1103/physreve.49.4578. [DOI] [PubMed] [Google Scholar]
- 46.Wiersma DS, van Albada MP, Lagendijk A. An accurate technique to record the angular distribution of backscattered light. Rev Sci Instrum. 1995 Dec;vol. 66:5473–5476. [Google Scholar]
- 47.Wolf PE, Maret G, Akkermans E, Maynard R. Optical Coherent Backscattering by Random-Media - an Experimental-Study. Journal De Physique. 1988 Jan;vol. 49:63–75. [Google Scholar]
- 48.Kim YL, Liu Y, Wali RK, Roy HK, Backman V. Low-coherent backscattering spectroscopy for tissue characterization. Appl Opt. 2005 Jan 20;vol. 44:366–377. doi: 10.1364/ao.44.000366. [DOI] [PubMed] [Google Scholar]
- 49.Hielscher A, Eick A, Mourant J, Shen D, Freyer J, Bigio I. Diffuse backscattering Mueller matrices of highly scattering media. Optics Express. 1997 Dec 22;vol. 1:441–453. doi: 10.1364/oe.1.000441. [DOI] [PubMed] [Google Scholar]
- 50.Cheong WF, Prahl SA, Welch AJ. A Review of the Optical-Properties of Biological Tissues. IEEE Journal of Quantum Electronics. 1990 Dec;vol. 26:2166–2185. [Google Scholar]
- 51.Kienle A, Forster FK, Hibst R. Anisotropy of light propagation in biological tissue. Opt Lett. 2004 Nov 15;vol. 29:2617–2619. doi: 10.1364/ol.29.002617. [DOI] [PubMed] [Google Scholar]


