

Abstract
Objectives
Health professionals commonly advise patients with incontinence and other lower urinary tract symptoms about modifiable contributing factors such as drinking and voiding habits. Poor drinking and voiding habits may begin early in life, before symptoms emerge. However, little is known about the habits and knowledge young people have regarding healthy drinking and voiding behaviors. This research aimed to assess the habits and health knowledge of young people regarding fluid intake and voiding.
Methods
A questionnaire was used to assess the drinking and voiding behaviors of first year university students and their knowledge about healthy fluid intake and voiding.
Results
The average daily fluid intake was >2 L/day for both genders. Poor drinking and voiding habits (such as high consumption of caffeinated drinks and alcohol, or nocturia) were common. Widely reported myths about the benefits of a high fluid intake were commonly believed.
Conclusion
More informed public education regarding healthy fluid intake, and drinking and voiding habits, is required as part of the effort to reduce the development of lower urinary tract symptoms, including incontinence.
Keywords: drinking behavior, fluid intake, habits, health knowledge, urination disorders
Introduction
Management of incontinence and other lower urinary tract symptoms (LUTS) frequently involves education about modifiable contributing factors, such as fluid intake and drinking and voiding habits.1 As it has considerable social and health ramifications, incontinence has been described as a public health problem. Consequently, primary prevention of incontinence requires more attention,2 including promotion of healthy drinking and voiding habits. However, little is known about the drinking and voiding habits of the general population, nor what healthy individuals believe about their drinking and voiding habits.
Fluid intake may be influenced by the common misconception (with no scientific basis) that drinking 2 L/day water is healthy.3 Rather, incontinence can improve with restricted fluid intake1,4,5 and healthy American adults demonstrate variable fluid intake.6,7
This paper presents findings from a study that assessed the habits and beliefs of young, educated people regarding healthy drinking and voiding. We tested the hypothesis that differences in habits and beliefs may be associated with gender, older age, regular gym attendance, regular sport participation, high body mass index (BMI), and types of drinks usually consumed. A better understanding of young people’s knowledge and practices may inform strategies to prevent and treat LUTS and advance research to test associations between drinking and voiding habits and LUTS.
Methods
Ethics
Approval was granted by the University of South Australia Human Research Ethics Committee.
Design
Observational cross-sectional survey.
Recruitment
First year university students in the Division of Health Sciences, University of South Australia, aged between 16 and 35 years were recruited via questionnaires distributed during class and collected via drop boxes left at the door, or via their teacher (internal students), or via an email link to an online version (external students). Assuming full class attendance, the number of students who could have the questionnaire was 1189. How many of these fitted the stipulated age range is not known.
Measures
A questionnaire was designed to investigate fluid intake and output habits and beliefs. Its psychometric properties have been reported previously.8 Measures of drinking habits included average daily volume, drinking large amounts of caffeinated drinks/alcohol, drinking extra to lose/maintain weight, drinking when not thirsty, and restricting fluid to control urinary symptoms. Measures of voiding habits included average number of daily voids, voiding “just in case”, and waking at night to void.
Average daily fluid intake volume was assessed via presentation of a list of beverage types (water, caffeinated and decaffeinated tea and coffee, caffeinated and noncaffeinated soft drink, milk, fruit juices, sports drinks, and alcohol). Participants indicated, on average, how many drinks of each beverage they consumed per day, and how large the serving was. Daily frequency was assessed by asking participants how often they urinated during the daytime; options were 1–3, 4–7, 8–10, or >10. All other questions on drinking and voiding habits had ordinal response scales including the options “never”, “occasionally/sometimes”, “most of the time”, and “all of the time”.
Knowledge and beliefs were assessed by participants selecting “true/false/I don’t know” for common myths and facts regarding healthy drinking and voiding habits. An open question ascertained how much fluid the participants believed was required per day.
Demographic data on factors that may influence fluid intake were collected, including age, gender, self-reported height and weight, activity levels, and in females, pregnancy status.
Data management
Data was entered into a Microsoft Excel file and analyses undertaken using SAS® Software (v9.2; Cary, NC). For fluid intake, the number and size of each drink was multiplied, and then each drink amount summed using Excel to produce a daily intake in mL. This method of calculating fluid intake has been demonstrated to correlate well with data from bladder diaries.4 A mean and standard deviation of daily fluid intake was calculated for both genders.
To assess drinking and voiding habits, measured using ordinal scales, the percentage of participants choosing each response was calculated.
For the knowledge section (assessed as “true/false/I don’t know” answers), the percentage of participants selecting each response was calculated. For the open ended question, responses were coded and the percentage of subjects who gave an answer belonging to a particular code was calculated.
BMI was calculated from self-reported height and weight. A BMI of 25–29.9 was considered overweight and a BMI of ≥30 was considered obese. Age was expressed in years, and sports and gym participation were expressed as binary variables (yes = regular, no = irregular/none).
Data analysis
This paper tests the hypothesis that fluid intake and voiding habits are associated with gender, older age, regular attendance at gym, regular participation in sport, high BMI, and types of drinks.
Two sets of analysis were undertaken, to predict fluid intake, and voiding habits. All preliminary analysis was undertaken separately for males and females, on the hypothesis that there may be gender differences in the factors associated with fluid input and voiding habits. Data on pregnant females were removed for the purposes of sample homogeneity in terms of voiding and fluid intake (n = 2).
For fluid intake, the normality of the frequency distribution was assessed using the Shapiro–Wilk statistic (>0.98 indicates normal distribution). If this was not normally distributed, the distribution was transformed using its square or square root (whichever provided the closest approximation to normal). The association between normalized fluid intake and equal interval putative predictors (age, BMI) was assessed using univariate linear regression models (proc reg commands in SAS), and reported as r2 values. Moreover, differences in fluid intake were calculated for the two levels of sports participation and gym attendance.
Data on voiding habits were collected in categories of 0–3, 4–7, 8–10, and >10 times daily, and was expressed for preliminary analysis in separate categories.
To test the association between all putative causes (including categorical, ordinal, and continuous variables), and to develop predictive models for fluid intake and voiding habits, the dependent variables were treated in binary form, and separate multivariate logistic regression models were constructed. Univariate logistic regression analyses identified the most important predictors, and then multivariate models were developed for each outcome variable, using stepwise progression, by adding predictors in order of association strength. The median values of the equal interval or ordinal dependent and independent variables were used as cut points to determine binary forms of the data, and the natural binary divisions of the other categorical independent variables were applied, so that all variables were in the same format for analysis. The proc logistic commands in SAS were used for modeling, and findings were reported as odds ratios (ORs) and 95% confidence intervals (CIs).
Results
Sample size/demographics
The survey was completed by 526 participants aged 16–35 years. An exact response rate cannot be calculated as most questionnaires were distributed in class time, and whilst the size of class enrollments is known, student numbers present in class is not known. Assuming full attendance in class, the estimated response rate was 44%. Respondents included 154 males (29.3%) and 371 females (70.7%); one respondent did not report gender. Demographics are presented in Table 1.
Table 1.
Demographic data
| Demographic | % total participants | % female participants | % male participants |
|---|---|---|---|
| High impact sport players | 78.9 | 73.9 | 90.9 |
| (n = 414) | (n = 274) | (n = 140) | |
| Gym attendance at least weekly | 27.2 | 22.1 | 32.5 |
| (n = 145) | (n = 82) | (n = 50) | |
| Currently pregnant | – | 0.5% | – |
| (n = 2) | |||
| Body mass index = overweight or obese | 17 | 12.7 | 25.3 |
| (n = 87) | (n = 47) | (n = 39) |
Research aim 1: drinking and voiding habits
Fluid intake
Data were available for approximately 98% of male and female respondents and was not normally distributed (SW = 0.76, P < 0.001); therefore nonparametric statistical test results were reported.
Overall median fluid intake was 2600 mL (lower [25th] to upper [75th] quartiles; 2000–3650 mL). Males’ median fluid intake was 2950 mL (interquartile range 1700 mL) whilst females’ was 2500 mL (inter-quartile range 1450 mL). The gender difference in fluid intake was significant (P < 0.05).
To test the univariate association between fluid intake with age and BMI in linear regression models, the frequency distribution of the fluid intake variable was normalized by using the square root of the raw data. Fluid intake did not have a significant association with age (males r2 = 0.002, females r2 = 0.003) or BMI (males r2 = 0.006, females r2 = 0.02). Moreover, the median fluid intake (lower [25th] to upper [75th] quartiles) was no different between those who did, or did not, regularly participate in sport or attend the gym: (no regular sports participation 2450 mL [1700–3100 mL], regular sports participation 2700 mL [2000–3600 mL]; no regular gym attendance 2600 mL [2875–3400 mL], regular gym attendance 2900 mL [2200–3900 mL]).
The multivariate logistic regression model which assessed the probability that in combination, the independent variables were associated with individuals drinking at least the median (overall) fluid intake, demonstrated that drinking at least this amount of fluid every day was significantly predicted by gender (males are 1.9 times more likely than females to drink this amount) and BMI (individuals with at least the median BMI (21.99) are 1.7 times more likely than people with lower BMIs to drink this amount). No other independent variable predicted fluid intake significantly. Cut off points for the independent variables, OR and 95% CI are listed in Table 2.
Table 2.
Odds ratios (95% confidence intervals) of associates of drinking at least the median fluid intake
| Variable | Cut point | Odds ratios | 95% wald confidence limits | |
|---|---|---|---|---|
| Gender | Male | 1.866 | 1.244 | 2.800 |
| Body mass index | Median 21.98 | 1.745 | 1.271 | 2.504 |
| Age | Median 19 | 1.250 | 0.877 | 1.783 |
| Sport | Yes | 1.111 | 0.713 | 1.733 |
| Gym | Yes | 1.220 | 0.813 | 1.832 |
Note: Bold figures are significant associations.
Drinking large amounts of caffeine or alcohol can be considered poor habits for those with LUTS. Drinking extra to lose weight and forced drinking when not thirsty are also habits with no scientific rationale.8 The percentage of individuals who reported never engaging in these habits is presented in Figure 1. The percentage of individuals who reported engaging in these habits most or all of the time is presented in Figure 2. The only drinking habit that cannot be uniformly considered poor is restricting fluid to control urinary symptoms, as this has been shown to be an effective strategy.1,4,5 This habit was rare; data are presented in Table 3.
Figure 1.
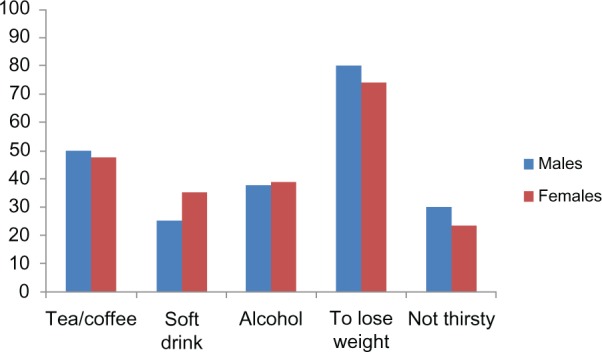
Percentage of individuals who never engage in poor drinking habits.
Figure 2.
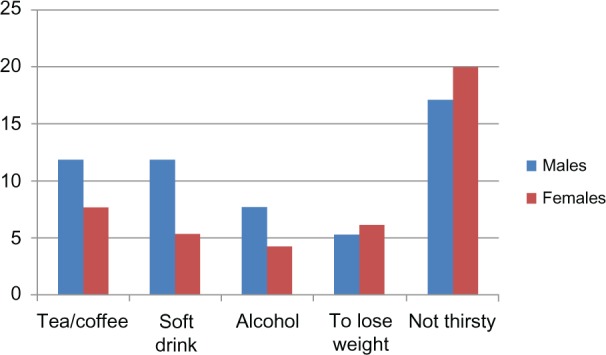
Percentage of individuals who often engage in poor drinking habits.
Table 3.
Restricting fluid intake to control urinary symptoms
| Drinking habit | Gender | Never | Occasionally/sometimes | Most of the time | All of the time |
|---|---|---|---|---|---|
| Drink less to control urinary symptoms | Male | 130 (86.1%) | 20 (13.2%) | 0 (0%) | 1 (0.7%) |
| Female | 306 (83.2%) | 57 (15.5%) | 4 (1.1%) | 2 (0.5%) |
Voiding habits
Data were available for 151 males (98.0%) and 362 (97.6%) females. The majority of males and females reported voiding 4–7 times daily (Table 4).
Table 4.
Daily voids in males and females
| Gender | Number of voids per day
|
||||
|---|---|---|---|---|---|
| 0–3 | 4–7 | 8–10 | >10 | Total | |
| Males | 53 (35.1%) | 90 (59.6%) | 6 (4%) | 2 (1.3%) | 151 |
| Females | 118 (32.6%) | 203 (56.1%) | 17 (4.7%) | 24 (6.6%) | 362 |
Voiding “just in case” and waking to void at night are both considered poor habits.9,10 The percentage of individuals who reported never engaging in these habits is presented in Figure 3. The percentage of individuals who reported engaging in these habits most or all of the time is presented in Figure 4.
Figure 3.
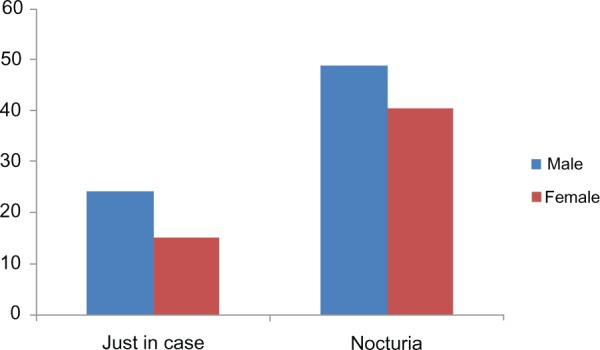
Percentage of individuals who never engage in poor voiding habits.
Figure 4.
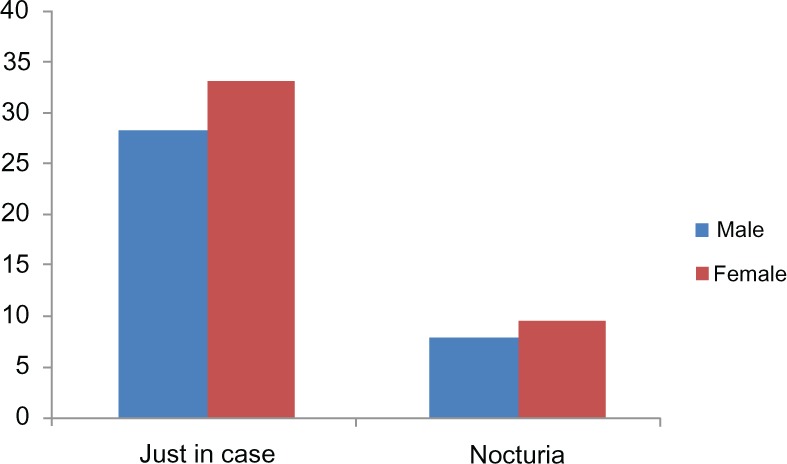
Percentage of individuals who often engage in poor voiding habits.
These graphs suggest that there was a likely relationship between nocturia and voiding “just in case”. Consequently, the relationship between voiding “just in case” and nocturia was examined using an additional multivariate logistic regression model which tested median cut point binary forms of the independent variables of age, gender, BMI, sport and gym participation, and fluid intake. The results are presented in Table 5.
Table 5.
Probability that an independent variable predicts waking at night to void
| Effect | Point estimate | 95% Wald confidence limits | |
|---|---|---|---|
| Gender | 0.959 | 0.476 | 1.933 |
| Voiding just in case | 2.325 | 1.282 | 4.218 |
| Fluid intake | 1.022 | 0.577 | 1.873 |
| Body mass index | 1.193 | 0.644 | 2.207 |
| Age | 1.577 | 0.861 | 2.891 |
| Sport | 0.560 | 0.285 | 1.098 |
| Gym | 0.675 | 0.319 | 1.429 |
Note: Bold figures show significant predictor.
Voiding “just in case” was the only variable significantly predicting nocturia. Participants who often voided “just in case” during the day were 2.3 times more likely than those who rarely voided “just in case” to wake during the night to void. This relationship is also true in reverse with those who often wake at night to void “just in case” 2.3 times more likely than those who rarely wake at night to void “just in case” to experience nocturia. No other independent variables predicted waking to void at night.
Research aim 2: beliefs about drinking and voiding habits
Eight glasses of water or 2 L/day was the most common response (50% males [n = 77] and 53.6% females [n = 199]) to the question “how much fluid do you think a person is supposed to drink in a day?” In total 74% of males (n = 114) and 66.6% of females (n = 247) thought they should be drinking ≥2 L, with responses ranging from 2–3 L up to 8 L/day. An amount of 1–2 L was suggested by 16.2% of males (n = 25) and 24.8% of females (n = 92). Other responses, including less than a liter, estimates of mL/kg, wide ranges, or simply “lots” were offered by 3.6% of males (n = 6) and 4.3% of females (n = 15). “Don’t know” was volunteered by 3.9% of males (n = 6) and 2.4% of females (n = 9), whilst 1.9% of males (n = 3) and 2.2% of females (n = 8) gave no answer.
Percentages of each response (“true/false/I don’t know”) to each myth/fact listed in the questionnaire are presented in Table 6.
Table 6.
True/false/I don’t know responses to myths and facts
| Myth/fact (abbreviated form of questionnaire statement) and gender | True
|
False
|
Don’t know
|
Total
|
||||
|---|---|---|---|---|---|---|---|---|
| M | F | M | F | M | F | M | F | |
| N (%) | N (%) | N (%) | N (%) | N (%) | N (%) | N (%) | N (%) | |
| Need an extra drink of water after tea or coffee as they dehydrate | 77 | 187 | 30 | 59 | 41 | 107 | 148 | 353 |
| (52.2) | (52.8) | (20.3) | (16.7) | (27.7) | (30.3) | |||
| Alcohol doesn’t count as fluid as it dehydrates | 83 | 210 | 37 | 86 | 29 | 59 | 149 | 355 |
| (55.7) | (59.5) | (24.8) | (24.2) | (19.5) | (16.6) | |||
| Drinking lots of water prevents acne | 55 | 204 | 24 | 52 | 69 | 99 | 148 | 355 |
| (37.2) | (57.5) | (16.2) | (14.7) | (46.6) | (27.9) | |||
| Drinking lots of water makes hair shinier | 21 | 103 | 48 | 88 | 79 | 165 | 148 | 356 |
| (14.2) | (69.6) | (32.4) | (24.7) | (53.4) | (46.4) | |||
| Drinking lots of water prevents fatigue | 110 | 222 | 12 | 46 | 26 | 86 | 148 | 356 |
| (74.3) | (62.7) | (8.1) | (13.0) | (17.6) | (24.3) | |||
| Drinking lots of water prevents constipation | 89 | 253 | 10 | 21 | 49 | 81 | 148 | 355 |
| (60.1) | (71.3) | (6.8) | (14.2) | (33.1) | (22.8) | |||
| Drinking lots of water helps digestion | 116 | 291 | 4 | 17 | 28 | 46 | 148 | 354 |
| (78.4) | (82.2) | (2.7) | (4.8) | (18.9) | (13.0) | |||
| Drinking lots of water prevents urinary tract and bladder infections | 90 | 215 | 12 | 27 | 46 | 114 | 148 | 356 |
| (60.8) | (60.4) | (8.1) | (7.6) | (31.1) | (32.0) | |||
| Drinking lots of water flushes toxins from the system | 124 | 325 | 5 | 7 | 18 | 24 | 147 | 356 |
| (84.4) | (91.3) | (3.4) | (2.0) | (12.2) | (6.7) | |||
| Don’t wait until thirsty – you are already dehydrated | 101 | 274 | 18 | 27 | 29 | 54 | 148 | 355 |
| (68.2) | (77.2) | (12.2) | (7.6) | (19.6) | (15.2) | |||
| Drink enough to make urine straw colored | 31 | 98 | 64 | 140 | 52 | 118 | 147 | 356 |
| (21.1) | (27.5) | (43.5) | (39.3) | (35.4) | (33.2) | |||
| Drink enough to make urine clear | 87 | 206 | 30 | 55 | 30 | 95 | 147 | 356 |
| (59.18) | (57.9) | (20.4) | (15.5) | (20.4) | (26.7) | |||
| Drinking too much water can be bad for health | 61 | 124 | 58 | 158 | 28 | 73 | 147 | 355 |
| (41.5) | (34.9) | (39.5) | (44.5) | (19.1) | (20.6) | |||
| Drinking water is harmless so it doesn’t matter how much you have | 40 | 98 | 76 | 183 | 29 | 73 | 145 | 345 |
| (27.6) | (28.4) | (52.4) | (53.0) | (20.0) | (21.2) | |||
| Thirst is a good indicator of when you need to drink | 81 | 200 | 48 | 129 | 17 | 26 | 146 | 355 |
| (55.5) | (56.3) | (32.9) | (36.3) | (11.6) | (7.3) | |||
| Daily fluid needs are provided from foods as well as drinks | 91 | 261 | 12 | 21 | 42 | 73 | 145 | 355 |
| (62.8) | (73.5) | (8.3) | (5.9) | (29.0) | (20.6) | |||
Only three items in the table have scientific backing and therefore can be considered fact rather than myth8; these are “drinking too much water can be bad for health”, “thirst is a good indicator of when you need to drink”, and “daily fluid needs are provided from foods as well as drinks”. The majority of respondents agreed with the latter statement, but only just over half believed that thirst was a good indicator of needing to drink, and less than half believed that drinking too much water could be harmful. In contrast, most of the myths regarding the benefits of high water consumption were believed by the majority of respondents. The most commonly believed myths were that high water consumption aids digestion and flushes toxins from the system.
Discussion
This paper is the first to our knowledge to present findings regarding the habits and beliefs of young, healthy people regarding healthy fluid intake and voiding habits. Reflective of the larger number of female students studying health sciences, more than two thirds of respondents were female, which limits the generalizability of data to both genders; hence data for males and females have been presented separately. However, similar drinking and voiding habits were noted overall for both males and females. Whilst poor drinking and voiding habits are not commonly engaged in “most or all of the time”, neither are they routinely avoided, with the majority of respondents engaging in poor habits at least occasionally. Furthermore, most respondents believe the common recommendation that they should be drinking at least eight glasses of water a day and also believe common myths about the supposed benefits of high water intake. This provides a rationale for improving community education about healthy fluid consumption and drinking and voiding habits.
It has been demonstrated that the average fluid intake of adults aged 40–80 years, including fluid obtained from food, is 3 L ± 0.9 L for men and 2.5 L ± 0.7 L for women.6 This is comparable to the results obtained from fluid intake reported in this study. Thus, given that fluid from food is estimated at 1 L,6 subjects in this study demonstrated a higher overall fluid intake than previously reported. Activity levels did not explain higher fluid intake. Weather is unlikely to explain high fluid intake as data were not collected during the hot Australian summer. Apart from gender and BMI, the only two variables shown to be associated with higher fluid intake, the prevailing belief that at least eight glasses of water a day are necessary may explain the predominant behavior of drinking at least that much.
Drinking large amounts of caffeinated drinks and alcohol, at least occasionally, was the norm in this cohort of young people, which may be part of university culture. The 2004–2005 Australian National Health Survey revealed that 19% of males and 11% of females aged 18–24 years engaged in binge drinking of alcohol11; in the current study 62% of both males and females reported drinking large amounts of alcohol at least occasionally. Amongst other detrimental effects on health, alcohol consumption is hypothesized to contribute to LUTS due to its diuretic effect.12 High caffeine intake has been shown to be associated with detrusor instability in incontinent women,13 and advice on the consumption of caffeinated drinks and alcohol is often included in the management of individuals with LUTS. The high intake of these beverages in healthy young people suggests that caffeine or alcohol consumption is worth investigating as possible etiological or precursor factors in young people presenting with LUTS.
Most participants reported normal frequency (voiding less than eight times/day).12 More than half reported waking to void at night at least occasionally with 17.5% reporting this habit most, or all of the time, demonstrating nocturia according to the 2002 International Continence Society definition.9 Emptying the bladder “just in case” is a habit anecdotally discouraged during rehabilitation for LUTS. Despite this, it was a common habit reported in this study by both males and females, corroborating previous findings that young females often void without sensory urge.14 Possibly, voiding “just in case” is normal in some situations. However, voiding “just in case” and nocturia were strongly associated, as individuals reporting one event were more than twice as likely to also report the other. It is possible that nocturnal voiding may be an example of “just in case” voiding if individuals void because they wake rather than wake because they have a full bladder.
Most participants believed that if they were thirsty, they were already dehydrated. This belief is not scientifically supported; rather, the physiological mechanisms maintaining water balance in the body, including thirst, have been demonstrated to be efficient.3 However, only just over half of respondents believed that thirst was a good indicator of needing to drink. Half the female respondents made themself drink when not thirsty, however only 20% of males reported this habit, indicating that more women than men acted on their belief that once thirsty they were already dehydrated.
Conclusion
This study investigated healthy young people’s habits and beliefs regarding drinking and voiding. Average fluid consumption was higher than anticipated, consistent with the common belief that ≥2 L of water a day should be drunk. Myths regarding benefits of high water consumption were widely believed, and poor drinking habits were common, highlighting the need for more informed public education about healthy fluid consumption. Whilst daily voiding frequency was normal for most, voiding habits generally considered to be unhealthy (voiding “just in case” and nocturia) were also common.
Footnotes
Disclosure
The authors report no conflicts of interest in this work.
References
- 1.Swithinbank L, Hashim H, Abrams P. The effect of fluid intake on urinary symptoms in women. J Urol. 2005;174(1):187–189. doi: 10.1097/01.ju.0000162020.10447.31. [DOI] [PubMed] [Google Scholar]
- 2.Landefeld CS, Bowers BJ, Feld AD, et al. National institutes of health state-of-the-science conference statement: prevention of fecal and urinary incontinence in adults. Ann Intern Med. 2008;148(6):449–499. doi: 10.7326/0003-4819-148-6-200803180-00210. [DOI] [PubMed] [Google Scholar]
- 3.Valtin H. “Drink at least eight glasses of water a day.” Really? Is there scientific evidence for “8 × 8”? Am J Physiol Regul Integr Comp Physiol. 2002;283(5):R993–R1004. doi: 10.1152/ajpregu.00365.2002. [DOI] [PubMed] [Google Scholar]
- 4.Arya LA, Banks C, Gopal M, Northington GM. Development and testing of a new instrument to measure fluid intake, output, and urinary symptoms: the questionnaire-based voiding diary. Am J Obstet Gynecol. 2008;198(5):559.e1–e7. doi: 10.1016/j.ajog.2008.01.049. [DOI] [PubMed] [Google Scholar]
- 5.Hashim H, Abrams P. How should patients with an overactive bladder manipulate their fluid intake? BJU International. 2008;102(1):62–66. doi: 10.1111/j.1464-410X.2008.07463.x. [DOI] [PubMed] [Google Scholar]
- 6.Raman A, Schoeller DA, Subar AF, et al. Water turnover in 458 American adults 40–79 yr of age. Am J Physiol Renal Physiol. 2004;286(2):394–401. doi: 10.1152/ajprenal.00295.2003. [DOI] [PubMed] [Google Scholar]
- 7.Amundsen CL, Parsons M, Tissot B, Cardozo L, Diokno A, Coats AC. Bladder diary measurements in asymptomatic females: functional bladder capacity, frequency, and 24-hr volume. Neurourol Urodyn. 2007;26(3):341–349. doi: 10.1002/nau.20241. [DOI] [PubMed] [Google Scholar]
- 8.Das RN, Grimmer-Somers KA. Development of a questionnaire to assess habits, knowledge and beliefs about fluid intake and output. Aust NZ Continence J. 2011;17(3):70–76. [Google Scholar]
- 9.Abrams P, Cardozo L, Fall M, et al. The standardisation of terminology of lower urinary tract function: Report from the standardisation subcommittee of the international continence society. Neurourol Urodyn. 2002;21(2):167–178. doi: 10.1002/nau.10052. [DOI] [PubMed] [Google Scholar]
- 10.Eliasson K, Nordlander I, Mattsson E, Larson B, Hammarström M. Prevalence of urinary leakage in nulliparous women with respect to physical activity and micturition habits. Int Urogynecol J Pelvic Floor Dysfunct. 2004;15(3):149–153. doi: 10.1007/s00192-004-1135-y. [DOI] [PubMed] [Google Scholar]
- 11.Australian Beureau of Statisitics Alcohol Consumption in Australia: a Snapshot 2004–2005 Available from: http://www.abs.gov.au/AUSSTATS/abs@.nsf/Latestproducts/4832.0.55.001Main%20Features12004-05?opendocument&tabname=Summary&prodno=4832.0.55.001&issue=2004-05&num=&view=#Accessed July 27, 2010
- 12.Chapple C. Anatomy, Physiology and pathogenesis of bladder overactivity. In: Chapple CR, Zimmern PE, Brubaker L, Smith A, Bo K, editors. Multidisciplinary Management of Female Pelvic Floor Disorders. Philadelphia: Churchill Livingstone Elsevier; 2006. pp. 51–63. [Google Scholar]
- 13.Arya LA, Myers DL, Jackson ND. Dietary caffeine intake and the risk for detrusor instability: A case control study. Obstet Gynecol. 2000;96(1):85–89. doi: 10.1016/s0029-7844(00)00808-5. [DOI] [PubMed] [Google Scholar]
- 14.De Wachter S, Wyndaele JJ. Frequency-volume charts: a tool to evaluate bladder sensation. Neurourol Urodyn. 2003;22(7):638–642. doi: 10.1002/nau.10160. [DOI] [PubMed] [Google Scholar]