

Abstract
Increased de novo lipogenesis is a hallmark of aggressive cancers. Lipid droplets, the major form of cytosolic lipid storage, have been implicated in cancer cell proliferation and tumorigenesis. Recently, we identified the ERLIN2 [ER (endoplasmic reticulum) lipid raft-associated 2) gene that is amplified and overexpressed in aggressive human breast cancer. Previous studies demonstrated that ERLIN2 plays a supporting oncogenic role by facilitating the transformation of human breast cancer cells. In the present study, we found that ERLIN2 supports cancer cell growth by regulating cytosolic lipid droplet production. ERLIN2 is preferably expressed in human breast cancer cells or hepatoma cells and is inducible by insulin signalling or when cells are cultured in lipoprotein-deficient medium. Increased expression of ERLIN2 promotes the accumulation of cytosolic lipid droplets in breast cancer cells or hepatoma cells in response to insulin or overload of unsaturated fatty acids. ERLIN2 regulates activation of SREBP (sterol regulatory element-binding protein) 1c, the key regulator of de novo lipogenesis, in cancer cells. ERLIN2 was found to bind to INSIG1 (insulin-induced gene 1), a key ER membrane protein that blocks SREBP activation. Consistent with the role of ERLIN2 in regulating cytosolic lipid content, down-regulation of ERLIN2 in breast cancer or hepatoma cells led to lower cell proliferation rates. The present study revealed a novel role for ERLIN2 in supporting cancer cell growth by promoting the activation of the key lipogenic regulator SREBP1c and the production of cytosolic lipid droplets. The identification of ERLIN2 as a regulator of cytosolic lipid content in cancer cells has important implications for understanding the molecular basis of tumorigenesis and the treatment of cancer.
Keywords: cancer, endoplasmic reticulum (ER), ER membrane lipid raft-associated 2 (ERLIN2), lipogenesis, oncogenesis
INTRODUCTION
Increased lipid and energy metabolism is a prominent feature of cancer [1]. It has been demonstrated that the lipogenic phenotype and activation of lipogenic enzymes correlate with a poorer prognosis and shorter disease-free survival for patients with different tumour types [2]. Production of lipid droplets, the main cytosolic lipid storage organelle in eukaryotic cells, is closely associated with de novo lipogenesis [3]. Indeed, elevated lipid droplet content is implicated in cancer cell proliferation and tumorigenesis and has been increasingly recognized as a hallmark of aggressive cancers [2,4].
ERLIN2 {ER (endoplasmic reticulum) membrane lipid raft-associated 2; also known as SPFH2 [SPFH (stomatin/prohibitin/flotillin/HflK/C) domain family, member 2] and C8ORF2 [chromosome 8 open reading frame 2]} and its homologue ERLIN1 belong to a larger family of proteins that share an evolutionarily conserved SPFH domain [5]. Recent high-resolution genomic analyses of copy number in human breast cancer specimens demonstrated that high-level amplification of the ERLIN2 region occurs in 28 % of cases [6]. On the basis of statistical analysis of copy number increase and overexpression, we and others have identified the ERLIN2 gene as one of several candidate oncogenes within the 8p11-12 amplicon [7–11]. Together with other identified oncogenes in the 8p11-12 amplicon, ERLIN2 promotes transformation of human breast cancer cells, although it does not behave as a classical transforming oncogene, such as receptor tyrosine kinases and the small GTPase Ras [7,10–12]. Previous studies suggested that ERLIN2 might mediate ER-associated protein degradation [5,13,14]. ERLIN1 and ERLIN2 interact with each other to form a functional complex. ERLIN2 can bind to the activated inositol trisphosphate receptors and other ERAD (ER-associated degradation) substrates, leading to polyubiquitination and subsequent degradation of these substrates [13,14]. ERLIN2 can also interact with ER-resident proteins GP78 [AMFR (autocrine motility factor receptor)] and TMUB1 (transmembrane and ubiquitin-like domain containing 1) to mediate degradation of HMG-CoA (3-hydroxy-3-methylglutaryl-CoA) reductase [15]. However, previous studies were focused on the biochemical characterization of ERLIN2 as a mediator of the ERAD pathway. The precise role and mechanism of ERLIN2 in aggressive cancer cells, where the ERLIN2 gene is amplified and overexpressed, remain poorly understood.
In the present study, we found that ERLIN2 plays an important role in regulating cytosolic lipid content and activation of SREBP (sterol regulatory element-binding protein) 1c, a key lipogenic regulator in human breast cancer cells and hepatoma cells. Furthermore, knockdown of endogenous ERLIN2 led to reduced cancer cell proliferation rates. Our finding that ERLIN2 regulates lipogenesis in cancer cells contributes to our understanding of the molecular basis governing lipid metabolism in tumorigenesis and could have important applications in cancer therapy.
MATERIALS AND METHODS
Materials
Chemicals were purchased from Sigma unless indicated otherwise. Synthetic oligonucleotides were purchased from Integrated DNA Technologies. Human insulin was purchased from Eli Lilly. Antibodies against FLAG, ERLIN1 and α-tubulin were purchased from Sigma. An antibody against ERLIN2 was purchased from Cell Signaling Technology. An antibody against SREBP1c was purchased from Thermo Scientific. ERLIN1 and ERLIN2 ON-TARGETplus siRNA SMARTpool® reagents were purchased from Dharmacon. Antibodies against T7, V5, INSIG1 (insulin-induced gene 1), SREBP1a and FAS (fatty acid synthase) were purchased from Santa Cruz Biotechnology. An antibody against SCAP (SREBP cleavage-activating protein) was purchased from Abcam. The monoclonal antibody against C-terminal SREBP2 was purchased from BD Pharmingen, and the polyclonal antibody against N-terminal SREBP2 was from Cayman Chemicals. The photo-reactive amino acids kit was from Thermo Scientific Pierce. The kit for measuring TGs (triglycerides) was from BioAssay System. The plasmid expressing T7-tagged human INSIG1 used in the present study was provided by Dr Jin Ye (University of Texas Southwestern Medical Center, Dallas, TX, U.S.A.) [16].
Cancer cell culture, lentivirus construction and transduction of cells
The human breast cancer cell lines SUM44 and SUM225, and the human mammary epithelial cell line MCF10A were cultured as described previously [12,17,18]. The human breast cancer cell line ZR-75-1 was purchased from the A.T.C.C. The human hepatocellular carcinoma cell line Huh-7 was cultured in DMEM (Dulbecco’s modified Eagle’s medium) containing 10 % FBS (fetal bovine serum), L-glutamine and antibiotics at 37 °C in a 5 % CO2 environment [19]. The details regarding the origins and culture conditions of these cancer cell lines are described in the Supplementary Online data (at http://www.BiochemJ.org/bj/446/bj4460415add.htm). The lentiviral expression construct containing human ERLIN2 (pLenti-ERLIN2) was established as described previously [7]. The lentivirus for pLenti-ERLIN2 was used to infect MCF10A or Huh-7 cells. Control infections with pLenti-LacZ virus were performed in parallel with the pLenti-ERLIN2 infections. Selection began 48 h after infection in growth medium with 10 μg/ml blasticidin. Upon confluence, selected cells were passaged and serially cultured.
Lentivirus-mediated shRNA (small hairpin RNA) knockdown of gene expression
We knocked down the expression of the human ERLIN2 gene in human breast cancer cell lines SUM225 and SUM44 or human hepatoma cell line Huh-7 by using the Expression Arrest GIPZ lentiviral shRNAmir system (OpenBiosystems). Lentivirus was produced by transfecting HEK (human embryonic kidney)-293FT cells with a combination of the lentiviral expression plasmid DNA and the Trans-Lentiviral packaging mix (OpenBiosystems). For cell infection, viral supernatants were supplemented with 6 μg/ml polybrene and incubated with the cells for 24 h. The cells expressing shRNA were selected with puromycin for 2–3 weeks for functional studies (cell proliferation assays) and for 4–10 days after infection for RNA extraction.
BODIPY (boron dipyrromethene) staining of lipid droplets
The cells were washed with PBS, fixed with 3 % formaldehyde for 15 min and stained with BODIPY 493/503 (stock 1 mg/ml, working solution 1:1000 dilution; Invitrogen) for 15 min at room temperature (25°C). Cells were then mounted with Prolong gold antifade reagent containing DAPI (4′,6-diamidino-2-phenylindole; Invitrogen).
Oil Red O staining of lipid droplets
Frozen liver tissue sections were stained with Oil Red O according to the standard protocol to visualize lipid droplet content. Briefly, frozen liver tissue sections of 8 μm were air-dried and then fixed in formalin. The fixed sections were rinsed with 60 %propan-2-ol before they were stained with freshly prepared Oil Red O solution for 15 min. After Oil Red O staining, the liver sections were rinsed again with 60 % propan-2-ol followed by washing with water.
Incorporation of photo-reactive amino acids and UV cross-linking to analyse the protein binding complex
Cells at 60–70 % confluence were washed twice with PBS and cultivated with DMEM limiting medium (without L-leucine and L-methionine) containing 2 mM photo-reactive leucine and 4 mM photo-reactive methionine analogues supplemented with 10 % dialysed FBS for 24 h. After washing twice with PBS, cells were UV-irradiated using a Stratalinker 1800 (UVA output at 1 cm = 3000 μW/cm2) for 12 min. The cell lysates were then collected in NP-40 (Nonidet P40) lysis buffer for IP (immunoprecipitation) Western blot analysis. The photo-reactive amino acids kit, DMEM limiting medium and dialysed FBS were purchased from Thermo Scientific Pierce.
Cell proliferation assay
Cell proliferation rates were determined using CellTiter 96 non-radioactive cell proliferation assay {MTT [3-(4,5-dimethyl-thiazol-2-yl)-2,5-diphenyl-2H-tetrazolium bromide]} kits from Promega. Briefly, approximately 5000 cells per well were seeded in triplicate in 96-well culture plates and allowed to attach for 24 h. After cell culture for 3, 6, 9 and 12 days, 20 μl of MTT (5 mg/ml) solution was added to 200 μl of medium in each well. Cells were cultured for an additional 4 h to allow MTT to be well metabolized. After that, the medium was aspirated, and 200 μl of DMSO was added into the well to dissolve the purple formazan crystals. The absorbance of the plate was measured at 570 nm using a plate reader.
Western blot and IP Western blot analyses
To determine expression levels of ERLIN1, ERLIN2, SREBPs, INSIG1, α-tubulin and GAPDH (glyceraldehyde-3-phosphate dehydrogenase), total cell lysates were prepared from cultured cells or liver tissue by using NP-40 lysis as described previously [20]. Denatured proteins were separated by SDS/PAGE (10 % Tris-Glycine polyacrylamide gels) and transferred on to a 0.45-mm PVDF membrane (GE Healthcare). Membrane-bound antibodies were detected by an enhanced chemiluminescence detection reagent (GE Healthcare). For IP Western blot analysis, total protein lysates from in vitro cultured cells were immunoprecipitated with the anti-ERLIN1, anti-ERLIN2 or anti-V5 antibody, followed by Western blot analysis with the anti-ERLIN1, anti-SCAP or anti-T7 antibody.
Quantitative real-time RT (reverse transcription)–PCR analysis
For real-time RT–PCR analysis, total cellular RNA was prepared using TRIzol reagent (Invitrogen) and reverse-transcribed to cDNA using a random primer. The real-time PCR reaction mixture containing cDNA template, primers and SYBR Green PCR Master Mix (Invitrogen) was run in a 7500 Fast Real-time PCR System (Applied Biosystems). The sequences of the PCR primers used in the present study are provided in the Supplementary Table S1 (at http://www.BiochemJ.org/bj/446/bj4460415add.htm). Fold changes of mRNA levels were determined after normalization to internal control β-actin RNA levels.
Statistics
Experimental results (quantitative real-time RT–PCR analysis, MTT assay and quantitative Western blot analysis) were calculated as means ± S.E.M. (for variation between animals or experiments). The differences among means between multiple (more than two) groups were analysed by one-way ANOVA followed by post-hoc comparisons of group means with the Tukey–Kramer test. The mean values for biochemical data from two experimental groups were compared by a paired or unpaired two-tailed Student’s t test. Differences of P < 0.05 were considered statistically significant.
RESULTS
ERLIN2 is overexpressed in human cancer cells and inducible by metabolic stress signals
Previously we and others demonstrated that the ERLIN2 gene was highly amplified in human breast cancer cell lines and breast tumours of aggressive forms [7–9]. Western blot analysis indicated that ERLIN2 was overexpressed in the aggressive human breast cancer cell lines SUM225, ZR-75-1, SUM44 and SUM52, and it was modestly expressed in the non-transformed human mammary epithelial cell line MCF10A (Figure 1A, [7]). Moreover, ERLIN2 was expressed in human hepatoma cell lines, including HepG2 and Huh-7, but only slightly expressed in murine primary hepatocytes (Figure 1A). Evidence suggests that elevated lipogenesis is essential for tumour cell survival and malignancy maintenance [2,4]. To elucidate the involvement of ERLIN2 in the lipogenic phenotype of human cancer cells, we exposed murine primary hepatocytes to metabolic stress conditions that are associated with lipogenesis and/or cancer cell growth. First, we found that expression of endogenous ERLIN2 in murine primary hepatocytes was inducible by insulin, a metabolic signal that induces activation of SREBP1c and de novo lipogenesis in the liver (Figure 1B) [21]. Secondly, expression of endogenous ERLIN2 was higher in primary hepatocytes cultured in medium containing LPDS (lipoprotein-deficient serum), a metabolic stress condition that triggers SREBP activation and de novo lipogenesis, in a time-dependent manner (Figure 1C). To further elucidate the effect of the insulin signal or LPDS on the induction of ERLIN2, we examined the induction of ERLIN2 mRNA in murine primary hepatocytes in response to insulin or LPDS challenge. Quantitative real-time RT–PCR analysis indicated that expression of ERLIN2 mRNA in primary hepatocytes is inducible by insulin or LPDS (Supplementary Figure S1 at http://www.BiochemJ.org/bj/446/bj4460415add.htm). However, there is a discrepancy in expression patterns between the ERLIN2 protein and mRNA levels. The discrepancy between protein and mRNA levels, which may be due to post-transcriptional regulation, has been observed with many genes involved in lipid metabolism [21–24].
Figure 1. ERLIN2 is preferentially expressed in cancer cells and is inducible by metabolic signals.

(A) Western blot analysis of ERLIN2 protein levels in the human breast cancer cell lines SUM225 and ZR-75-1, non-tumorigenic mammary epithelial cell line MCF10A, human hepatoma cell lines HepG2 and Huh-7, and murine primary hepatocytes (hep). Levels of GAPDH were included as loading controls. The values below the gels indicate ERLIN2 protein signal intensities [quantified using ImageJ (http://rsbweb.nih.gov/ij/)] after normalization to GAPDH signal intensities. (B) Western blot analysis of ERLIN2 protein levels in murine primary hepatocytes challenged with insulin (100 nM) for 1, 6 or 12 h. Murine primary hepatocytes were cultured in normal medium with vehicle buffer PBS added as a control (0 h under insulin). Tubulin was included as a loading control. The values below the gels indicate the ERLIN2 protein signal intensities after normalization to tubulin signal intensities. The graph beside the images shows fold changes of normalized ERLIN2 protein signal intensities (compared with 0 h control). Results are means ± S.E.M. (n = 3 experimental repeats); **P < 0.01. (C) Western blot analysis of ERLIN2 protein levels in murine primary hepatocytes cultured in medium containing LPDS for 1, 6, 12, 24 or 36 h. As a control, murine primary hepatocytes were cultured in normal medium containing 10 % FBS (0 h under LPDS). Tubulin was included as a loading control. The values below the gels indicate the ERLIN2 protein signal intensities after normalization to tubulin signal intensities. The graph beside the images shows fold changes of normalized ERLIN2 protein signal intensities (compared with 0 h control). Results are means ± S.E.M. (n = 3 experimental repeats); *P < 0.05; **P < 0.01. (D) Western blot analysis of ERLIN2 protein levels in liver tissues of mice given normal chow (NC) or an AHF diet for 6 months. GAPDH was included as a loading control. The values below the gels indicate the ERLIN2 protein signal intensities after normalization to GAPDH signal. The graph beside the images shows ERLIN2 protein signal intensities in the livers of mice fed with normal chow or AHF diet after normalization to GAPDH. Results are means ± S.E.M. (n = 5); **P < 0.01. For (A–D), the experiments were repeated three times and representative data are shown. (E) Quantitative real-time RT–PCR analysis of expression of ERLIN2 mRNA in the liver of age-matched male mice given normal chow (NC) or the AHF diet for 6 months. Expression values were normalized to β-actin mRNA levels. The baseline of the ERLIN2 mRNA level in one of the NC-fed mice was set to 1. Fold changes of the ERLIN2 mRNA levels in other mice were calculated by comparing with the baseline mRNA level. Results are means ± S.E.M. (n = 6 mice per group). **P < 0.01.
We also evaluated the expression of ERLIN2 in the liver of mice receiving normal chow or an AHF (atherogenic high-fat) diet known to induce atherosclerosis and fatty liver disease in murine models [25,26]. Expression levels of the ERLIN2 protein in the steatoic livers of the mice fed the AHF diet were much higher than those in mice fed the normal diet (Figure 1D). Quantitative real-time RT–PCR analysis confirmed that expression of ERLIN2 mRNA was significantly higher in the livers of the mice fed the AHF diet compared with the mice fed normal chow (Figure 1E). Together, the results suggest that expression of ERLIN2 is up-regulated in cancer cells and inducible by insulin or LPDS challenge. These findings motivated us to investigate the involvement of ERLIN2 in lipid metabolism associated with tumorigenesis.
ERLIN2 is required for cytosolic lipid droplet accumulation in cancer cells after insulin stimulation or overload of oleic acid
To assess the potential involvement of ERLIN2 in lipid metabolism in cancer cells, we analysed cytosolic lipid content in human mammary epithelial cells, breast cancer cells or hepatoma cells in which exogenous ERLIN2 was overexpressed or endogenous ERLIN2 was knocked down. Using a lentiviral expression system, we established a human mammary epithelial cell line (MCF10A) that stably expresses ERLIN2 or control LacZ (Figure 2A). Cytosolic lipid droplets, as indicated by BODIPY staining, accumulated in the MCF10A cells overexpressing exogenous ERLIN2, but not the LacZ control (Figure 2B). The human breast cancer cell line SUM225, in which the ERLIN2 gene was amplified and overexpressed, possesses abundant cytosolic lipid droplet contents (Figures 2C and 2D). However, when the endogenous ERLIN2 gene was knocked down, the levels of lipid droplet contents in the ERLIN2-knockdown SUM225 cells were significantly reduced. The reduction of lipid droplet contents in the absence of ERLIN2 was consistent with cellular TG levels in the ERLIN2-knockdown breast cancer cells (Supplementary Figure S2 at http://www.BiochemJ.org/bj/446/bj4460415add.htm). Together, these results suggest a potential role for ERLIN2 in promoting lipid droplet production in human breast cancer cells.
Figure 2. ERLIN2 regulates levels of cytosolic lipid content in human breast cancer cells.

(A) Western blot analysis of ERLIN2 levels in MCF10A cells stably overexpressing LacZ or ERLIN2 through a lentivirus-based expression system. Tubulin was used as a loading control. (B) BODIPY staining of lipid droplets in MCF10A cells stably overexpressing LacZ or ERLIN2. The cells were counterstained with DAPI. Magnification is ×630. (C) Western blot analysis of ERLIN2 levels in human breast cancer cell line SUM225, in which ERLIN2 is stably knocked down (EN2 KD) and its control cell line (Ctl). GAPDH was used as a loading control. (D) BODIPY staining of lipid droplets in the ERLIN2 knockdown (KD) and control (ctl) SUM225 cells. Magnification is ×630. For (A–D) the experiments were repeated three times and representative data are shown.
To verify the role of ERLIN2 in cytosolic lipid accumulation, we used the human hepatocellular carcinoma cell line Huh-7 [19], which has been used to study tumorigenesis or hepatic lipid metabolism. The ERLIN2 gene was stably silenced in Huh-7 cells by using a lentivirus-based shRNA system. The result of Western blot analysis indicated that expression levels of ERLIN2 protein were markedly reduced in the ERLIN2-knockdown Huh-7 cells, compared with the control cells transduced by a non-silencing shRNA control (Figure 3A). The ERLIN2-knockdown Huh-7 cells had much lower levels of lipid droplet content, indicated by Oil Red O staining, than the control cells (Figure 3B). Overexpression of ERLIN2 significantly increased lipid droplet accumulation in Huh-7 cells, consistent with the observation that ERLIN2 overexpression increased lipid droplet production in MCF10A cells (Figure 2B). It is known that insulin can trigger de novo lipogenesis in hepatocytes, whereas overload of oleic acid, a monounsaturated fatty acid, can lead to cytosolic lipid droplet accumulation and steatosis in cultured hepatoma cells [27,28]. To further delineate the effect of ERLIN2 on cytosolic lipid droplet production, we challenged non-silencing control, ERLIN2-knockdown and ERLIN2-overexpressing Huh-7 cells with insulin or oleic acid. The ERLIN2-knockdown Huh-7 cells exhibited significantly less lipid droplet accumulation, whereas the ERLIN2-overexpressing Huh-7 cells displayed markedly greater hepatic steatosis compared with control Huh-7 cells, in response to insulin stimulation or oleic acid feeding (Figure 3). The lipid droplet staining results were consistent with the biochemical quantification of cellular TG levels in the related Huh-7 cells (Supplementary Figure S2). Together, these findings support the role of ERLIN2 in de novo lipogenesis and lipid droplet production.
Figure 3. ERLIN2 regulates levels of cytosolic lipid content in human hepatoma cells in the absence or presence of metabolic signals.

(A) Western blot analysis of ERLIN2 levels in the Huh-7 stable cell line, which was transduced with non-silencing control shRNA (Ctl), knocked down by ERLIN2 shRNAi (KD) or overexpressed ERLIN2 (OE) via lentivirus. GAPDH was included as a loading control. (B) Oil Red O staining of lipid droplets in the Huh-7 stable cell line, which was transduced with non-silencing control (lenti-non-silence), ERLIN2 shRNAi (lenti-ERLIN2 shRNAi) or ERLIN2 overexpression (lenti-ERLIN2) lentivirus and treated with vehicle PBS, insulin (100 nM) or oleic acid (0.5 mM) for 12 h. Magnification is ×200. The experiments were repeated three times and representative data are shown.
ERLIN2 is associated with the activation of SREBPs in cancer cells
The ER is the organelle responsible for lipid and sterol biosynthesis. SREBP1 and SREBP2 are ER transmembrane proteins that play central roles in controlling expression of genes encoding key regulators and enzymes in de novo lipogenesis [21]. Among others, SREBP1c is inducible in liver and adipose tissue by insulin change or fasting/refeeding conditions, and it plays a critical role in nutritional regulation of lipogenic gene expression [21]. Induction of SREBP1c, but not SREBP1a or SREBP2, is evidenced in numerous primary human breast tumours and breast cancer cell lines [29]. Previous studies indicated that fatty acid synthesis and expression of lipogenic genes in breast cancer is achieved through modulation of SREBP1c, similar to its regulation in liver and adipose tissue, although the upstream regulation of lipogenesis differs in these tissues [21,29].
It has been shown that activation of SREBP is controlled by interactions involving ER-resident proteins that are regulated by metabolic signals [21]. In particular, the SREBP precursor proteins interact with ER membrane SCAP, and SCAP binds to another ER membrane protein called INSIG1 to maintain SREBPs in an inactive state [30]. In response to low sterol or insulin stimuli, INSIG1 dissociates from SCAP and is subsequently degraded through ERAD, thus allowing SREBP activation [30–32]. Because ERLIN2 is an ER lipid raft protein and has been characterized as a mediator of ERAD [13,14], we suspected that ERLIN2 might regulate lipogenesis by modulating the activation of SREBPs and/or ER-associated degradation of INSIG1. To explore this possibility, we first examined activation of SREBP1c in a mammary epithelial cell line (MCF10A) that overexpresses exogenous ERLIN2 or LacZ control. Levels of the cleaved/activated form of SREBP1c were significantly higher in the MCF10A cells overexpressing ERLIN2, compared with that of the cells overexpressing LacZ (Figure 4A). We further evaluated activation of SREBP1c in SUM44, an aggressive human breast cancer cell line in which the endogenous ERLIN2 gene is amplified and overexpressed [7] (Figure 2C). We generated SUM44 stable cell lines in which ERLIN2 was knocked down through a lentivirus-based shRNA expression system. Supporting a role for ERLIN2 in regulating SREBP activation, the levels of total cleaved SREBP1c protein were lower in the ERLIN2 knockdown SUM44 cells, compared with that in the control cells (Figure 4B). Interestingly, SREBP cleavage products in SUM44 cells appeared as multiple isoforms that might represent phosphorylated or SUMOylated forms of mature SREBP under different metabolic conditions [33,34]. Moreover, the levels of the SREBP1c precursor were also modestly lower in the ERLIN2-knockdown SUM44 cells (Figure 4B). Additionally, we examined levels of SREBP1a in the ERLIN2-knockdown or control breast cancer cells. Consistent with the previous observation that SREBP1c, but not SREBP1a or SREBP2, is induced in human breast tumours and breast cancer cell lines [29], the ERLIN2 knockdown or overexpressing breast cancer cell lines express only trace levels of SREBP1a (Supplementary Figure S3 at http://www.BiochemJ.org/bj/446/bj4460415add.htm).
Figure 4. ERLIN2 regulates activation of SREBP1c.

(A) Western blot analysis of ERLIN2 and SREBP1c levels in MCF10A cells that stably express exogenous ERLIN2 or LacZ control. Tubulin was included as a loading control. The values below the gels represent the ratios of signal intensities of mature SREBP1c to SREBP1c precursor. (B) Western blot analysis of ERLIN2, SREBP1c and tubulin levels in stable ERLIN2 knockdown SUM44 cells and control (CTL) SUM44 cells that were transduced by non-silencing shRNA. The values below the gels represent the ratios of signal intensities of mature SREBP1c to SREBP1c precursor. (C) Western blot analysis of ERLIN1, ERLIN2, SREBP1c, SREBP2 and INSIG1 protein levels in Huh-7 cells in which ERLIN1 and/or ERLIN2 were transiently knocked down. The ERLIN1 and/or ERLIN2 genes were transiently knocked down in Huh-7 cells by using ON-TARGETplus siRNA SMARTpool® reagents (Dharmacon). The Huh-7 cells transduced with non-silencing siRNA were included as the control. After 36 h, the control and knockdown cell lines were treated with PBS vehicle or insulin (100 nM) for 6 h followed by a collection of total cell lysates for Western blot analysis. The SREBP2 signal was detected by using a monoclonal antibody against a C-terminal SREBP protein fragment (BD Pharmingen). The values below the gels represent the ratios of mature SREBP1c to SREBP1c precursor, cleaved SREBP2 to tubulin, and INSIG1 to tubulin signal intensities. INS, insulin; RNAi, RNA interference; SREBP2-C, cleaved SREBP2 (C-terminal); SREBP1c-M, mature SREBP1c; SREBP1c-P, SREBP1c precursor; Veh, vehicle.
Next, we confirmed the involvement of ERLIN2 in SREBP activation by using the hepatoma cell line Huh-7. In liver hepatocytes, activation of SREBP1c is tightly controlled by feedback regulation [21]. To circumvent the potential adaptation of SREBP activation in stable ERLIN2 knockdown Huh-7 cells, we transiently knocked down ERLIN2 and/or its functional binding partner, ERLIN1, in Huh-7 cells by using ON-TARGETplus siRNA SMARTpool® reagents [35]. Transient knockdown of ERLIN2 and/or ERLIN1 significantly reduced the levels of mature SREBP1c proteins in the Huh-7 cells in the absence or presence of insulin (Figure 4C). Moreover, levels of cleaved SREBP2 proteins were also reduced in the ERLIN2 and/or ERLIN1 knockdown Huh-7 cells, compared with those in control Huh-7 cells (Figure 4C and Supplementary Figure S4 at http://www.BiochemJ.org/bj/446/bj4460415add.htm). These results suggest that ERLIN2 plays a role in regulating SREBP activation. Note that the results obtained with ERLIN1-knockdown cells suggested that ERLIN1 may also be involved in regulation of SREBP activation. Because ERLIN2 is known to dimerize with ERLIN1 to form a functional complex [5,13,14], it is possible that knockdown of ERLIN1 may destabilize ERLIN2 and thus reduce SREBP activation in cancer cells. The involvement of ERLIN1 in regulating SREBP activation needs to be further elucidated in the future. Since ERLIN2 has been proposed as a mediator of ERAD [13,14], we wondered whether ERLIN2 regulates SREBP activation by facilitating INSIG1 degradation through the ERAD mechanism. The levels of INSIG1 proteins were not significantly changed in the ERLIN1-and/or ERLIN2-knockdown cells compared with the control cells (Figure 4C). Together, our data suggest that, although expression of ERLIN2 has a marginal effect on INSIG1 degradation, ERLIN2 regulates SREBP activation in cancer cells.
To further elucidate the role of ERLIN2 in de novo lipogenesis, we used ERLIN2 knockdown and control SUM44 or Huh-7 cells to examine the expression of genes that encode key lipogenic enzymes or regulators. Quantitative real-time RT–PCR analysis indicated that expression levels of SREBP1-regulated lipogenic genes, including ACC1 (acetyl-CoA carboxylase 1) and SCD1 (stearoyl-CoA desaturase 1) and other key lipogenic genes, including DGAT (diacylglycerol O-acyltransferase) 1, DGAT2, ADRP (adipose differentiation-related protein), FIT1 (fat-inducing transcript 1), FATP2 (fatty acid transport protein 2) and FSP27 (fat-specific protein 27), were lower in ERLIN2 knockdown SUM44 and Huh-7 cells (Supplementary Figures S5A–S5C at http://www.BiochemJ.org/bj/446/bj4460415add.htm). We also examined expression of lipogenic trans-activators in ERLIN2 knockdown and control Huh-7 cells. Expression levels of the genes encoding the lipogenic trans-activators PGC [PPARγ (peroxisome-proliferator-activated receptor γ) coactivator]-1α and PGC-1β were significantly lower in ERLIN2 knockdown Huh-7 cells (Supplementary Figure 5D). Additionally, we examined expression of FAS, a key SREBP1-regulated enzyme in de novo lipogenesis. Expression levels of FAS mRNA were only marginally altered by the absence of ERLIN2 (results not shown), whereas FAS protein levels were reduced in ERLIN2 knockdown Huh-7 cells (Supplementary Figure S6 at http://www.BiochemJ.org/bj/446/bj4460415add.htm). The discrepancy in the expression patterns between the FAS mRNA and protein levels might be due to feedback regulation of the genes involved in lipid homoeostasis [21,23,24].
ERLIN2 interacts with SCAP and INSIG1
To gain further insight into the molecular basis by which ERLIN2 regulates SREBP activation, we tested whether ERLIN2 can interact with ER-resident protein factors that control SREBP activation. Through IP Western blot analysis, we first confirmed the strong interaction between ERLIN1 and ERLIN2 in Huh-7 cells (Figure 5A). We then examined potential interactions between ERLIN2 and the protein factors that regulate SREBP activation in the ER, particularly SCAP and INSIG1. Because ERLIN2, SCAP and INSIG1 are ER-resident proteins, we performed IP Western blot analyses with ER protein fractions to detect the interaction between ERLIN2, SCAP and INSIG1. IP Western blot analysis indicated that only a small portion of endogenous SCAP proteins associated with ERLIN2 in CHO (Chinese hamster ovary) cells exogenously expressing ERLIN2 and INSIG1 in the presence of insulin or LPDS challenge (Figure 5B). Moreover, we failed to detect ERLIN2 protein associated with SCAP in protein lysates pulled down by an anti-SCAP antibody (results not shown). Therefore the present study excludes the possibility of any strong or direct interaction between ERLIN2 and SCAP. Next, we evaluated the interaction between ERLIN2 and INSIG1. Because of a limitation of the anti-INSIG1 antibody in IP analysis, we expressed T7-tagged INSIG1 and V5-tagged ERLIN2 in CHO cells for IP Western blot analysis. In the absence of challenges, we detected only a nominal interaction between ERLIN2 and INSIG1 (Figure 5C). However, significant amounts of INSIG1 proteins associated with ERLIN2 were detected in the cells challenged by insulin or LPDS (Figure 5C). These results suggest a strong interaction between ERLIN2 and INSIG1 after insulin or LPDS challenge, the metabolic condition that triggers SREBP activation and de novo lipogenesis [21]. To further delineate the interaction between ERLIN2 and INSIG1, we endogenously incorporated photo-reactive amino acid analogues into the primary sequence of proteins during synthesis and then UV activated them to covalently cross-link proteins within protein–protein interaction domains in their native environment [36–38]. This powerful method enabled us to detect the intact protein interaction complex within live cells without the use of completely foreign chemicals or molecular modifiers that might adversely affect the interaction being studied [37]. Utilizing a photo-reactive amino acids kit, we incorporated photo-reactive leucine and methionine analogues into the CHO cells expressing both ERLIN2 and INSIG1. IP Western blot analysis with photo-reactive amino acid-incorporated UV cross-linked protein lysates revealed a significant amount of ERLIN2–INSIG1 binding complex formed in the CHO cells after insulin or LPDS challenge (Figure 5D).
Figure 5. ERLIN2 interacts with SCAP and INSIG1.

(A) IP Western blot analysis of the interaction between ERLIN1 and ERLIN2 in Huh-7 cells. T cell lysates from Huh-7 cells expressing exogenous ERLIN2 or LacZ were immunoprecipitated with an anti-ERLIN2 antibody (EN2) or rabbit IgG (negative control). The pulled-down proteins were subjected to immunoblotting analysis using an anti-ERLIN1 antibody. The levels of ERLIN1 in total cell lysates were included as input controls. (B) IP Western blot analysis of the interaction between ERLIN2 and SCAP. CHO cells stably expressing exogenous ERLIN2 protein with a V5 tag were transfected with a plasmid vector expressing INSIG1 protein with a T7 tag. The transfected CHO cells were treated with PBS vehicle, insulin (INS; 100 nM) for 6 h or were cultured in LPDS medium for 12 h. As a control (CTL), CHO cells stably expressing exogenous ERLIN2 protein were transfected with a plasmid vector control PGL3 and cultured in normal medium without insulin or LPDS challenge. ER protein fractions isolated from the CHO cells were immunoprecipitated with an anti-V5 antibody and then subjected to immunoblotting analysis using an anti-SCAP antibody to detect the interaction between ERLIN2 and SCAP. The levels of SCAP in total cell lysates were determined as input controls. (C) IP Western blot analysis of the interaction between ERLIN2 and INSIG1. The CHO cells, the plasmid transfection procedure, and the treatments are the same as described for (B). The ER protein fractions isolated from the CHO cells were immunoprecipitated with an anti-V5 antibody and then subjected to immunoblotting analysis using an anti-T7 antibody to detect the interaction between ERLIN2 and INSIG1. The levels of T7-tagged INSIG1 in total cell lysates were determined as input controls. (D) IP Western blot analysis of ERLIN2–INSIG1 binding complex by using a photo-reactive amino acid incorporation approach. The CHO cells, the plasmid transfection procedure, and the treatments are the same as described in (B), except that the cells were cultivated with DMEM limiting medium containing photo-reactive leucine and methionine analogues for 24 h before UV cross-linking and cell lysate collection. The photo-reactive amino acids incorporated UV cross-linked protein lysates were immunoprecipitated with an anti-V5 antibody and then subjected to immunoblotting analysis using an anti-T7 antibody to detect the ERLIN2–INSIG1 binding complex. The levels of ERLIN2 in total cell lysates were determined as input controls.
To verify whether ERLIN2 is involved in ER-associated degradation of INSIG1, we determined the levels of INSIG1 in Huh-7 cells overexpressing ERLIN1 or ERLIN2 after insulin or LPDS challenge. Consistent with our previous observation using transient ERLIN2-knockdown cells (Figure 4C), the levels of INSIG1 were marginally lower in the Huh-7 cells overexpressing ERLIN2, compared with those in cells overexpressing LacZ or ERLIN1 (Supplementary Figure S7 at http://www.BiochemJ.org/bj/446/bj4460415add.htm). Therefore ERLIN2 is not likely to play a significant role in mediating INSIG1 degradation. The interaction between ERLIN2 and INSIG1, and loosely with SCAP, might be required for efficient SREBP activation by facilitating the dissociation of the SREBP–SCAP complex from INSIG1 in cancer cells (Supplementary Figure S8 at http://www.BiochemJ.org/bj/446/bj4460415add.htm). This hypothesis needs to be further investigated in future studies.
Knockdown of ERLIN2 leads to reduced proliferation rates in cancer cells
Cancer cells, especially aggressive forms, have a high demand for lipid supplies for unlimited cell proliferation. The SREBP activities and de novo lipogenesis are functionally relevant to the cell proliferation rate [39]. Having established the role of ERLIN2 in regulating SREBP activation and lipid droplet production, we determined whether down-regulation of endogenous ERLIN2 in cancer cells affects cancer cell growth. To address this question, we examined cell proliferation rates in the human hepatoma cell line Huh-7 or the human breast cancer cell line SUM225 in which ERLIN2 had been knocked down. We observed that in the absence of ERLIN2 the Huh-7 cells or SUM225 cells displayed a significant reduction in both size and number of cell aggregates (Figures 6A and 6B). Cell growth and proliferation analyses indicated that knockdown of ERLIN2 reduced proliferation rates of Huh-7 cells and SUM225 cells (Figures 6C and 6D). After 10 days in cell culture, the proliferation rates of ERLIN2 knockdown Huh-7 cells or SUM225 cells were significantly lower than that of control cells. The reduced cancer cell proliferation rates, caused by down-regulation of ERLIN2, are consistent with the role of ERLIN2 in regulating de novo lipogenesis. This result implies that targeting ERLIN2 could be an effective therapeutic approach for aggressive cancers by down-regulating de novo lipogenesis in cancer cells.
Figure 6. Down-regulation of ERLIN2 reduces cancer cell proliferation rates.
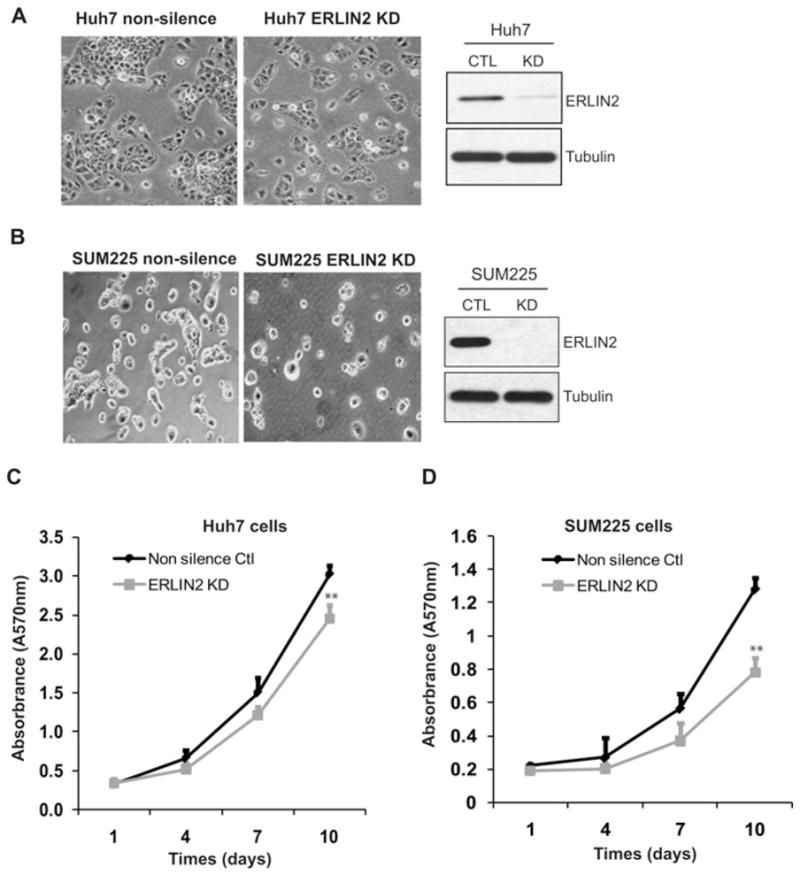
(A) Left-hand panel, morphology of ERLIN2 knockdown and control Huh-7 cells. Magnification is ×400. Right-hand panel, levels of ERLIN2 protein in knockdown (KD) and control (CTL) Huh-7 cells were determined by Western blot analysis. (B) Morphology of ERLIN2 knockdown and control SUM225 cells. Magnification is ×400. Levels of ERLIN2 protein in knockdown and control SUM225 cells were determined by Western blot analysis. (C and D) Cell proliferation assays with the stable ERLIN2 knockdown Huh-7 (C) or SUM225 (D) cells and control cells. On day 1, the same number of ERLIN2 knockdown or control cells was seeded (5000 cells per well). The cell proliferation rate at each time point was represented by a 570-nm absorbance reading determined by MTT assay. Results are means ± S.E.M. (n = 3 biological samples). **P < 0.01.
DISCUSSION
The present study provides important new information about the role and mechanism of the ER lipid raft protein factor ERLIN2 in lipid metabolism associated with tumour cell growth and malignancy maintenance. The ERLIN2 gene is amplified and overexpressed in the luminal subtype of human breast cancer that is associated with reduced metastasis-free survival rate [7–9,12]. Our work demonstrated that ERLIN2 is preferably expressed in aggressive breast cancer cell lines and in mouse fatty liver tissue, and it is inducible by insulin or LPDS-containing culture medium (Figure 1). We found that ERLIN2 modulates the activation of SREBP1c, the key regulator of lipid and cholesterol metabolism, in cancer cells (Figure 4). Consistently, cytosolic lipid droplet production, a reflection of de novo lipid/cholesterol metabolism, could be modulated by up- or down-regulation of ERLIN2 in human breast cancer cells or hepatoma cells (Figures 2 and 3). As a result of decreased lipogenesis, and other possible effects, cancer cell proliferation rates were reduced when ERLIN2 was down-regulated (Figure 6). These findings not only contribute to our understanding of the regulatory mechanism of activation of SREBPs in cancer cells, but could also inform novel therapy and pharmaceutical interventions to control cancers, especially aggressive forms.
Previously, ERLIN2 was characterized as a mediator of ERAD of activated inositol trisphosphate receptors, the key component of the ER Ca2+ -release channel, and of the cholesterol biosynthetic enzyme HMG-CoA reductase [13–15]. The ERLIN1–ERLIN2 complex interacts with the membrane-bound ubiquitin ligase GP78 and the substrate inositol trisphosphate receptors or HMG-CoA reductase, leading to polyubiquitination and subsequent degradation of these substrates. Activation of SREBPs, the key regulators of lipid and sterol biosynthesis, is regulated by the binding activities of ER-resident proteins, including INSIG1 and SCAP [21]. Because SCAP escorts SREBP from the ER to the Golgi for proteolytic processing into an active transcription factor, the binding of SCAP by INSIG1 effectively prevents SREBP activation [30]. Degradation of the INSIG1 protein through ERAD is an important process that is associated with the activation of SREBPs [31,32]. The present study showed that ERLIN2 interacts with INSIG1 and is weakly associated with SCAP after insulin signalling or LPDS culture (Figure 5). Because INSIG1 interacts with SCAP, it is possible that ERLIN2 indirectly associates with SCAP by interacting with INSIG1. We showed that ERLIN2 regulates cleavage of SREBP1c in human breast cancer cells or hepatoma cells (Figure 4). However, ERLIN2 does not likely play a significant role in degrading INSIG1, although it interacts directly with INSIG1 in response to metabolic signals (Figure 4C and Supplementary Figure S7). On the basis of these results, we propose that ERLIN2 might interact with the INSIG1–SCAP binding complex by directly binding to INSIG1 after insulin or LPDS challenge. Consequently, ERLIN2 and INSIG1 interaction facilitates the dissociation of SCAP from INSIG1, thus promoting SREBP activation and de novo lipogenesis in cancer cells (Supplementary Figure S8). The ERLIN2-mediated regulation of SREBP and thus of de novo lipogenesis might represent an important enhancing mechanism in lipid and energy metabolism that helps cancer cells gain their growth advantage.
During tumorigenesis, uncontrolled proliferation of cancer cells requires elevated de novo lipogenesis to meet the high demand for lipids and energy [2]. Shifting lipid acquisition toward de novo lipogenesis dramatically changes membrane properties and protects cells from both endogenous and exogenous insults. Our work suggests that ERLIN2, which is highly expressed in aggressive human breast cancer cells, supports malignancy by promoting de novo lipogenesis. Down-regulation of ERLIN2 can reduce cytosolic lipid droplet content and slow the proliferation rate of cancer cells. Therefore targeting ERLIN2 might reduce resistance of aggressive cancers to therapy and thus improve the effectiveness of conventional anti-cancer drugs. The present study has also raised many immediate and important questions. For example, what is the precise mechanism by which ERLIN2 regulates activation of SREBPs? Does ERLIN2 interact with other ER-resident lipogenic regulators, such as the hepatocyte-specific CREBH (cAMP responsive element binding protein) [40,41], to regulate lipid metabolism in cancer cells? Our data showed that ERLIN2 is involved in lipid droplet accumulation in the cells incubated with oleic acid (Figure 3B). Given that the oleic acid-induced response is not dependent upon de novo lipogenesis, ERLIN2 may also act on other pathways to facilitate cytosolic lipid accumulation. In the future, it will be interesting to investigate additional roles of ERLIN2 in promoting lipid accumulation. Additionally, the present study only demonstrated the regulation of SREBP activation and lipogenesis by ERLIN2 in a panel of cancer cells. Interestingly, expression of ERLIN2 was elevated in fatty liver tissues (Figure 1). Therefore, it is plausible to speculate that ERLIN2 may also regulate lipid metabolism in fatty liver disease. All of these questions merit future research in ERLIN2.
Supplementary Material
Acknowledgments
We thank Dr Steven Ethier (Medical University of South Carolina, Charleston, SC, U.S.A.) for providing human SUM breast cancer cell lines, Dr Jin Ye (University of Texas Southwestern Medical Center, Dallas, TX, U.S.A.) for providing the plasmid expressing human INSIG1, and Mr Steven Horne and Ms Batoul Abdallah for editorial assistance prior to submission.
FUNDING
This work was supported by the National Institutes of Health (NIH) [grant numbers DK090313 and ES017829 (to K.Z.)], the Department of Defense Breast Cancer Program [grant numbers BC095179P1 (to K.Z.), BC083945 (to Z.Y.) and BC095179 (to Z.Y.)] and a Karmanos Cancer Institute pilot grant (to Z.Y. and K.Z.).
Abbreviations used
- AHF
atherogenic high-fat
- BODIPY
boron dipyrromethene
- CHO
Chinese hamster ovary
- DAPI
4′, 6-diamidino-2-phenylindole
- DGAT
diacylglycerol O-acyltransferase
- DMEM
Dulbecco’s modified Eagle’s medium
- ER
endoplasmic reticulum
- ERAD
ER-associated degradation
- ERLIN2
ER membrane lipid raft-associated 2
- FAS
fatty acid synthase
- FBS
fetal bovine serum
- GAPDH
glyceraldehyde-3-phosphate dehydrogenase
- HMG-CoA
3-hydroxy-3-methylglutaryl-CoA
- INSIG1
insulin-induced gene 1
- IP
immunoprecipitation
- LPDS
lipoprotein-deficient serum
- MTT
3-(4,5-dimethylthiazol-2-yl)-2,5-diphenyl-2H-tetrazolium bromide
- NP-40
Nonidet P40
- PGC
peroxisome-proliferator-activated receptor γ coactivator
- RT
reverse transcription
- shRNA
small hairpin RNA
- SPFH
stomatin/prohibitin/flotillin/HflK/C
- SREBP
sterol regulatory element-binding protein
- SCAP
SREBP cleavage-activating protein
- TG
triglyceride
Footnotes
AUTHOR CONTRIBUTION
Kezhong Zhang, Zeng-Quan Yang and Guohui Wang designed the study; Guohui Wang, Xuebao Zhang, Jin-Sook Lee, Xiaogang Wang and Kezhong Zhang performed the experiments; Guohui Wang, Xuebao Zhang, Kezhong Zhang and Zeng-Quan Yang analysed the data; and Kezhong Zhang and Zeng-Quan Yang wrote the paper.
References
- 1.Luo J, Solimini NL, Elledge SJ. Principles of cancer therapy: oncogene and non-oncogene addiction. Cell. 2009;136:823–837. doi: 10.1016/j.cell.2009.02.024. [DOI] [PMC free article] [PubMed] [Google Scholar]
- 2.Hilvo M, Denkert C, Lehtinen L, Muller B, Brockmoller S, Seppanen-Laakso T, Budczies J, Bucher E, Yetukuri L, Castillo S, et al. Novel theranostic opportunities offered by characterization of altered membrane lipid metabolism in breast cancer progression. Cancer Res. 2011;71:3236–3245. doi: 10.1158/0008-5472.CAN-10-3894. [DOI] [PubMed] [Google Scholar]
- 3.Brown DA. Lipid droplets: proteins floating on a pool of fat. Curr Biol. 2001;11:R446–R449. doi: 10.1016/s0960-9822(01)00257-3. [DOI] [PubMed] [Google Scholar]
- 4.Menendez JA, Lupu R. Fatty acid synthase and the lipogenic phenotype in cancer pathogenesis. Nat Rev Cancer. 2007;7:763–777. doi: 10.1038/nrc2222. [DOI] [PubMed] [Google Scholar]
- 5.Browman DT, Resek ME, Zajchowski LD, Robbins SM. Erlin-1 and erlin-2 are novel members of the prohibitin family of proteins that define lipid-raft-like domains of the ER. J Cell Sci. 2006;119:3149–3160. doi: 10.1242/jcs.03060. [DOI] [PubMed] [Google Scholar]
- 6.Staaf J, Jonsson G, Ringner M, Vallon-Christersson J, Grabau D, Arason A, Gunnarsson H, Agnarsson BA, Malmstrom PO, Johannsson OT, et al. High-resolution genomic and expression analyses of copy number alterations in HER2-amplified breast cancer. Breast Cancer Res. 2010;12:R25. doi: 10.1186/bcr2568. [DOI] [PMC free article] [PubMed] [Google Scholar]
- 7.Yang ZQ, Streicher KL, Ray ME, Abrams J, Ethier SP. Multiple interacting oncogenes on the 8p11-p12 amplicon in human breast cancer. Cancer Res. 2006;66:11632–11643. doi: 10.1158/0008-5472.CAN-06-2946. [DOI] [PubMed] [Google Scholar]
- 8.Gelsi-Boyer V, Orsetti B, Cervera N, Finetti P, Sircoulomb F, Rouge C, Lasorsa L, Letessier A, Ginestier C, Monville F, et al. Comprehensive profiling of 8p11-12 amplification in breast cancer. Mol Cancer Res. 2005;3:655–667. doi: 10.1158/1541-7786.MCR-05-0128. [DOI] [PubMed] [Google Scholar]
- 9.Garcia MJ, Pole JC, Chin SF, Teschendorff A, Naderi A, Ozdag H, Vias M, Kranjac T, Subkhankulova T, Paish C, et al. A 1 Mb minimal amplicon at 8p11-12 in breast cancer identifies new candidate oncogenes. Oncogene. 2005;24:5235–5245. doi: 10.1038/sj.onc.1208741. [DOI] [PubMed] [Google Scholar]
- 10.Holland DG, Burleigh A, Git A, Goldgraben MA, Perez-Mancera PA, Chin SF, Hurtado A, Bruna A, Ali HR, Greenwood W, et al. ZNF703 is a common Luminal B breast cancer oncogene that differentially regulates luminal and basal progenitors in human mammary epithelium. EMBO Mol Med. 2011;3:167–180. doi: 10.1002/emmm.201100122. [DOI] [PMC free article] [PubMed] [Google Scholar]
- 11.Sircoulomb F, Nicolas N, Ferrari A, Finetti P, Bekhouche I, Rousselet E, Lonigro A, Adelaide J, Baudelet E, Esteyries S, et al. ZNF703 gene amplification at 8p12 specifies luminal B breast cancer. EMBO Mol Med. 2011;3:153–166. doi: 10.1002/emmm.201100121. [DOI] [PMC free article] [PubMed] [Google Scholar]
- 12.Yang ZQ, Liu G, Bollig-Fischer A, Giroux CN, Ethier SP. Transforming properties of 8p11-12 amplified genes in human breast cancer. Cancer Res. 2010;70:8487–8497. doi: 10.1158/0008-5472.CAN-10-1013. [DOI] [PMC free article] [PubMed] [Google Scholar]
- 13.Pearce MM, Wang Y, Kelley GG, Wojcikiewicz RJ. SPFH2 mediates the endoplasmic reticulum-associated degradation of inositol 1,4,5-trisphosphate receptors and other substrates in mammalian cells. J Biol Chem. 2007;282:20104–20115. doi: 10.1074/jbc.M701862200. [DOI] [PubMed] [Google Scholar]
- 14.Pearce MM, Wormer DB, Wilkens S, Wojcikiewicz RJ. An endoplasmic reticulum (ER) membrane complex composed of SPFH1 and SPFH2 mediates the ER-associated degradation of inositol 1,4,5-trisphosphate receptors. J Biol Chem. 2009;284:10433–10445. doi: 10.1074/jbc.M809801200. [DOI] [PMC free article] [PubMed] [Google Scholar]
- 15.Jo Y, Sguigna PV, DeBose-Boyd RA. Membrane-associated ubiquitin ligase complex containing gp78 mediates sterol-accelerated degradation of 3-hydroxy-3-methylglutaryl-coenzyme A reductase. J Biol Chem. 2011;286:15022–15031. doi: 10.1074/jbc.M110.211326. [DOI] [PMC free article] [PubMed] [Google Scholar]
- 16.Lee JN, Gong Y, Zhang X, Ye J. Proteasomal degradation of ubiquitinated Insig proteins is determined by serine residues flanking ubiquitinated lysines. Proc Natl Acad Sci USA. 2006;103:4958–4963. doi: 10.1073/pnas.0600422103. [DOI] [PMC free article] [PubMed] [Google Scholar]
- 17.Ethier SP, Mahacek ML, Gullick WJ, Frank TS, Weber BL. Differential isolation of normal luminal mammary epithelial cells and breast cancer cells from primary and metastatic sites using selective media. Cancer Res. 1993;53:627–635. [PubMed] [Google Scholar]
- 18.Forozan F, Veldman R, Ammerman CA, Parsa NZ, Kallioniemi A, Kallioniemi OP, Ethier SP. Molecular cytogenetic analysis of 11 new breast cancer cell lines. Br J Cancer. 1999;81:1328–1334. doi: 10.1038/sj.bjc.6695007. [DOI] [PMC free article] [PubMed] [Google Scholar]
- 19.Nakabayashi H, Taketa K, Miyano K, Yamane T, Sato J. Growth of human hepatoma cells lines with differentiated functions in chemically defined medium. Cancer Res. 1982;42:3858–3863. [PubMed] [Google Scholar]
- 20.Laing S, Wang G, Briazova T, Zhang C, Wang A, Zheng Z, Gow A, Chen AF, Rajagopalan S, Chen LC, et al. Airborne particulate matter selectively activates endoplasmic reticulum stress response in the lung and liver tissues. Am J Physiol Cell Physiol. 2010;299:C736–C749. doi: 10.1152/ajpcell.00529.2009. [DOI] [PMC free article] [PubMed] [Google Scholar]
- 21.Horton JD, Goldstein JL, Brown MS. SREBPs: activators of the complete program of cholesterol and fatty acid synthesis in the liver. J Clin Invest. 2002;109:1125–1131. doi: 10.1172/JCI15593. [DOI] [PMC free article] [PubMed] [Google Scholar]
- 22.Tian Q, Stepaniants SB, Mao M, Weng L, Feetham MC, Doyle MJ, Yi EC, Dai H, Thorsson V, Eng J, et al. Integrated genomic and proteomic analyses of gene expression in mammalian cells. Mol Cell Proteomics. 2004;3:960–969. doi: 10.1074/mcp.M400055-MCP200. [DOI] [PubMed] [Google Scholar]
- 23.Lee JS, Mendez R, Heng HH, Yang ZQ, Zhang K. Pharmacological ER stress promotes hepatic lipogenesis and lipid droplet formation. Am J Transl Res. 2012;4:102–113. [PMC free article] [PubMed] [Google Scholar]
- 24.Lee JS, Zheng Z, Mendez R, Ha SW, Xie Y, Zhang K. Pharmacologic ER stress induces non-alcoholic steatohepatitis in an animal model. Toxicol Lett. 2012;211:29–38. doi: 10.1016/j.toxlet.2012.02.017. [DOI] [PMC free article] [PubMed] [Google Scholar]
- 25.Paigen B, Morrow A, Holmes PA, Mitchell D, Williams RA. Quantitative assessment of atherosclerotic lesions in mice. Atherosclerosis. 1987;68:231–240. doi: 10.1016/0021-9150(87)90202-4. [DOI] [PubMed] [Google Scholar]
- 26.Matsuzawa N, Takamura T, Kurita S, Misu H, Ota T, Ando H, Yokoyama M, Honda M, Zen Y, Nakanuma Y, et al. Lipid-induced oxidative stress causes steatohepatitis in mice fed an atherogenic diet. Hepatology. 2007;46:1392–1403. doi: 10.1002/hep.21874. [DOI] [PubMed] [Google Scholar]
- 27.Wong RH, Sul HS. Insulin signaling in fatty acid and fat synthesis: a transcriptional perspective. Curr Opin Pharmacol. 2010;10:684–691. doi: 10.1016/j.coph.2010.08.004. [DOI] [PMC free article] [PubMed] [Google Scholar]
- 28.Ricchi M, Odoardi MR, Carulli L, Anzivino C, Ballestri S, Pinetti A, Fantoni LI, Marra F, Bertolotti M, Banni S, et al. Differential effect of oleic and palmitic acid on lipid accumulation and apoptosis in cultured hepatocytes. J Gastroenterol Hepatol. 2009;24:830–840. doi: 10.1111/j.1440-1746.2008.05733.x. [DOI] [PubMed] [Google Scholar]
- 29.Yang YA, Morin PJ, Han WF, Chen T, Bornman DM, Gabrielson EW, Pizer ES. Regulation of fatty acid synthase expression in breast cancer by sterol regulatory element binding protein-1c. Exp Cell Res. 2003;282:132–137. doi: 10.1016/s0014-4827(02)00023-x. [DOI] [PubMed] [Google Scholar]
- 30.Yang T, Espenshade PJ, Wright ME, Yabe D, Gong Y, Aebersold R, Goldstein JL, Brown MS. Crucial step in cholesterol homeostasis: sterols promote binding of SCAP to INSIG-1, a membrane protein that facilitates retention of SREBPs in ER. Cell. 2002;110:489–500. doi: 10.1016/s0092-8674(02)00872-3. [DOI] [PubMed] [Google Scholar]
- 31.Lee JN, Ye J. Proteolytic activation of sterol regulatory element-binding protein induced by cellular stress through depletion of Insig-1. J Biol Chem. 2004;279:45257–45265. doi: 10.1074/jbc.M408235200. [DOI] [PubMed] [Google Scholar]
- 32.Gong Y, Lee JN, Lee PC, Goldstein JL, Brown MS, Ye J. Sterol-regulated ubiquitination and degradation of Insig-1 creates a convergent mechanism for feedback control of cholesterol synthesis and uptake. Cell Metab. 2006;3:15–24. doi: 10.1016/j.cmet.2005.11.014. [DOI] [PubMed] [Google Scholar]
- 33.Kotzka J, Lehr S, Roth G, Avci H, Knebel B, Muller-Wieland D. Insulin-activated Erk-mitogen-activated protein kinases phosphorylate sterol regulatory element-binding Protein-2 at serine residues 432 and 455 in vivo. J Biol Chem. 2004;279:22404–22411. doi: 10.1074/jbc.M401198200. [DOI] [PubMed] [Google Scholar]
- 34.Hirano Y, Murata S, Tanaka K, Shimizu M, Sato R. Sterol regulatory element-binding proteins are negatively regulated through SUMO-1 modification independent of the ubiquitin/26 S proteasome pathway. J Biol Chem. 2003;278:16809–16819. doi: 10.1074/jbc.M212448200. [DOI] [PubMed] [Google Scholar]
- 35.Birmingham A, Anderson EM, Reynolds A, Ilsley-Tyree D, Leake D, Fedorov Y, Baskerville S, Maksimova E, Robinson K, Karpilow J, et al. 3′ UTR seed matches, but not overall identity, are associated with RNAi off-targets. Nat Methods. 2006;3:199–204. doi: 10.1038/nmeth854. [DOI] [PubMed] [Google Scholar]
- 36.Jumper CC, Schriemer DC. Mass spectrometry of laser-initiated carbene reactions for protein topographic analysis. Anal Chem. 2011;83:2913–2920. doi: 10.1021/ac102655f. [DOI] [PubMed] [Google Scholar]
- 37.Suchanek M, Radzikowska A, Thiele C. Photo-leucine and photo-methionine allow identification of protein–protein interactions in living cells. Nat Methods. 2005;2:261–267. doi: 10.1038/nmeth752. [DOI] [PubMed] [Google Scholar]
- 38.Vila-Perello M, Pratt MR, Tulin F, Muir TW. Covalent capture of phospho-dependent protein oligomerization by site-specific incorporation of a diazirine photo-cross-linker. J Am Chem Soc. 2007;129:8068–8069. doi: 10.1021/ja072013j. [DOI] [PMC free article] [PubMed] [Google Scholar]
- 39.Sherr CJ. The Pezcoller lecture: cancer cell cycles revisited. Cancer Res. 2000;60:3689–3695. [PubMed] [Google Scholar]
- 40.Zhang K, Shen X, Wu J, Sakaki K, Saunders T, Rutkowski DT, Back SH, Kaufman RJ. Endoplasmic reticulum stress activates cleavage of CREBH to induce a systemic inflammatory response. Cell. 2006;124:587–599. doi: 10.1016/j.cell.2005.11.040. [DOI] [PubMed] [Google Scholar]
- 41.Zhang C, Wang G, Zheng Z, Maddipati KR, Zhang X, Dyson G, Williams P, Duncan SA, Kaufman RJ, Zhang K. Endoplasmic reticulum-tethered transcription factor cAMP responsive element-binding protein, hepatocyte specific, regulates hepatic lipogenesis, fatty acid oxidation, and lipolysis upon metabolic stress in mice. Hepatology. 2012;55:1070–1082. doi: 10.1002/hep.24783. [DOI] [PMC free article] [PubMed] [Google Scholar]
Associated Data
This section collects any data citations, data availability statements, or supplementary materials included in this article.