Abstract
Non-invasive cardiovascular imaging initially focused on heart structures, allowing the visualization of their motion and inferring its functional status from it. Colour-Doppler and cardiac magnetic resonance (CMR) have allowed a visual approach to intracardiac flow behaviour, as well as measuring its velocity at single selected spots. Recently, the application of new technologies to medical use and, particularly, to cardiology has allowed, through different algorithms in CMR and applications of ultrasound-related techniques, the description and analysis of flow behaviour in all points and directions of the selected region, creating the opportunity to incorporate new data reflecting cardiac performance to cardiovascular imaging. The following review provides an overview of the currently available imaging techniques that enable flow visualization, as well as its present and future applications based on the available literature and on-going works.
Keywords: Intracardiac flow, Flow mapping, Multimodality imaging, Vortex flow
Introduction
In the last few years, we have witnessed a growing interest in understanding flow behaviour inside cardiac chambers. This has become possible due to the wake of new technologies that have expanded our options in cardiovascular imaging to include the chance to visualize and analyse the complex flow distribution inside the heart and to use its potential to the diagnosis of cardiac function. With this whole new perspective come new concepts and technologies of which this article provides a general overview.
Understanding intracardiac flow: the role of vortices
Although there have been numerous attempts to accurately describe myocardial fibre architecture, its precise distribution remains to be elucidated. However, fibre orientation and function has been described to be a major determinant of blood flow orientation in cardiac chambers,1 therefore, playing an essential role in cardiac performance.2 This distribution generates marked changes of blood flow direction and magnitude when passing through the atria and ventricles. Kilner et al.3 used multi-slice cardiac magnetic resonance (CMR) to illustrate the asymmetries and direction changes of flow through the heart chambers resulting in a redirection of the momentum of blood flow towards the next cavity. One of these changes in flow motion is the appearance of vortices, regions of accumulated vorticity, a property of a fluid particle based on its local angular velocity that describes its tendency to rotate. A vortex is, therefore, a circular or elliptical-shaped rotating mass of fluid spinning around a virtual central axis.
Vortices form as follows: when blood flows through a tubular structure, fluid layers at the centre of the jet move faster than those adjacent to the containing boundaries due to friction (Figure 1A). When boundaries disappear or abruptly expand, this friction-generated shear stress generates a swirling tendency of the peripheral layers of fluid to spin away from the central jet (Figure 1B). This generation of vorticity can organize in compact regions as vortices, a situation given in cardiac chambers. A clear example is the vortex ring that forms along the tips of the mitral leaflets which, seen in a two-dimensional (2D) plane, shows a stronger anterior component and a weaker posterior one (Figure 1C).3
Figure 1.
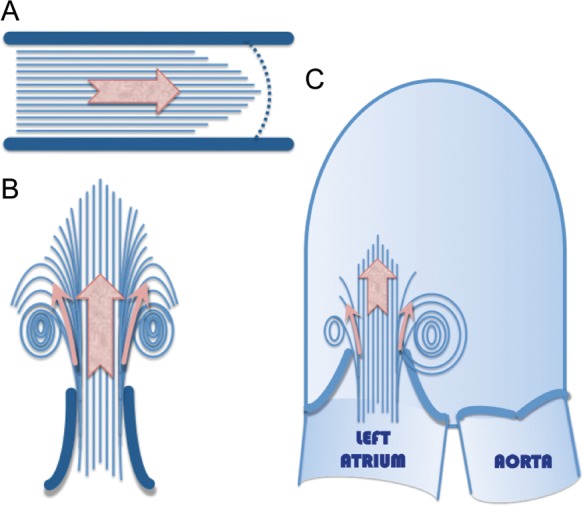
A fluid moving inside a straight vessel presents higher velocities in its centre and slower in the external fluid layers due to friction (A). The difference in flow velocity generates a tendency of the fluid to spin away from the central jet that causes swirling flow motion when the limiting boundaries expand (B). This situation appears in cardiac chambers when the filling inflow passes through the atrio-ventricular valve into the ventricle, where this swirling tendency organizes in vortices (C).
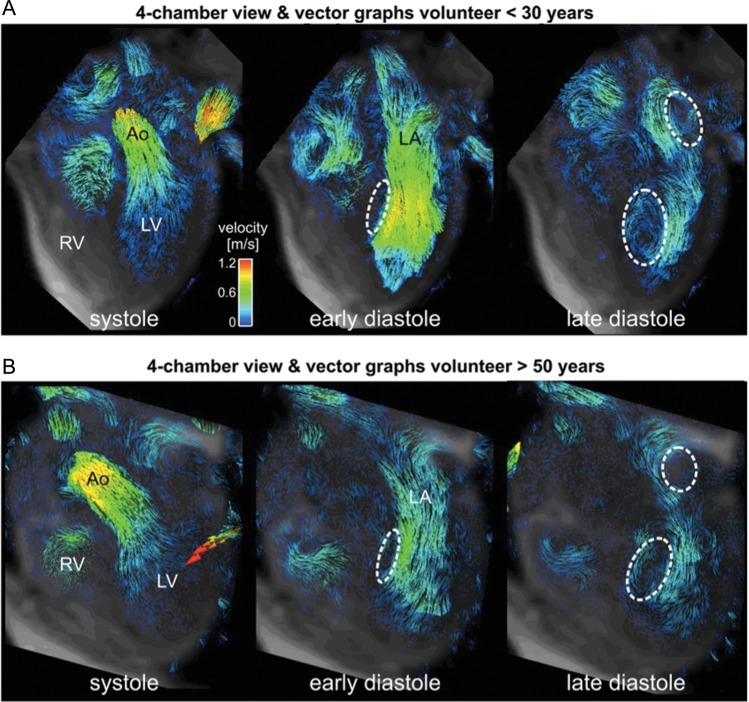
It is assumed that vortices play an important role in normal cardiac function, keeping blood in motion inside cardiac chambers, preserving momentum, avoiding excessive dissipation of energy, facilitating inflow into the ventricle, and redirecting it towards the aortic valve.3,4 These flow patterns in the left heart have shown differences related to age, gender, blood pressure, and ventricular geometry, as shown in Figure 2.5
Figure 2.
Vector graph visualization of intracardiac blood flow in a young (A) and an old (B) healthy volunteer. The formation of diastolic vortex flow in the LA and LV is indicated by the dashed circles. Note the reduced diastolic in-flow velocities (colour coding) and less prominent vortex flow in the older volunteer. LA, left atrium; RV, right ventricle; Ao, aorta.
Recent studies have pointed to a single parameter defining key aspects of vortex development, vortex formation time (VFT), as a strong index of cardiac health6 and effective fluid transport.7 VFT, a dimensionless parameter expressing the duration of early diastole and, hence, reflecting the quality of ventricular filling, is correlated with transmitral thrust and mitral annulus recoil, and is, therefore, considered to be a powerful tool to assess diastolic performance.8–10 The VFT index has already demonstrated its applicability in detecting alterations in transmitral flow efficiency and relation to prognosis of heart failure patients.11
Visualizing intracardiac flow: available techniques
Studying intracardiac flow has been possible with the development and application of new techniques. Overcoming significant technical challenges, CMR- and echocardiography-based applications have started to show its potential for research and clinical applications (Table 1).
Table 1.
Summary of technical characteristics
| Echo-PIV | VFM | CMR | |
|---|---|---|---|
| Data source | Echocardiographic tracking of groups of contrast agent particles | Calculation of laminar and vortical flow components from Colour-Doppler | Influence of flow motion on MR-signal phase: phase contrast |
| Main advantages |
|
|
|
| Limitations |
|
|
|
|
|
||
| Sources of error |
|
|
|
| Accuracy | |||
| High velocities | Limited: affected by frame rate (upper limit of ∼60 cm/s) | Accurate visualization. May require adjustment of Nyquist limit or manual de-aliasing | Accurate visualization, although selectable velocity sensitivity (venc) requires some prior knowledge of the expected velocity values |
| Low velocities | Accurate visualization | Underestimation. Nyquist limit adjustment and focus on smaller areas may improve the detection but introduces noise through the detection of cardiac wall motion | |
Flow visualization through echocardiographic imaging
The low cost, wide availability and possibility to perform real time evaluation of flow motion with relatively short post-processing times has fostered the development of ultrasound-based flow visualization techniques and drives the current efforts to explore its clinical relevance and applicability. Several initiatives have emerged to overcome the limitations inherent to conventional ultrasound techniques in potentially visualizing flow motion. However, several challenges remain unresolved, such as technical limitations in the accurate detection of all flow velocities present in cardiac chambers, due to a 2D visualization of three-dimensional (3D) flow, although approaches to a 3D echo-based flow visualization have been reported.12,13 With regard to the latter, CMR has been used as the standard for in vivo comparison, but the potential inaccuracies when comparing instantaneous with averaged flow are a matter of concern.14,15
Echocardiographic particle image velocimetry
Echocardiographic particle image velocimetry (Echo-PIV) is based on the use of ultrasound tracking groups of contrast agent particles. Motion patterns are detected through a frame-by-frame analysis of the distribution of contrast particles throughout the analysed region, which generates data on flow direction and velocity. Echo-PIV has proved to accurately reproduce intracardiac flow behaviour both in vitro and in vivo in various clinical settings.12,13 However, limitations on the detection of high velocities due to the need for very high frame rates, not achievable with currently available ultrasound devices, have hindered its further development and potential clinical applicability.
Vector flow mapping
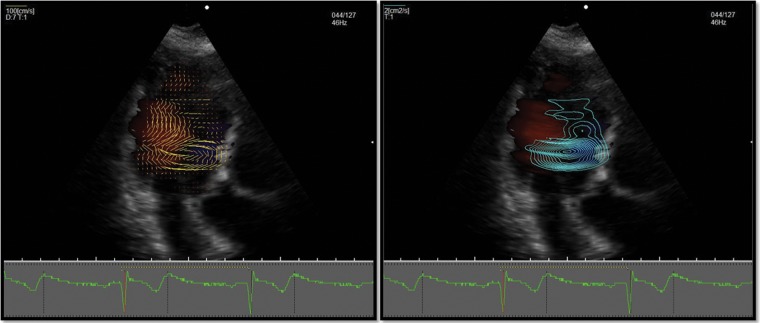
Vector flow mapping (VFM), based on colour-Doppler data, solves the obstacle of angle-dependency through mathematical calculations based on echo-dynamography. This consists of a series of equations aimed at converting a 2D distribution of measured axial velocities (parallel to the ultrasound beam) and estimated radial velocities (perpendicular to the former ones) into a plane of vortical and non-vortical flow vectors.16 The application of specific functions to infer flow velocity vectors includes two main assumptions: first, that flow along each scan radius is laminar, and, therefore, can be decomposed into vortical and non-vortical components; secondly, that through-plane flow is minor or non-existent. In spite of these two important assumptions, VFM has proved to be a reasonably accurate tool for depicting and measuring in vitro generated flow structures.17 An example of the flow and vortex visualization is provided in Figure 3. Current efforts in the development of VFM algorithm are aimed at enabling 3D flow characterization. Additional limitations such as time and spatial resolution and optimal Nyquist limit adjustment to avoid aliasing without missing relevant low-velocity flow data come from its Doppler-based character.
Figure 3.
VFM provides two main visualization modes: (i) On the left, vector display shows the direction and intensity of flow velocity in each point of the scanned area through yellow arrows proportional in length to flow velocity. (ii) On the right, vortex visualization mode displays round lines indicating the presence of a vortex, with higher line density corresponding to areas of more intense flow. Both vector and vortex scale and density can be adjusted by the user.
Combination of colour-Doppler data with speckle tracking
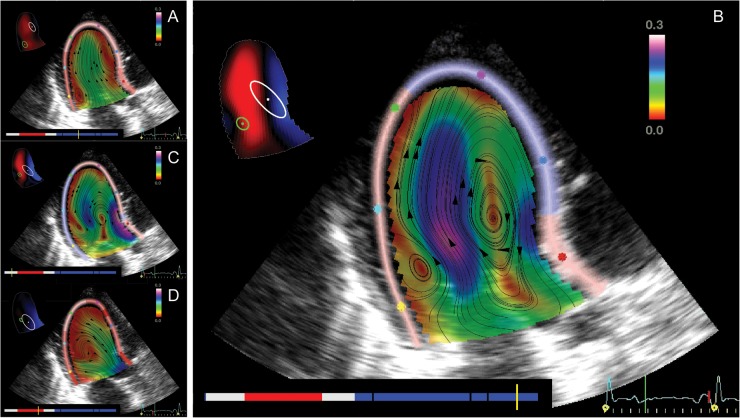
Combination of colour-Doppler data with speckle tracking complemented by applying the continuity equation to yield cross-beam velocity information has also been successful in depicting intraventricular vortex flow behaviour,18 as shown in Figure 4. The limitations of this technique include those inherent to Doppler and speckle tracking, as well as the ones previously mentioned affecting echocardiographic flow visualization tools. By neglecting through-plane information, this technique has calculated to miss ∼15% of flow when compared with CMR.
Figure 4.
Through a combination of strain and speckle tracking, flow visualization as developed by Bermejo et al. provides a visualization where streamlines represent velocity direction; colour bar represents codification of velocity values. A schematic figure with vortex cores location can be seen on the upper left corner: clockwise vortex (in white) and counter-clockwise vortex (in green). The bottom-left colour bar indicates the phase of the cardiac cycle [red: ejection; blue: filling; white: isovolumic periods; during filling black marks indicate (left-to-right) the instants of peak-E wave velocity, A-wave onset, and peak-A wave velocity].
Flow visualization through magnetic resonance imaging
The intrinsic motion sensitivity of MRI can be used to image vessels with flow-sensitive CMR techniques, also termed phase contrast (PC) MR angiography, or to directly acquire and quantify blood flow in the major vessels or inside the heart chambers.19
Flow-sensitive 2D CMR
The basic principle of PC-CMR relies on the intrinsic sensitivity of the MR signal to motion. PC-CMR is most frequently applied in its basic form using PC data acquired in a 2D imaging plane positioned at a user-selected location. The MR-signal phase in this 2D imaging plane is directly affected by blood flow, which can be used to spatially and temporally measure blood flow velocity along flexibly selectable encoding directions. To measure and analyse pulsatile blood flow, data acquisition is synchronized with the cardiac cycle using the ECG signal. This gating allows for the reconstruction of images representing anatomy and flow over the duration of a heartbeat (also termed CINE imaging). Two-dimensional CINE PC-CMR in the thoracic region is typically performed during a breath-hold that potentially limits spatial and/or temporal resolution.
Two-dimensional CINE PC-CMR methods require appropriate control of flow encoding sensitivities, a user-controlled variable referred to as velocity sensitivity (venc), which represents the maximum velocity that can be encoded. Thus, accurate flow quantification requires some prior knowledge of the expected peak blood flow velocities to prevent the appearance of aliasing. The acquired 2D CINE PC-CMR data can be used for flow quantification as illustrated in Figure 5, enabling the calculation of flow-time curves, net flow, mean velocities, peak velocities, and retrograde fraction.
Figure 5.
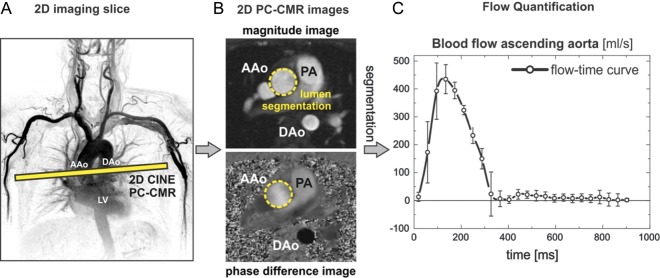
(A) Blood flow quantification in the aorta using a 2D CINE PC-CMR acquisition placed immediately distal to the aortic valve plane and encoded for through-plane velocities. (B) After data acquisition and reconstruction of magnitude and phase difference images, the vessel contours of the AAo are identified by lumen segmentation to quantify time-resolved blood flow. (C) Flow-time curves in the ascending aorta above the aortic valve averaged over 10 normal healthy subjects (error bars = inter-individual variation of blood flow). AAo, ascending aorta; PA, pulmonary artery; DAo, descending aorta.
Four-dimensional flow CMR
The combination of 3D spatial encoding and PC-CMR offers the possibility of isotropic high spatial resolution and thus the ability to measure and visualize the temporal evolution of complex flow and motion patterns in a 3D volume. In this context, ECG synchronized 3D PC CMR using three-directional velocity encoding (also termed ‘4D flow MRI’) can be employed to visualize and quantify 3D blood flow characteristics in the heart and vessels.20,21 A number of recent methodological improvements (parallel imaging, adaptive respiration control with increased efficiency, etc.) permit the acquisition of 4D flow CMR data with full-volumetric coverage of the heart within reasonable scan times of the order of 8–15 min.22,23 Given the exam duration, systems allowing monitoring of breathing pattern in parallel to the data acquisition have been developed.
To visualize complex, three-directional blood flow within a 3D volume, various visualization tools, including 2D vector-fields, 3D streamlines, and time-resolved 3D particle traces have been proposed.24,25 It is also possible to retrospectively quantify blood flow velocities and volumes at user-selected locations of interest within the 3D volume. In addition to the previously mentioned flow measurement parameters, more advanced quantification methods and algorithms have been presented in the literature. These include the derivation of wall shear stress, pulse wave velocity, pressure difference, or turbulent kinetic energy.26–30
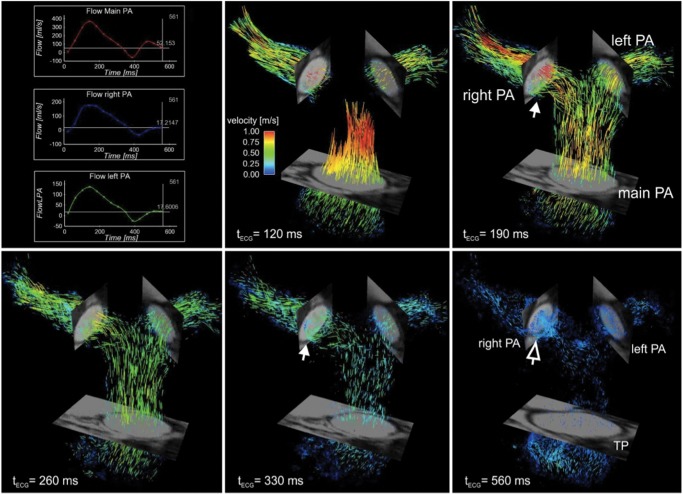
Figures 6 and 7 illustrate the use of 4D flow CMR for the visualization and quantification of 3D blood flow in the heart and pulmonary system, respectively.
Figure 6.

Four-dimensional flow MRI and visualization of 3D flow. (A) Four-dimensional flow MRI raw data comprises information along all three spatial dimension, three velocity directions (vx,vy,vz), and time spanning the cardiac cycle. (B) Co-registered four-chamber CINE images and 3D flow visualization in the atrium and ventricle during mitral in-flow.
Figure 7.
Three-dimensional blood flow visualization in the pulmonary system based on time-resolved 3D pathlines in a normal volunteer. Systolic pulmonary outflow with high blood flow velocities (red colour) is followed by lower diastolic flow with mild helix flow (solid white arrows) and mild retrograde flow (open white arrow) in the right pulmonary artery. Top left: retrospective flow quantification was employed to calculate flow-time curves in the main, right, and left pulmonary artery. PA, pulmonary artery.
One of the main limitations associated with CMR flow visualization comes from the fact that the information is generated from averaged flow values over several cardiac cycles. Other limitations are related to the several effects that can introduce imperfection in the resulting PC-CMR data, which cause errors in velocity measurements. Major sources of inaccuracy in velocity-encoded images include eddy current effects, Maxwell terms, and gradient field distortions. If uncorrected, all three effects can severely distort the measured three-directional velocities and thus result in distortion of 3D streamlines and 3D particle traces, which might lead to incorrect flow pattern visualization and, subsequently, to false conclusions regarding flow characteristics. It is important to keep in mind that such phase offset errors exhibit a substantial and non-linear increase with increasing distance from the iso-centre of the MR system.
Defining flow study: regions and parameters
So far, the study of intracardiac flow behaviour has aimed at providing a better understanding of both physiological and pathological situations, as well as to explore potential new tools to better diagnose clinical entities and optimize their treatment. Many of these studies are still hindered by the ongoing development of visualization techniques, reduced number of patients, and uncertainty about the real significance of measured parameters. However, some have already provided interesting results (Table 2).
Table 2.
Flow measurement: correlation to clinical and echocardiographic indices
| Region | Measured parameter | Correlation | Technique |
|---|---|---|---|
| Left ventricle | Vortex size
|
Decreased LV systolic function | Echo-PIV, VFM |
Vortex intensity
|
|
Echo-PIV, VFM | |
Vortex location
|
LV systolic dysfunction | VFM | |
| Right ventricle | Blood residence time Differential regional function |
RV systolic function RV function in pulmonary hypertension |
CMR, 3D-echo |
| Left atrium | Vortex formation | Prevention of blood stasis | CMR |
| Valve disease | Cross-flow quantification | Solid correlations with haemodynamic or imaging gold standards | CMR, VFM |
| Atrial septal defects | |||
| Aortic coarctation |
Left ventricle vortex flow and its relation with systolic and diastolic function
LV has, by far, been the cardiac region to serve as a reference for the development of these techniques, from a silicon LV replica31 to the most of the published work related to clinical entities. Studied parameters can be grouped as related to vortex size, intensity, and position:
Vortex size: regardless of the variations among different studies, vortex size or shape (depth, length, width, area, and sphericity index) seem to be associated with LV systolic function,32 even more in specific moments of cardiac cycle, such as isovolumetric contraction.33
Vortex flow intensity: measured as relative strength, pulsation correlation, maximum circulating flow or delay in acquiring its maximum energy vortex intensity has been associated with both systolic and diastolic dysfunction, wider QRS complexes, and larger end-systolic longitudinal diameters.32–34
Vortex position: a persistent apical vortex during ejection has been associated with LV systolic dysfunction.35 Other studies have shown that the incidence, location, and extent of vortex flow inside the LV were markedly altered in patients with dilated cardiomyopathy.5,36
LV vortices' presumed role in energy preservation seems to be related to a combination of their location, size, and intensity. As previously mentioned, VFT provides a good basis for analysing the generation of vortices and how this influences its haemodynamic significance. However, direct visualization and quantification techniques seem to provide a whole different range of parameters that may also determine different aspects of cardiac performance. In addition, other determinants of flow patterns inside the LV non-vortex related, such as a direct flow within the LV from the left atrium through the aortic valve, has shown to be decreased in patients compared with healthy volunteers.37
Right ventricular flow
Advances in the study of right ventricular (RV) 3D flow have been made lately, showing a relation between RV ejection fraction and blood residence time in it.38
Assessment of cross-orifice flow
Flow visualization techniques open new options to quantify flow across regurgitant, stenotic or artificial valves,21,39–41 atrial septal defects, or aortic coarctation42–45 with reasonable accuracy. Recent studies have shown that 4D flow MRI can provide new insights into the impact of aortic valve disease on changes in aortic haemodynamics such as significant changes in wall shear stress associated with bicuspid aortic valves.46
Other
Applications include the detection of areas of potential thrombus formation due to slow or stagnant flow,47 left atrial flow,15,48 or changes in flow motion in paced rhythms.49 Several groups have reported advances in the analysis of blood flow through artificial valves, blood flow characteristics in the thoracic aorta,50,51 peripheral vessels,52 carotid arteries,53 large intracranial arteries,54 as well as flow in the pulmonary and venous systems.55
Conclusions
A series of technical advances have opened the possibility to visualize and analyse intracardiac blood motion, generating new options to investigate flow patterns that provide additional information to the functional status of the heart. One of the main determinants of intracardiac flow is vortex behaviour, which has already shown to be associated with optimal cardiac performance.
Results from initial studies already demonstrate the potential of these techniques to detect pathologically altered flow characteristics and identify new patho-mechanisms for the development of cardiac and vascular disease. Ongoing improvements in the accuracy and feasibility of the available techniques together with a growing knowledge on the main determinants of blood flow in the cardiovascular system should lead us to finding the right parameters to incorporate to our current range of diagnostic tools.
Funding
M.M. is supported by NIH NHLBI (grant R01HL115828), American Heart Association (grant-in-aid 12GRNT12080032), NUCATS Institute NIH (grant UL1RR025741), and the Northwestern Memorial Foundation Dixon Translational Research Grants Initiative. A.B. is supported by the American Heart Association Scientist Development (grant 13SDG14360004).
Conflict of interest: none declared.
References
- 1.Sengupta PP, Korinek J, Belohlavek M, Narula J, Vannan MA, Jahangir A, et al. Left ventricular structure and function: basic science for cardiac imaging. J Am Coll Cardiol. 2006;10:1988–2001. doi: 10.1016/j.jacc.2006.08.030. [DOI] [PubMed] [Google Scholar]
- 2.Grosberg A, Gharib M, Kheradvar A. Effect of fiber geometry on pulsatile pumping and energy expenditure. Bull Math Biol. 2009;71:1580–98. doi: 10.1007/s11538-009-9414-x. [DOI] [PubMed] [Google Scholar]
- 3.Kilner PJ, Yang GZ, Wilkes AJ, Mohiaddin RH, Firmin DN, Yacoub MH. Asymmetric redirection of flow through the heart. Nature. 2000;404:759–61. doi: 10.1038/35008075. [DOI] [PubMed] [Google Scholar]
- 4.Kheradvar A, Pedrizzetti G. Vortex Formation in the Cardiovascular System. London, UK: Springer-Verlag; 2012. [Google Scholar]
- 5.Foll D, Taeger S, Bode C, Jung B, Markl M. Age, gender, blood pressure, and ventricular geometry influence normal 3d blood flow characteristics in the left heart. Eur Heart J Cardiovasc Imaging. 2013;14:366–73. doi: 10.1093/ehjci/jes196. [DOI] [PubMed] [Google Scholar]
- 6.Gharib M, Rambod E, Kheradvar A, Sahn DJ, Dabiri JO. Optimal vortex formation as an index of cardiac health. Proc Natl Acad Sci USA. 2006;103:6305–8. doi: 10.1073/pnas.0600520103. [DOI] [PMC free article] [PubMed] [Google Scholar]
- 7.Dabiri JO, Gharib M. The role of optimal vortex formation in biological fluid transport. Proc Biol Sci. 2005;272:1557–60. doi: 10.1098/rspb.2005.3109. [DOI] [PMC free article] [PubMed] [Google Scholar]
- 8.Kheradvar A, Gharib M. On mitral valve dynamics and its connection to early diastolic flow. Ann Biomed Eng. 2009;37:1–13. doi: 10.1007/s10439-008-9588-7. [DOI] [PubMed] [Google Scholar]
- 9.Belohlavek M. Vortex formation time: an emerging echocardiographic index of left ventricular filling efficiency. Eur Heart J Cardiovasc Imaging. 2012;13:367–9. doi: 10.1093/ejechocard/jer311. [DOI] [PMC free article] [PubMed] [Google Scholar]
- 10.Kheradvar A, Assadi R, Falahatpisheh A, Sengupta PP. Assessment of transmitral vortex formation in patients with diastolic dysfunction. J Am Soc Echocardiogr. 2012;25:220–7. doi: 10.1016/j.echo.2011.10.003. [DOI] [PubMed] [Google Scholar]
- 11.Poh KK, Lee LC, Shen L, Chong E, Tan YL, Chai P, et al. Left ventricular fluid dynamics in heart failure: echocardiographic measurement and utilities of vortex formation time. Eur Heart J Cardiovasc Imaging. 2012;13:385–93. doi: 10.1093/ejechocard/jer288. [DOI] [PubMed] [Google Scholar]
- 12.Hong GR, Pedrizzetti G, Tonti G, Peng L, Zhao W, Kim JK, et al. Characterization and quantification of vortex flow in the human left ventricle by contrast echocardiography using particle image velocimetry. J Am Coll Cardiol Cardiovasc Imaging. 2008;1:705–17. doi: 10.1016/j.jcmg.2008.06.008. [DOI] [PMC free article] [PubMed] [Google Scholar]
- 13.Sengupta PP, Pedrizetti G, Narula J. Multiplanar visualization of blood flow using echocardiographic particle imaging velocimetry. J Am Coll Cardiol Cardiovasc Imaging. 2012;5:566–9. doi: 10.1016/j.jcmg.2011.09.026. [DOI] [PubMed] [Google Scholar]
- 14.Zhang F, Lanning C, Mazzaro L, Barker AJ, Gates PE, Strain WD, et al. In vitro and preliminary in vivo validation of echo particle image velocimetry in carotid vascular imaging. Ultrasound Med Biol. 2011;37:450–64. doi: 10.1016/j.ultrasmedbio.2010.11.017. [DOI] [PMC free article] [PubMed] [Google Scholar]
- 15.Sengupta PP, Pedrizzetti G, Kilner PJ, Kheradvar A, Ebbers T, Tonti G, et al. Emerging trends in CV flow visualization. J Am Coll Cardiol Cardiovasc Imaging. 2012;5:305–16. doi: 10.1016/j.jcmg.2012.01.003. [DOI] [PubMed] [Google Scholar]
- 16.Ohtsuki S, Tanaka M. The flow velocity distribution from the Doppler information on a plane in three-dimensional flow. J Visual. 2006;9:69–82. [Google Scholar]
- 17.Uejima T, Koike A, Sawada H, Aizawa T, Ohtsuki S, Tanaka M, et al. A new echocardiographic method for identifying vortex flow in the left ventricle: numerical validation. Ultrasound Med Biol. 2010;36:772–88. doi: 10.1016/j.ultrasmedbio.2010.02.017. [DOI] [PubMed] [Google Scholar]
- 18.Garcia D, del Alamo JC, Tanne D, Yotti R, Cortina C, Bertrand E, et al. Two-dimensional intraventricular flow mapping by digital processing conventional color-Doppler echocardiography images. IEEE Trans Med Imaging. 2010;10:1701–13. doi: 10.1109/TMI.2010.2049656. [DOI] [PubMed] [Google Scholar]
- 19.Chai P, Mohiaddin R. How we perform cardiovascular magnetic resonance flow assessment using phase-contrast velocity mapping. J Cardiovasc Magn Reson. 2005;7:705–16. doi: 10.1081/jcmr-65639. [DOI] [PubMed] [Google Scholar]
- 20.Wigstrom L, Sjoqvist L, Wranne B. Temporally resolved 3d phase-contrast imaging. Magn Reson Med. 1996;36:800–3. doi: 10.1002/mrm.1910360521. [DOI] [PubMed] [Google Scholar]
- 21.Bogren HG, Buonocore MH. 4D magnetic resonance velocity mapping of blood flow patterns in the aorta in young vs. elderly normal subjects. J Magn Reson Imaging. 1999;10:861–9. doi: 10.1002/(sici)1522-2586(199911)10:5<861::aid-jmri35>3.0.co;2-e. [DOI] [PubMed] [Google Scholar]
- 22.Markl M, Harloff A, Bley TA, Zaitsev M, Jung B, Weigang E, et al. Time-resolved 3D MR velocity mapping at 3T: improved navigator-gated assessment of vascular anatomy and blood flow. J Magn Reson Imaging. 2007;25:824–31. doi: 10.1002/jmri.20871. [DOI] [PubMed] [Google Scholar]
- 23.Uribe S, Beerbaum P, Sorensen TS, Rasmusson A, Razavi R, Schaeffter T. Four-dimensional (4D) flow of the whole heart and great vessels using real-time respiratory self-gating. Magn Reson Med. 2009;62:984–92. doi: 10.1002/mrm.22090. [DOI] [PubMed] [Google Scholar]
- 24.Napel S, Lee DH, Frayne R, Rutt BK. Visualizing three-dimensional flow with simulated streamlines and three-dimensional phase-contrast MR imaging. J Magn Reson Imaging. 1992;2:143–53. doi: 10.1002/jmri.1880020206. [DOI] [PubMed] [Google Scholar]
- 25.Buonocore MH. Visualizing blood flow patterns using streamlines, arrows, and particle paths. Magn Reson Med. 1998;40:210–26. doi: 10.1002/mrm.1910400207. [DOI] [PubMed] [Google Scholar]
- 26.Harloff A, Nussbaumer A, Bauer S, Stalder AF, Frydrychowicz A, Weiller C, et al. In vivo assessment of wall shear stress in the atherosclerotic aorta using flow-sensitive 4D MRI. Magn Reson Med. 2010;63:1529–36. doi: 10.1002/mrm.22383. [DOI] [PubMed] [Google Scholar]
- 27.Markl M, Wallis W, Brendecke S, Simon J, Frydrychowicz A, Harloff A. Estimation of global aortic pulse wave velocity by flow-sensitive 4D MRI. Magn Reson Med. 2010;63:1575–82. doi: 10.1002/mrm.22353. [DOI] [PubMed] [Google Scholar]
- 28.Dyverfeldt P, Kvitting JP, Sigfridsson A, Engvall J, Bolger AF, Ebbers T. Assessment of fluctuating velocities in disturbed cardiovascular blood flow: in vivo feasibility of generalized phase-contrast MRI. J Magn Reson Imaging. 2008;28:655–63. doi: 10.1002/jmri.21475. [DOI] [PubMed] [Google Scholar]
- 29.Bock J, Frydrychowicz A, Lorenz R, Hirtler D, Barker AJ, Johnson KM, et al. In vivo noninvasive 4D pressure difference mapping in the human aorta: phantom comparison and application in healthy volunteers and patients. Magn Reson Med. 2011;66:1079–88. doi: 10.1002/mrm.22907. [DOI] [PubMed] [Google Scholar]
- 30.Lum DP, Johnson KM, Paul RK, Turk AS, Consigny DW, Grinde JR, et al. Transstenotic pressure gradients: measurement in swine—retrospectively ECG-gated 3D phase-contrast MR angiography versus endovascular pressure-sensing guidewires. Radiology. 2007;245:751–60. doi: 10.1148/radiol.2453061946. [DOI] [PubMed] [Google Scholar]
- 31.Kheradvar A, Houle H, Pedrizzetti G, Tonti G, Belcik T, Ashraf M, et al. Echocardiographic particle image velocimetry: a novel technique for quantification of left ventricular blood vorticity pattern. J Am Soc Echocardiogr. 2010;23:86–94. doi: 10.1016/j.echo.2009.09.007. [DOI] [PubMed] [Google Scholar]
- 32.Hong GR, Pedrizzetti G, Tonti G, Li P, Wel Z, Kim JK, et al. Characterization and quantification of vortex flow in the human left ventricle by contrast echocardiography using vector particle image velocimetry. J Am Coll Cardiol Cardiovasc Imaging. 2008;6:705–17. doi: 10.1016/j.jcmg.2008.06.008. [DOI] [PMC free article] [PubMed] [Google Scholar]
- 33.Zhang H, Zhang J, Zhu X, Chen L, Liu L, Duan Y, et al. The left ventricular intracavitary vortex during the isovolumic contraction period as detected by vector flow mapping. Echocardiography. 2012;29:579–87. doi: 10.1111/j.1540-8175.2011.01649.x. [DOI] [PubMed] [Google Scholar]
- 34.Nogami Y, Ishizu T, Atsumi A, Yamamoto M, Kawamura R, Seo Y, et al. Abnormal early diastolic intraventricular flow ‘kinetic energy index’ assessed by vector flow mapping in patients with elevated filling pressure. Eur Heart J Cardiovasc Imaging. 2013;14:253–60. doi: 10.1093/ehjci/jes149. [DOI] [PubMed] [Google Scholar]
- 35.Zhang H, Liu L, Chen L, Ma M, Zhou L, Ying L, et al. The evolution of intraventricular vortex during ejection studied by using vector flow mapping. Echocardiography. 2012;1:27–36. doi: 10.1111/j.1540-8175.2012.01806.x. [DOI] [PubMed] [Google Scholar]
- 36.Kim WY, Walker PG, Pedersen EM, Poulsen JK, Oyre S, Houlind K, et al. Left ventricular blood flow patterns in normal subjects: a quantitative analysis by three-dimensional magnetic resonance velocity mapping. J Am Coll Cardiol. 1995;26:224–38. doi: 10.1016/0735-1097(95)00141-l. [DOI] [PubMed] [Google Scholar]
- 37.Carlhall CJ, Bolger A. Passing strange: flow in the failing ventricle. Circ Heart Fail. 2010;3:326–31. doi: 10.1161/CIRCHEARTFAILURE.109.911867. [DOI] [PubMed] [Google Scholar]
- 38.Mangual JO, Domenichini F, Pedrizzetti G. Describing the highly three dimensional right ventricle flow. Ann Biomed Eng. 2012;40:1790–801. doi: 10.1007/s10439-012-0540-5. [DOI] [PubMed] [Google Scholar]
- 39.Li C, Zhang J, Li X, Zhou C, Li H, Tang H, et al. Quantification of chronic aortic regurgitation by vector flow mapping: a novel echocardiographic method. Eur J Echocardiogr. 2010;11:119–24. doi: 10.1093/ejechocard/jep175. [DOI] [PubMed] [Google Scholar]
- 40.Didier D. Assessment of valve disease: qualitative and quantitative. Magn Reson Imaging Clin N Am. 2003;11:115–34. doi: 10.1016/s1064-9689(02)00024-7. [DOI] [PubMed] [Google Scholar]
- 41.Kozerke S, Hasenkam JM, Pedersen EM, Boesiger P. Visualization of flow patterns distal to aortic valve prostheses in humans using a fast approach for cine 3D velocity mapping. J Magn Reson Imaging. 2001;13:690–8. doi: 10.1002/jmri.1097. [DOI] [PubMed] [Google Scholar]
- 42.Wei X, Tang H, Chen L, Zhang JQ, Li C, Feng Y, et al. Visualization of right atrial flow patterns and quantification of pulmonary to systemic flow ratio in patients with atrial septal defect by vector flow mapping. Sichuan Da Xue Xue Bao Yi Xue Ban. 2012;43:275–9. [PubMed] [Google Scholar]
- 43.Gatehouse PD, Keegan J, Crowe LA, Masood S, Mohiaddin RH, Kreitner KF, et al. Applications of phase-contrast flow and velocity imaging in cardiovascular MRI. Eur Radiol. 2005;15:2172–84. doi: 10.1007/s00330-005-2829-3. [DOI] [PubMed] [Google Scholar]
- 44.Beerbaum P, Korperich H, Barth P, Esdorn H, Gieseke J, Meyer H. Noninvasive quantification of left-to-right shunt in pediatric patients: phase-contrast cine magnetic resonance imaging compared with invasive oximetry. Circulation. 2001;103:2476–82. doi: 10.1161/01.cir.103.20.2476. [DOI] [PubMed] [Google Scholar]
- 45.Underwood SR, Firmin DN, Rees RS, Longmore DB. Magnetic resonance velocity mapping. Clin Phys Physiol Meas. 1990;11:37–43. doi: 10.1088/0143-0815/11/4a/305. [DOI] [PubMed] [Google Scholar]
- 46.Barker AJ, Markl M, Burk J, Lorenz R, Bock J, Bauer S, et al. Bicuspid aortic valve is associated with altered wall shear stress in the ascending aorta. Circ Cardiovasc Imaging. 2012;5:457–66. doi: 10.1161/CIRCIMAGING.112.973370. [DOI] [PubMed] [Google Scholar]
- 47.Son JW, Park WJ, Choi JH, Houle H, Vannan MA, Hong GR, et al. Abnormal left ventricular vortex flow patterns in association with left ventricular apical thrombus formation in patients with anterior myocardial infarction. Circ J. 2012;76:2640–6. doi: 10.1253/circj.cj-12-0360. [DOI] [PubMed] [Google Scholar]
- 48.Fyrenius A, Wigstrom L, Ebbers T, Karlsson M, Engvall J, Bolger AF. Three dimensional flow in the human left atrium. Heart. 2001;86:448–55. doi: 10.1136/heart.86.4.448. [DOI] [PMC free article] [PubMed] [Google Scholar]
- 49.Sengupta PP, Khandheria BK, Korinek J, Jahangir A, Yoshifuku S, Milosevic I, et al. Left ventricular isovolumic flow sequence during sinus and paced rhythms: new insights from use of high-resolution Doppler and ultrasonic digital particle imaging velocimetry. J Am Coll Cardiol. 2007;49:899–908. doi: 10.1016/j.jacc.2006.07.075. [DOI] [PubMed] [Google Scholar]
- 50.Frydrychowicz A, Harloff A, Jung B, Zaitsev M, Weigang E, Bley TA, et al. Time-resolved, 3-dimensional magnetic resonance flow analysis at 3T: visualization of normal and pathological aortic vascular hemodynamics. J Comput Assist Tomogr. 2007;31:9–15. doi: 10.1097/01.rct.0000232918.45158.c9. [DOI] [PubMed] [Google Scholar]
- 51.Hope MD, Meadows AK, Hope TA, Ordovas KG, Saloner D, Reddy GP, et al. Clinical evaluation of aortic coarctation with 4D flow MR imaging. J Magn Reson Imaging. 2010;31:711–8. doi: 10.1002/jmri.22083. [DOI] [PubMed] [Google Scholar]
- 52.Frydrychowicz A, Winterer JT, Zaitsev M, Jung B, Hennig J, Langer M, et al. Visualization of iliac and proximal femoral artery hemodynamics using time-resolved 3D phase contrast MRI at 3T. J Magn Reson Imaging. 2007;25:1085–92. doi: 10.1002/jmri.20900. [DOI] [PubMed] [Google Scholar]
- 53.Harloff A, Albrecht F, Spreer J, Stalder AF, Bock J, Frydrychowicz A, et al. 3D blood flow characteristics in the carotid artery bifurcation assessed by flow-sensitive 4D MRI at 3T. Magn Reson Med. 2009;61:65–74. doi: 10.1002/mrm.21774. [DOI] [PubMed] [Google Scholar]
- 54.Bammer R, Hope TA, Aksoy M, Alley MT. Time-resolved 3D quantitative flow MRI of the major intracranial vessels: initial experience and comparative evaluation at 1.5T and 3.0T in combination with parallel imaging. Magn Reson Med. 2007;57:127–40. doi: 10.1002/mrm.21109. [DOI] [PMC free article] [PubMed] [Google Scholar]
- 55.Reiter G, Reiter U, Kovacs G, Kainz B, Schmidt K, Maier R, et al. Magnetic resonance-derived 3-dimensional blood flow patterns in the main pulmonary artery as a marker of pulmonary hypertension and a measure of elevated mean pulmonary arterial pressure. Circ Cardiovasc Imaging. 2008;1:23–30. doi: 10.1161/CIRCIMAGING.108.780247. [DOI] [PubMed] [Google Scholar]


