Abstract
Metabolic inflammation may contribute to the pathogenesis of obesity and its comorbidities, including type 2 diabetes and cardiovascular disease. Previously, we showed that the actin-binding protein profilin-1 (pfn) plays a role in atherogenesis because pfn heterozygote mice (PfnHet) exhibited a significant reduction in atherosclerotic lesion burden and vascular inflammation. In the current study, we tested whether pfn haploinsufficiency would also limit diet-induced adipose tissue inflammation and insulin resistance (IR). First, we found that a high-fat diet (HFD) upregulated pfn expression in epididymal and subcutaneous white adipose tissue (WAT) but not in the liver or muscle of C57BL/6 mice compared with normal chow. Pfn expression in WAT correlated with F4/80, an established marker for mature macrophages. Of note, HFD elevated pfn protein levels in both stromal vascular cells and adipocytes of WAT. We also found that PfnHet were significantly protected from HFD-induced glucose intolerance observed in pfn wild-type mice. With HFD, PfnHet displayed blunted expression of systemic and WAT proinflammatory cytokines and decreased accumulation of adipose tissue macrophages, which were also preferentially biased toward an M2-like phenotype; this correlated with preserved frequency of regulatory T cells. Taken together, the findings indicate that pfn haploinsufficiency protects against diet-induced IR and inflammation by modulating WAT immune homeostasis.
Chronic low-grade inflammation accompanies and may contribute to the pathogenesis of obesity and its comorbidities, including type 2 diabetes (T2D) (1,2) and cardiovascular disease (3). Although its molecular bases remain incompletely understood, metabolic inflammation can be found at both the systemic and the tissue level and is characterized by activation of immune cells and abnormal production of cytokines and chemokines (4). Infiltration of macrophages and other immune cells has been invoked as a pathogenetic factor in white adipose tissue (WAT) inflammation and expansion, resulting in systemic insulin resistance (IR) (5). Although operationally grouped in M1 and M2 polarization extremes, adipose tissue macrophages (ATMs) are highly plastic and heterogeneous, resulting in overlapping phenotypes of activation (6). CD11c+ ATMs are highly enriched in obesity, particularly in the crown-like structures (CLSs) that surround dead or dying adipocytes. It has also been proposed that CD11c+ ATMs express high levels of proinflammatory mediators and promote IR (7,8). ATMs expressing the galactose-type C-type lectin (MGL1/CD301), albeit in part overlapping with CD11c+ ATMs (9), are enriched in the interstitium of lean and obese WAT and have been suggested to display additional M2-like features (9,10).
Studies have begun to clarify the networks of interactions between ATMs and adipocytes (11) and other infiltrating immune cells within obese WAT. Specifically, WAT expansion is associated with an increased ratio of CD8+ to CD4+ T cells, which precedes ATM accumulation (12–14). Additionally, decreased frequency of Foxp3+ regulatory T cells (Treg) was noted in the WAT of both ob/ob mice and mice fed a high-fat diet (HFD) (13,14). Depletion of Treg promoted IR and upregulation of inflammatory cytokines in WAT, whereas stimulation of Treg function using interleukin (IL)-2–based complexes partially protected against HFD-induced IR (13). In addition, reconstitution with CD4+ cells but not CD8+ improved the metabolic phenotype of Rag1-null mice, which are deficient in B and T lymphocytes and display accelerated IR (14). Together, these studies suggest that Treg maintain immune homeostasis within the WAT microenvironment.
Diet-induced accumulation of macrophages and other immune cells in WAT offers conspicuous analogies with the activation of both innate and adaptive immunity in the vascular wall during atherogenesis (15). We described an essential role for the actin-binding protein profilin-1 (pfn) in early atherosclerotic lesion formation (16). Pfn is essential for early development as pfn homozygous knockout die at the two-cell stage (17); it is best characterized by its critical function in actin dynamics (18,19) and regulation of adhesion and migration in numerous cell types, including macrophages (20). Postdevelopmental expression of pfn is highest in macrophages and adipocytes, intermediate in hepatocytes and endothelial cells (ECs), and nearly undetectable in striate muscle (16, G.R.R., unpublished observations). Although it resides primarily intracellularly and lacks a signal peptide, pfn can be secreted extracellularly through exosomes (21), which are 60- to 90-nm vesicles originated by late endosomes; can be detected in the serum of patients with atherosclerosis (22); and can activate the innate immune response to parasites in dendritic cells (23). Several lines of evidence suggest that pfn levels are increased in diabetes and vascular inflammation. The diabetic milieu, which is associated with a proinflammatory/reactive state (24), can upregulate pfn expression in mesangial cells (25). Additionally, we showed that pfn levels are increased in the aorta of diabetic rats (26,27), in human atherosclerotic lesions (22), and in cultured ECs exposed to oxidized cholesterol (oxChol) through activation of the transcription factor signal transducer and activator of transcription-3 (STAT3) (27).
In the current study, we addressed whether in addition to a role in atherogenesis pfn plays a role in diet-induced WAT inflammation and IR. We found that pfn heterozygote mice (PfnHet) are protected against HFD-induced systemic IR, ATM accumulation, and WAT inflammation. Additionally, HFD-fed PfnHet display preserved frequency of Treg in association with ATMs biased toward an M2 anti-inflammatory phenotype.
RESEARCH DESIGN AND METHODS
C57BL/6J mice were purchased from Taconic and fed an HFD (60% calories from fat) (Harlan Teklad) starting at 7 weeks of age or maintained on normal chow (NC) (10% calories from fat) (Harlan Teklad) for the indicated intervals before testing or euthanasia. In other experiments, mice were obtained after having been maintained on HFD or NC at the Taconic facility.
PfnHet and wild-type littermates (PfnWT) were originally provided by Walter Witke (Mouse Biology Program, European Molecular Biology Laboratory, Monterotondo, Italy) on a C57BL/6J background (Pfn homozygous knockout die at the two-cell stage) (17). Both mouse strains were further backcrossed on a C57BL/6J background for at least five generations before being used for experiments. Genotyping was performed as described elsewhere (16). Beginning at 7 weeks of age, PfnHet and PfnWT were fed an HFD or continued on NC for the indicated intervals. At the time of euthanasia, tissues and blood were collected for analysis. All mice had free access to water and chow and were housed under alternating 12-h light and dark cycles. All experiments were approved by the Joslin Diabetes Center Animal Care and Use Committee and were performed in accordance with the Public Health Service Guide for the Care and Use of Laboratory Animals and U.S. Department of Agriculture regulations under the Animal Welfare Act.
Metabolic parameters and circulating metabolites.
Blood was collected from tail veins of unanesthetized mice after an overnight fast to measure glucose (Glucometer Elite; Bayer) and serum insulin (Crystal Chem, Downers Grove, IL). One hundred microliters of serum was obtained from overnight-fasted mice to assay cytokines and chemokines (Quansys Bioscience, Logan, UT) with a Luminex ELISA multiplex platform. For glucose tolerance testing (GTT), PfnWT and PfnHet males fed HFD or NC for 12 weeks were injected intraperitoneally with 2.0 g glucose/kg body weight, and blood glucose level was measured at indicated times.
Isolation of adipocytes and stromal vascular fraction.
Epididymal adipose tissue was processed for isolation of adipocytes and stromal vascular fraction (SVF) as described previously (28). Briefly, epididymal fat pads were excised and minced into Krebs-Ringer bicarbonate (KRB) solution (12.5 mmol/L HEPES [pH 7.4], 120 mmol/L NaCl, 6 mol/L KCl, 1.2 mmol/L MgSO4, 1 mol/L CaCl2, 2% BSA, and 2.5 mmol/L glucose) followed by digestion with collagenase type II 1 mg/mL (Worthington, Lakewood, NJ) and DNase I 0.2 mg/mL (Sigma, St. Louis, MO) at 37°C for 20 min with shaking. The solution containing digested adipose tissue was filtered through a 250-µm nylon sieve to remove large particles and centrifuged at 300 g for 5 min to separate floating adipocytes from the SVF pellet. Floating adipocytes were washed with KRB solution containing 5 mmol/L ethylenediaminetetraacetic acid (EDTA) and centrifuged again at 300 g for 5 min to separate residual SVF, which was pooled with the initial SVF. Adipocytes were washed again with KRB solution, centrifuged, and collected for protein or RNA extraction. SVF pellets were treated with ammonium-chloride-potassium lysing buffer (Invitrogen, Grand Island, NY) to remove red blood cells.
Flow cytometry.
SVF pellets were resuspended in 2% FBS/PBS containing 1% Fc Block (BD Pharmingen, San Diego, CA) and stained with cocktails of conjugated antibodies (Supplementary Table 1). After staining and washing with 2% FBS/PBS, cells were filtered through a 100-µm mesh and stained with propidium iodide (Sigma) at a final concentration of 0.2 µg/mL to exclude dead cells. ATMs were defined as F4/80+CD11b+ cells within the CD45+, CD3–, B220–, TER119–, and NK1.1– population (Supplementary Fig. 1), and in selected experiments, they were sorted by Aria (BD Biosciences) for quantitative real-time PCR (qRT-PCR) or Western blotting. For ATM subset analysis, cells were further stained with monoclonal antibodies specific for CD11c, MHC-II, Ly6C (eBioscience, San Diego, CA), CD206, and CD301/MGL-1 (AbD Serotec, Raleigh, NC). For intracellular staining of Foxp3, the Foxp3 staining buffer set (eBioscience) was used according to the manufacturer’s protocol. Briefly, cells were incubated with Fc Block for 15 min and then stained for 20 min with a cocktail of antibodies (Supplementary Table 1). Labeled cells were washed with 2% FBS/PBS, fixed and permeabilized with fixation/permeabilization buffer (eBioscience) for 40 min, and incubated again with Fc Block followed by staining with PE-anti-Foxp3 or PE-IgG2a isotype control (eBioscience) for 30 min. All these staining procedures were performed at 4°C in the dark. After staining, cells were washed in permeabilization buffer (eBioscience) and resuspended in 2% FBS/PBS for immediate analysis by LSR II (BD Biosciences). Treg were defined as CD45+, GR1–, TER119–, F4/80–, CD3+, CD4+, CD25+, and Foxp3+ (Supplementary Fig. 2). Gating was based on fluorescence minus one as well as on isotype control.
Chromatin immunoprecipitation in SVF.
Epididymal fat pads isolated from mice fed HFD or NC for 12 weeks were weighed and fixed immediately in 5 mL PBS and 1% formaldehyde (Polysciences, Inc.) for 10 min at room temperature followed by an addition of 750 µL 1 mol/L glycine (final concentration 0.15 mol/L) for 5 min at room temperature to stop fixation. The tissue was washed in PBS and 2% FBS and minced with scissors. SVF was isolated as described previously. Epididymal fat pads pooled from three HFD- or eight NC-fed mice were used for each chromatin immunoprecipitation (ChIP), yielding ∼4–6 million stromal vascular cells (SVCs) per pool. The final SVF pellet was resuspended in 350 µL SDS lysis buffer (50 mmol/L Tris-HCl [pH 8.0], 10 mmol/L EDTA, 1% SDS), and incubated for 15 min on ice. Protease inhibitors leupeptin (10 µmol/L), pepstatin (1 µmol/L), aprotinin (5 µg/mL), and phenylmethylsulfonyl fluoride (1 mmol/L) (all from Sigma) were added to the buffers throughout the procedure. Sonication was then performed on ice with a Branson Sonifier 450 (five cycles of 10-s pulses at a constant setting, one-fourth of maximum power, interspersed by 30-s pauses) to yield DNA fragments of ∼0.3–0.7 kbp in size. After centrifugation at maximum speed for 10 min in a microfuge, the supernatant (i.e., the sheared chromatin) was collected and used for immunoprecipitation, and the pellet was discarded. The supernatant was diluted 10 times with ChIP dilution buffer (0.01% SDS, 1.1% Triton-X 100, 1.2 mmol/L EDTA, 16.7 mmol/L Tris-HCl [pH 8.1], 167 mmol/L NaCl). A 5% aliquot of the supernatant was saved to quantify the starting material (input).
All other steps were performed as described elsewhere (27). Details of antibodies and washing solutions are reported in Supplementary Table 2. To increase the efficiency of STAT3 ChIP, two anti-STAT3 antibodies were used concomitantly. Immunoprecipitated chromatin was recovered overnight at −20°C by adding two volumes of ethanol in the presence of 20 μg glycogen (Roche, Indianapolis, IN) followed by centrifugation (13,000 g for 30 min) and purification with QIAquick spin columns (Qiagen, Valencia, CA). SYBR green custom primers were used to amplify three fragments of 5′-untranslated region (UTR) of the mouse pfn-1 gene (Supplementary Table 3), including a −711 to −406 region encompassing the STAT response element TT(CCCCG)AA located at −513 to −505. Quantification of the immunoprecipitated chromatin and input was carried out as described elsewhere in this section. Level of target chromatin was normalized by input.
Immunohistochemistry and morphometric analysis.
Immunohistochemistry was performed by 5-µm-thick formalin-fixed, paraffin-embedded epididymal adipose sections, which were cut at the Histology Core from the Joslin Diabetes Center. Staining with anti-F4/80 antibody 1:50 (Serotec) was performed overnight at 4°C followed by a peroxidase-based VECTASTAIN ABC Kit (Vector Laboratories, Burlingame, CA), as described previously (29,30). CLS density was expressed as the number of CLSs per 400 adipocytes (31) counted from three sections cut at least 50 µm apart. Consecutive sections were stained, with nonimmune rat IgG2b as negative control. Sections were counterstained with hematoxylin before morphometric analysis under light microscopy by an independent observer in a masked fashion.
Adipocyte area was calculated from the same three sections used to count CLSs as 50 random adipocytes per section (total of 150 adipocytes per mouse). Adipocytes within CLSs were not included in this analysis. Images were collected and analyzed with a Zeiss Axioskop2 Mot Plus microscope equipped with Axiovision software.
Western blot.
Proteins from mouse tissues and sorted macrophages were extracted in radioimmunoprecipitation assay buffer and processed for immunoblot analysis as described elsewhere (26).
RNA extraction and qRT-PCR.
RNA was isolated from sorted ATMs with QIAzol (Qiagen) and amplified with a MessageAMP II kit (Ambion, Austin, TX). For whole adipose tissue, liver, and soleus muscle, RNA was isolated with an RNeasy Lipid Tissue Mini Kit (Qiagen) according to the manufacturer’s instructions. One microgram of total RNA was converted to double-stranded cDNA with an Advantage RT for PCR kit (Clontech, Palo Alto, CA). Primers used in RT-PCR were from Applied Biosystems (Foster City, CA) and are listed in Supplementary Table 4. cDNA levels were measured with TaqMan Universal PCR Master Mix (Applied Biosystems) on an ABI 7900HT RT-PCR system (Applied Biosystems). Levels of target genes were normalized by TATA box-binding protein (TBP).
Statistical analysis.
Data are presented as mean ± SD. Unpaired t test was used for comparisons between two groups, whereas ANOVA followed by Bonferroni test was used for comparison for multiple groups.
RESULTS
WAT pfn expression is increased by HFD and correlates with macrophage accumulation.
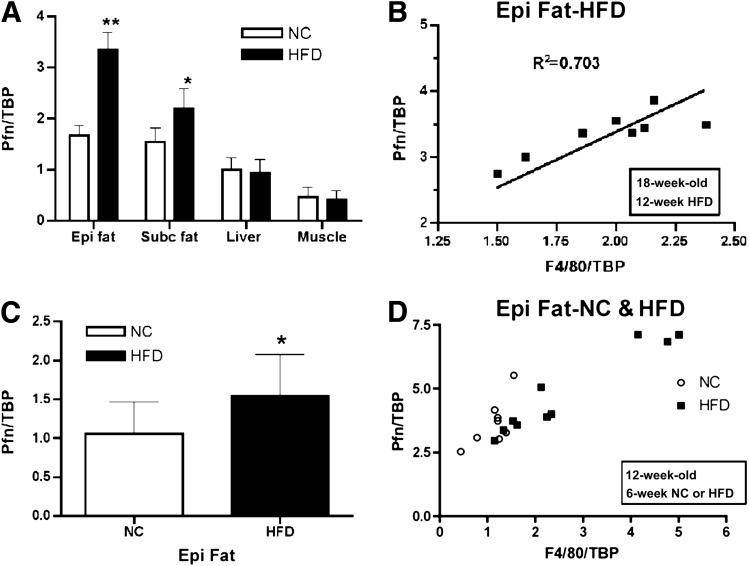
The attenuated accumulation of macrophages in the vascular wall and the atheroprotective phenotype exhibited by PfnHet prompted us to test whether pfn also played a role in diet-induced IR, ATM accumulation, and WAT inflammation. Because we had previously detected increased levels of pfn in the aorta of mice fed a high-cholesterol diet (16) and in ECs exposed to oxChol (27), we first investigated the effects of HFD on pfn expression in other metabolically relevant candidate tissues in the current study. Compared with NC, feeding with HFD for 12 weeks resulted in a statistically significant elevation of pfn mRNA in epididymal and, to a lesser extent, subcutaneous WAT but not in liver or muscle (Fig. 1A). In epididymal WAT, mRNA expression of pfn closely correlated with that of F4/80, an established marker for mature macrophages (32). The upregulation of pfn in epididymal WAT (Fig. 1C) and the correlation between pfn and F4/80 expression (Fig. 1D) were already noted after 6 weeks of HFD, suggesting that these are early events in the natural history of WAT inflammation rather than the consequence of obesity-associated WAT remodeling. Of note, the correlation between pfn and F4/80 expression was somewhat weaker but also statistically significant in mice fed NC (Fig. 1D).
FIG. 1.
Pfn expression in WAT. A: qRT-PCR shows a significant increase for pfn in epididymal (Epi) and subcutaneous (Subc) WAT from 19-week-old C57BL/6 mice fed HFD for 12 weeks compared with NC (n = 8). **P < 0.0001; *P < 0.005. B: Pfn and F4/80 expression positively correlated in Epi WAT of HFD for 12 weeks (R2 = 0.703, P < 0.0001). C: qRT-PCR shows a significant increase for pfn in Epi fat from 12-week-old C57BL/6 mice fed HFD for 6 weeks compared with NC (n = 8/group). *P < 0.05. D: Pfn expression in Epi fat correlated with F4/80 both in mice fed NC (R2 = 0.52, P < 0.05) and in mice fed HFD (R2 = 0.91, P < 0.0001) for 6 weeks.
HFD induces STAT3 recruited to the pfn promoter in SVF ex vivo.
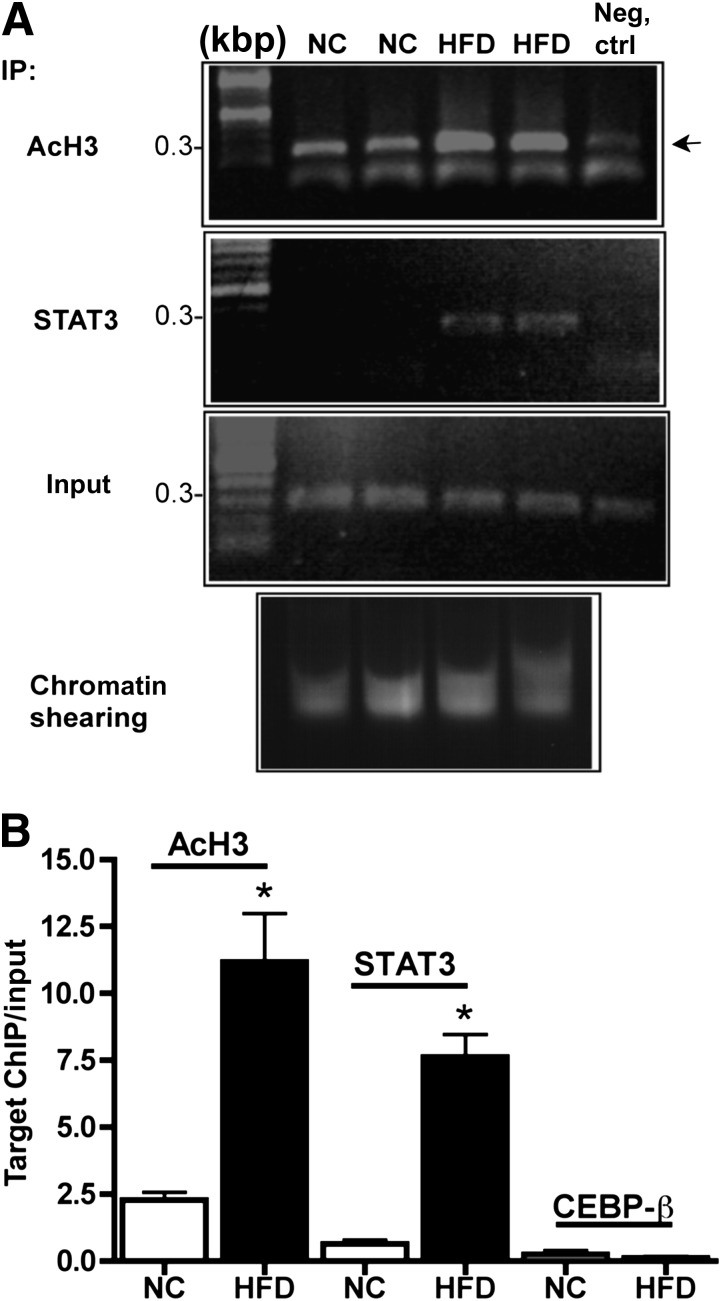
To address the transcriptional mechanisms for HFD-induced pfn gene expression, we optimized an ex vivo strategy for ChIP in SVF. In rat ECs, ChIP of the pfn 5′-UTR showed that STAT3 recruitment to a single response element at −501 was indispensable for oxChol-mediated pfn upregulation (27). In SVF isolated from the epididymal WAT of mice fed NC or HFD for 12 weeks, STAT3 was recruited to the mouse pfn promoter in an HFD-dependent manner. Additionally, activation of the same region of pfn, estimated by histone 3 lysine acetylation, was markedly enhanced by HFD (Fig. 2A and B). In parallel experiments, binding of other candidate transcription factors with response elements within the 5′-UTR (up to ∼−1,110), such as c-Rel (data not shown) or CEBP-β, was not detected (Fig. 2B). Thus, similar to the effects of oxChol in cultured ECs (27), HFD elicited the recruitment of STAT3 to the pfn promoter in SVCs.
FIG. 2.
ChIP in SVF ex vivo. Whole epididymal fat pads were fixed with formaldehyde immediately after dissection. After SVF isolation, ChIP was performed with the use of anti-STAT3, CEBP-β, and anti-acetylated histone H3 (AcH3) (kbp 9–14) antibodies followed by gel electrophoresis of 50% of the associated DNA (A) and qRT-PCR of the remainder (B). Negative control is chromatin incubated with nonimmune rabbit IgG. Input indicates the level of specific target chromatin before immunoprecipitation and was used to normalize qRT-PCR values. A: Representative gel electrophoresis showing that HFD induces STAT3 recruitment to a ∼300-bp fragment of pfn 5′-UTR (−711 to −406), encompassing a single STAT3 response element (−505 to −513) in association with increased lysine acetylation of H3 (arrow). B: The quantification of the chromatin bound to candidate transcription factors within the pfn promoter. Compared with NC, HFD promotes a statistically significant STAT3 recruitment to the fragment of pfn 5′-UTR (−711 to −406) that encompasses a single STAT3 response element (−505 to −513) as well as increased lysine acetylation of H3 of the same fragment, suggesting transcriptional activation. CEBP-β did not associate with a more proximal fragment of pfn 5′-UTR encompassing two response elements (−302 to −315 and −182 to −192, respectively). For each ChIP, chromatin was pooled from three HFD or eight NC mice (n = 3–5 pools/group). *P < 0.0001. IP, immunoprecipitate.
HFD elevates pfn protein levels in both the adipocyte and the SVF compartment.
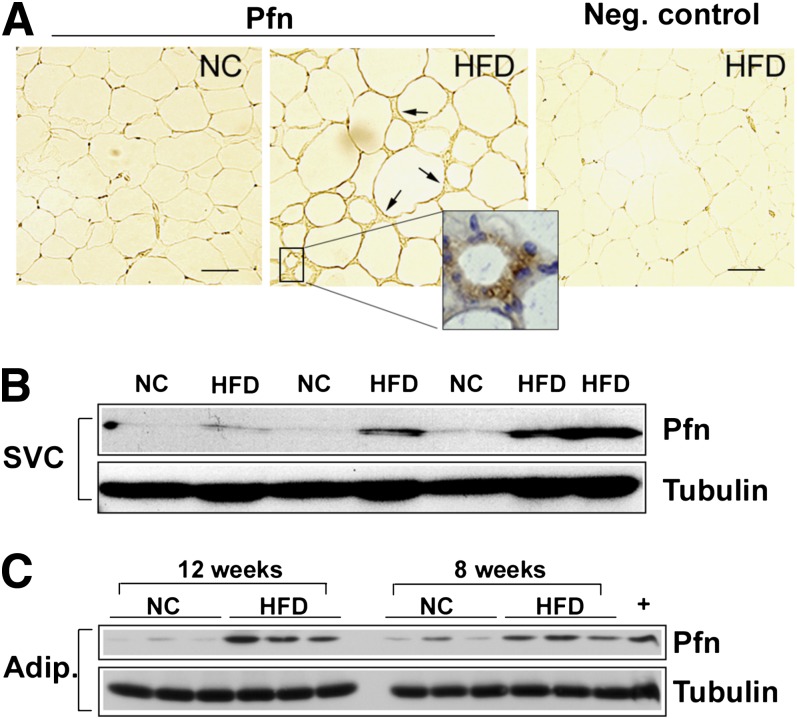
Next, we investigated distribution of the pfn protein level in WAT compartments. Staining of 5-µm sections of WAT with a specific anti-pfn antibody showed adipocytes from both NC and HFD-fed mice and revealed a strong immunoreactivity of SVC in HFD-fed mice (Fig. 3A). Of note, pfn staining within the SVC population was more intense in cells surrounding degenerating adipocytes (Fig. 3A, inset), suggesting that upregulation of pfn was predominant in typical CLS. Additionally, pfn levels were measured in protein extracts obtained from the SVF and the buoyant adipocyte fraction of epididymal WAT. Compared with NC, feeding with HFD for 12 weeks elicited a three- to fourfold elevation of pfn in both SVF and adipocyte fraction (Fig. 3B and C). This increase was already detected to a lesser extent after 8 weeks of HFD (Fig. 3C). Taken together, these results indicate that HFD induces a significant elevation of pfn protein levels in both SVCs and adipocytes and that pfn expression significantly correlates with ATM accumulation in the early phases of obesity.
FIG. 3.
Effects of HFD on pfn protein levels. A: Sections from epididymal WAT of NC- and HFD-fed mice were stained with anti-pfn antibody followed by colorimetric detection (brown). Staining was detected in SVCs of HFD samples (arrows) and was more intense in cells surrounding dying adipocytes. Slides were counterstained with hematoxylin (inset, blue). The negative control is the HFD section stained with nonimmune IgG. Scale bar: 50 μm. Western blot analysis of SVC (B) and adipocyte (C) extracts from epididymal fat pads of 18-week-old mice fed HFD for 12 weeks. HFD induced a three- to fourfold pfn increase in both compartments. Pfn densitometric values were normalized for tubulin. +, RAW264.7 macrophage (n = 6/group, P < 0.0001 for both SVCs and adipocytes at 12 weeks, P < 0.005 for adipocytes at 8 weeks). Adip., adipocyte.
Pfn haploinsufficiency protects against diet-induced IR.
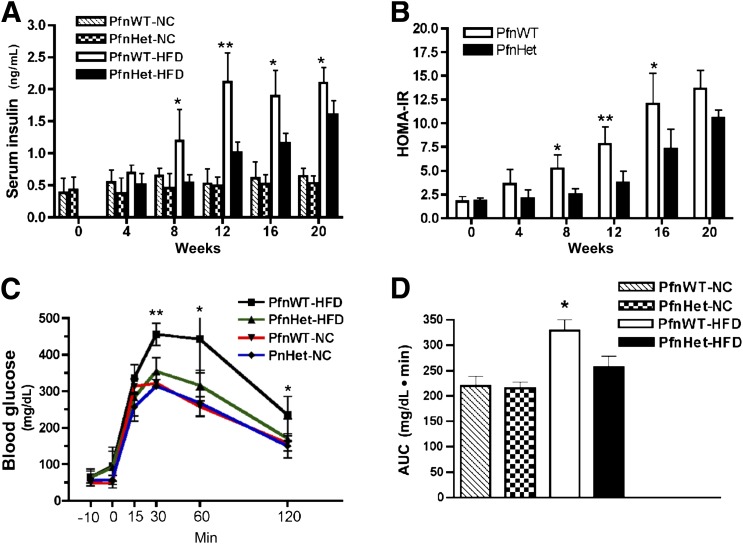
These experiments set the foundation to test the effect of pfn dosage on diet-induced IR and inflammation. Seven-week-old PfnWT and PfnHet were maintained on NC or HFD for varying time periods. As mentioned previously, pfn homozygotes could not be used because they die during embryonic development. As expected, HFD elicited a significant elevation in triglyceride and free fatty acid levels that was comparable in PfnWT and PfnHet (data not shown). Body weight was similar in the two groups under NC and HFD conditions (Supplementary Fig. 3). Of note, PfnHet were largely protected from the HFD-induced elevation of fasting insulin (FI) levels observed in PfnWT (12-week HFD 1.01 ± 0.16 vs. 2.1 ± 0.46 ng/mL) (Fig. 4A), whereas fasting blood glucose (FBG) levels were similar between the two groups and remained in the normal range until 12 weeks of HFD. Together, elevated FI and normal FBG levels suggested that HFD induced a state of compensated IR. Homeostasis model assessment for IR (HOMA-IR), an index of insulin sensitivity (33), mirrored the profile of FI (12-week HFD PfnHet 3.7 ± 1.32 vs. PfnWT 7.81 ± 1.86) (Fig. 4B). Protective effects in PfnHet became nonsignificant after the 20-week time point. Moreover, PfnHet-HFD exhibited a striking improvement of glucose tolerance in intraperitoneal GTT (Fig. 4C and D). These studies demonstrated that PfnHet were significantly protected against diet-induced IR and prompted us to investigate the mechanisms whereby pfn levels control insulin sensitivity.
FIG. 4.
Carbohydrate metabolism. A and B: PfnWT and PfnHet males on C57BL/6 background were fed HFD or NC beginning at 7 weeks of age (time 0). PfnHet-HFD were protected from the elevation of FI and HOMA-IR, measured as FBG (mmol/L) × FI (mU/L) / 22.5, observed in PfnWT-HFD (n = 5–6/group). ANOVA followed by Bonferroni test *P < 0.05; **P < 0.005. C and D: GTT (injected intraperitoneally with 2.0 g glucose/kg body weight) in 19-week-old PfnWT and PfnHet males after 12 weeks on NC or HFD. Data are blood glucose profile (C) and the corresponding AUC (D) (PfnHet 257 ± 21.2 vs. PfnWT 328 ± 21.0 mg/dL ⋅ min, n = 7–8/group). ANOVA followed by Bonferroni test *P <0.05, **P < 0.005 (C); ANOVA *P < 0.0001 (D). AUC, area under the curve.
PfnHet show blunted ATM accumulation and formation of CLS but unchanged adipocyte area.
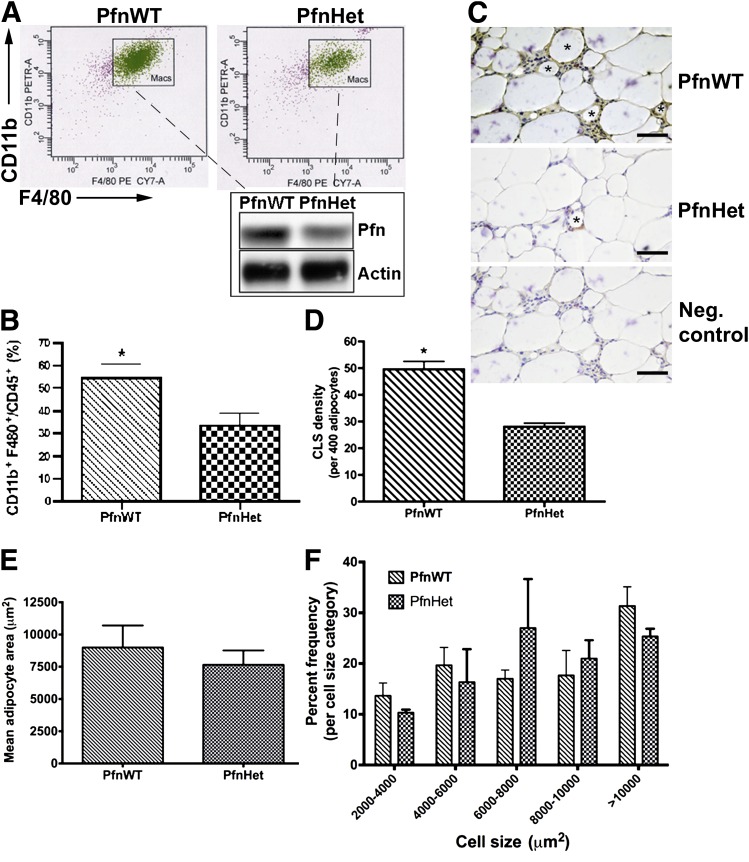
We reasoned that the protection against HFD-induced IR in PfnHet could be, at least in part, a result of taming inflammation in WAT and systemically. Because the expression of pfn correlates with that of F4/80 in epididymal WAT (Fig. 1B and D), we first tested whether ATM accumulation would be reduced in PfnHet. Indeed, flow cytometry analyses of SVF from epididymal WAT of PfnHet-HFD showed a markedly decreased ATM population within the CD45+ leukocyte pool (PfnHet 38.5 ± 5.0 vs. PfnWT 54.3 ± 6.2% of CD11b+, F4/80+, and CD45+ cells (Fig. 5A and B). Also, PfnHet fed NC exhibited decreased monocyte migration into the peritoneum and differentiation in response to thioglycollate as compared to PfnWT-NC (Supplementary Fig. 4). Additionally, PfnHet-HFD displayed a significant reduction of the frequency of CLS (defined as F4/80+ cells surrounding a degenerating adipocyte) compared with PfnWT-HFD (28 ± 3.4. vs. 49 ± 6.7 CLSs per 400 adipocytes) (Fig. 5C and D). In the same specimens, the mean adipocyte area was comparable in the two groups (7,650 ± 497 vs. 8,995 ± 762 µm2) (Fig. 5E). Although not identical, the distribution of frequency of adipocytes was not significantly affected by pfn haploinsufficiency for any size category (Fig. 5F). Together, these experiments indicate a critical function for pfn in diet-induced ATM infiltration and WAT remodeling.
FIG. 5.
ATMs in epididymal WAT of PfnWT and PfnHet. A: Flow cytometry analysis of SVF (described in detail in research design and methods) included staining with CD45 (leukocytes), CD11b, and F4/80 (ATMs, referred to as Macs) after gating for propidium iodide-negative (live) cells. Subsequently, protein lysates were obtained from ATMs sorted under sterile conditions and analyzed by Western blot (inset). The expected 50% reduction in pfn was observed in ATMs from PfnHet. B: Quantification of the ATM/CD45+ ratio demonstrates a statistically significant decrease of ATMs in PfnHet (n = 5). *P < 0.001. C: CLSs (asterisks) were detected in sections from epididymal WAT after staining with anti-F4/80 antibody followed by colorimetric detection (brown). Sections were counterstained with hematoxylin (blue). The negative control is a consecutive HFD section stained with nonimmune IgG. Scale bar: 25 μm. D: CLS density (per 400 adipocytes) showing a statistically significant decrease in CLS (shown with * in C) in PfnHet-HFD compared with PfnWT-HFD (n = 5). *P < 0.001. E: Mean adipocyte size area was comparable in PfnWT- and PfnHet-HFD for 12 weeks (n = 5). F: Distribution of adipocyte by size category shows similar frequencies for PfnWT and PfnHet.
PfnHet show a M2-like ATM phenotype.
In addition to the difference in the absolute number of ATMs, we investigated whether pfn haploinsufficiency affected the phenotype of ATM subsets on HFD. ATMs, like other macrophages, exhibit a wide array of polarization states across the M1/M2 spectrum (6).
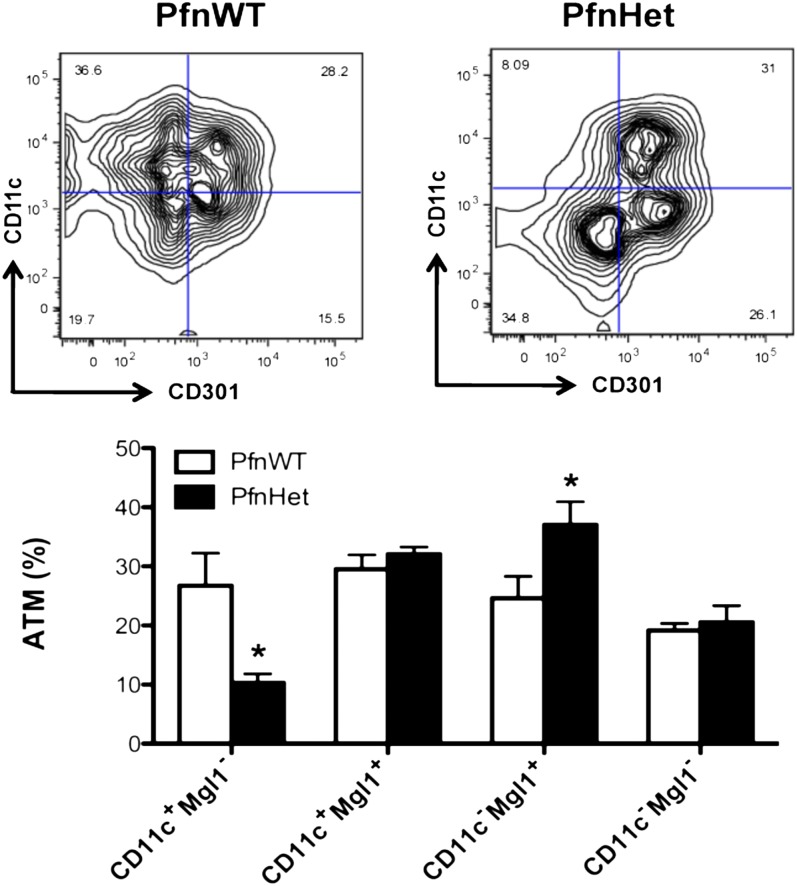
We found that ATMs from PfnHet had a significant percent decrease in the CD11c+ MGL1– subset and a conspicuous switch toward CD11c– MGL1+ compared with PfnWT (Fig. 6). In contrast, the expression of other markers of ATM activation such as MHC-II, Ly6C, and CD206 was not affected by pfn haploinsufficiency (Supplementary Fig. 5). These studies underscore that ATMs from PfnHet are biased toward an anti-inflammatory phenotype and implicate pfn as a potential key player in diet-induced ATM polarization.
FIG. 6.
Phenotype of ATM subsets in PfnWT and PfnHet on HFD. ATMs were characterized on the basis of staining for CD11c and CD301 (Mgl1). Compared with PfnWT, PfnHet showed a statistically significant percent reduction in CD11c+Mgl1– and an increase in CD11c–Mgl1+ ATMs (n = 8–9/group). *P < 0.05.
PfnHet mice exhibit decreased levels of systemic and WAT inflammatory mediators.
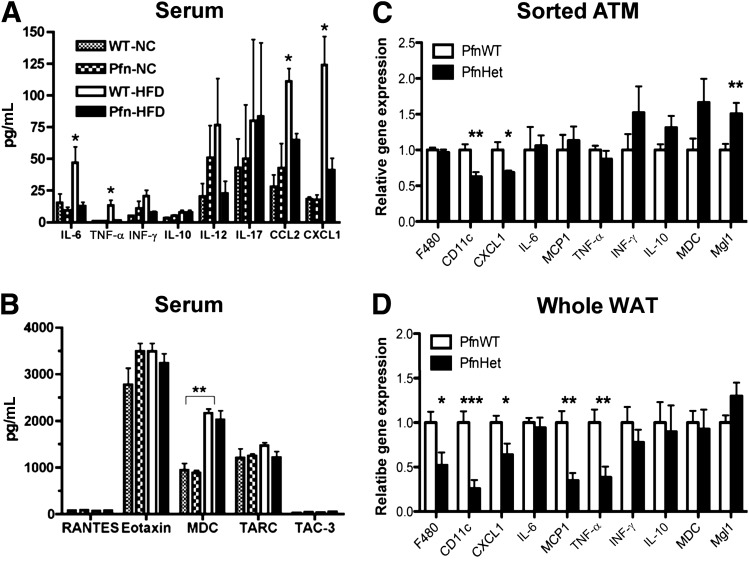
When assayed for prototypical mediators of inflammation, serum of PfnWT showed an HFD-induced increase in IL-1β (data not shown), tumor necrosis factor-α (TNF-α), IL-6, and chemokines CCL2 (MCP-1) and CXCL1, which contribute to the induction and progression of low-grade inflammation (34–36). These changes were largely prevented in PfnHet-HFD (Fig. 7A). Other chemokines were not affected by HFD or pfn haploinsufficiency (Fig. 7B). In addition, qRT-PCR from sorted ATMs reproduced the decrease in CXCL1 observed in the serum of PfnHet-HFD (Fig. 7C), whereas mRNA expression in the whole epididymal WAT mirrored the profile of such serum cytokines as CCL-2 (MCP-1), TNF-α, IL-10, and interferon-γ (IFN-γ) but not IL-6 (Fig. 7D). By contrast, adiponectin expression was unaltered in the WAT of the mice, suggesting that adiposity and adipocyte function are unaffected and the metabolic phenotypes of PfnHet mice are not explained by this adipokine (Supplementary Fig. 6). Additionally, these experiments confirmed the decreased expression of CD11c and Mgl1 in ATMs from PfnHet-HFD that was detected by flow cytometry analysis (Fig. 6). In aggregate, these findings demonstrate that PfnHet are protected against an HFD-induced increase in systemic and tissue proinflammatory mediators and suggest that blunting of HFD-induced inflammation in the adipose tissue of PfnHet accounts for anti-inflammatory effects observed systemically.
FIG. 7.
Serum and WAT cytokines and chemokines in PfnWT and PfnHet. A and B: Serum levels of candidate cytokines/chemokines were assayed by multiplex ELISA in fasted PfnWT and PfnHet fed NC or HFD for 12 weeks (n = 5–8/group). *P < 0.001; **P < 0.0001. C and D: qRT-PCR for chemokines and ATM signatures in sorted ATMs and whole epidydmal WAT from PfnWT and PfnHet fed HFD for 12 weeks (n = 9–12/group for ATM, n = 7–9/group for whole WAT). *P < 0.05; **P < 0.001; ***P < 0.0001.
PfnHet have preserved Treg frequency.
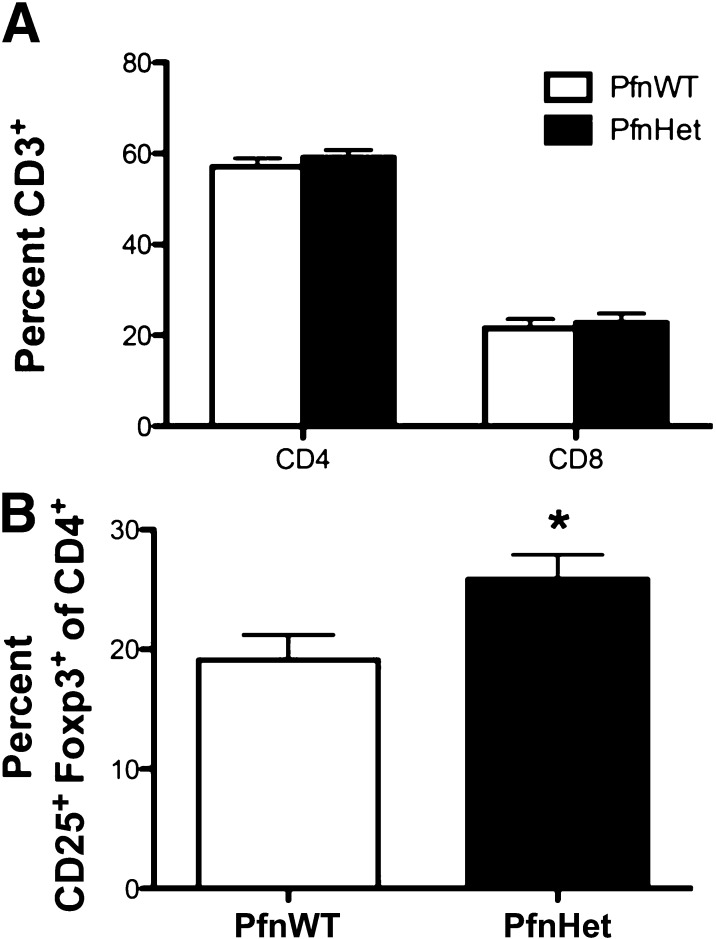
The decline of Treg in the expanding WAT has been invoked as an early event in the disruption of adipose tissue immune homeostasis, thus promoting inflammation and impaired insulin sensitivity (12–14). In keeping with this notion, the blunted inflammation and protection from diet-induced IR noted in PfnHet-HFD was accompanied by preserved frequency of Treg despite an unchanged number of CD4 and CD8 (PfnHet 25.9 ± 7.94 vs. PfnWT 19.1 ± 8.16) (Fig. 8).
FIG. 8.
Treg in epididymal WAT of PfnWT and PfnHet. A: Flow cytometry analysis of SVF showed a comparable percentage of CD4 and CD8 cells in PfnWT and PfnHet fed HFD for 12 weeks. B: Percent CD25+ Foxp3+ Treg within the CD4 pool was significantly higher in PfnHet than in PfnWT (n = 15). *P < 0.05.
DISCUSSION
The current study addressed the role of pfn in HFD-induced IR and inflammation. We have previously demonstrated that pfn is essential for atherosclerotic lesion formation (16) and that its protein levels are increased in human atheromas (22), in the aorta of diabetic rats, and in cultured ECs exposed to oxChol through recruitment of STAT3 to the pfn promoter (26). In the current study, we show that HFD also upregulates pfn mRNA expression in WAT and increased pfn protein levels both in adipocytes and in SVCs, which are enriched in ATMs. Another point of analogy with pfn regulation by oxChol was that HFD elicited STAT3 recruitment to the 5′-UTR of pfn in SVCs in ex vivo ChIP experiments. These studies suggest that pfn overexpression may be triggered by inflammatory mediators activating STAT3 and involved in obesity and IR, such as IL-6 (35), and/or by oxChol moieties resulting from HFD feeding.
Of importance, PfnHet displayed near normalization of HFD-induced glucose intolerance in association with a dramatic reduction in ATMs and proinflammatory cytokines at both the systemic and the WAT level. How does attenuated pfn expression exert these protective effects? At least three lines of evidence indicate that reduced inflammation in WAT accounts in part for the blunted inflammation and the insulin sensitive phenotype of PfnHet at the systemic level. First, HFD resulted in pfn overexpression in WAT but not in liver and striate muscle (Fig. 1A), thus implying that HFD-mediated pfn elevation plays a role mainly in WAT. Second, the similarity of the cytokine profile in whole WAT and serum of PfnHet-HFD (Fig. 7) points to WAT as a primary source for these mediators in the circulation. Third, the preserved frequency of Treg in PfnHet indicates a role of pfn in the development and/or activation of these cells, which regulate WAT immune homeostasis as well as glucose tolerance at the systemic level (13,14). In this context, PfnHet SVCs exhibited increased expression of IL-10, which is synthesized by Treg and M2 ATMs, and can protect adipocytes from the detrimental effects of TNF-α on insulin sensitivity (7) and production of proinflammatory cytokines in response to TNF-α (13) that attract monocytes to WAT (36). In PfnHet-HFD, the decrease in the absolute number of ATMs (Fig. 5) and the switch toward resident CD11c–Mgl1+ ATMs (Fig. 6) are in keeping with cues generated from Treg that keep WAT inflammation in check despite HFD. Whether and how pfn levels directly influence the commitment of T-helper cells toward Treg is a question that is actively being investigated in our laboratory.
Pfn plays a central role in cytoskeleton dynamics because in addition to being essential for conversion of G-actin to F-actin (18,19), it can interact with a growing family of proline-rich proteins (37) and, therefore, can integrate actin-dependent and -independent signaling cues. Thus, one could speculate that pfn could affect glucose tolerance by modifying cycling of Glut-4 to the surface in insulin-dependent tissue. However, 3T3-L1 moderate overexpression of PfnWT (approximately threefold over empty vector-transfected cells) did not affect Glut-4 distribution within the cell either basally or on insulin stimulation (G.R.R., unpublished observations).
In addition to its important and well-characterized intracellular functions associated with actin binding, pfn has been found at low concentrations in the circulation. It is seen in rodent models of glomerulonephritis (38) and correlates with the severity of atherosclerosis in patients with coronary artery disease (22); it could mediate paracrine communications between adipocytes and immune cells in the WAT microenvironment or systemically between WAT and other tissues targeted by HFD (e.g., the liver).
Studies have underscored the role of pfn and the actin cytoskeleton in general in human disease. Mutations in the pfn gene were identified as a causative factor in a subset of patients with familial amyotrophic lateral sclerosis (39) in which a potential impact of inflammation is increasingly appreciated (40). Additionally, changes in actin cytoskeleton genes in striate muscle, driven by the serum responsive factor, have been linked to IR in patients with T2D and normoglycemic patients with a positive family history of T2D (41). Finally, circulating pfn levels significantly correlate with severity of atherosclerosis in patients with cardiovascular disease with and without T2D (22).
Our studies provide compelling evidence for a role of pfn in HFD-induced IR and inflammation likely resulting from modulation of immune homeostasis within the WAT microenvironment. The elucidation of the effect of pfn levels and function in subjects with IR and T2D will help to validate pfn as a pathogenetic factor and may pave the way for new treatments for these prevalent conditions.
ACKNOWLEDGMENTS
This work was supported by grants to G.R.R. (JDRF Career Development Award 2-2004-609, Pilot & Feasibility Program Joslin Diabetes Center, and Pilot & Feasibility Program, Boston Obesity Nutrition Research Center), S.E.S. (R01-DK-51729), J.L. (ADA 1-10-BS-97), and grant P01-DK-036836 to Joslin Diabetes Center.
No potential conflicts of interest relevant to this article were reported.
G.R.R. researched data, contributed to the experimental design and discussion, and wrote the manuscript. M.P. researched data, contributed to the discussion, and reviewed/edited the manuscript. D.E. researched data. J.L. and S.E.S. contributed to the experimental design and discussion and reviewed and edited the manuscript. G.R.R. is the guarantor of this work and, as such, had full access to all the data in the study and takes responsibility for the integrity of the data and the accuracy of the data analysis.
The authors thank Cristine Bertochi and Daniel Jamieson for their excellent technical assistance. The authors also thank the Genetics/Genomics Core and Flow Cytometry Core at the Joslin.
Footnotes
This article contains Supplementary Data online at http://diabetes.diabetesjournals.org/lookup/suppl/doi:10.2337/db13-0050/-/DC1.
G.R.R. and M.P. contributed equally to this work.
D.E. is currently affiliated with the Division of Vascular and Endovascular Surgery, Department of Surgery, VA Medical Center, University of California, San Francisco, San Francisco, California.
REFERENCES
- 1.Goldfine AB, Fonseca V, Jablonski KA, Pyle L, Staten MA, Shoelson SE; TINSAL-T2D (Targeting Inflammation Using Salsalate in Type 2 Diabetes) Study Team. The effects of salsalate on glycemic control in patients with type 2 diabetes: a randomized trial. Ann Intern Med 2010;152:346–357 [DOI] [PMC free article] [PubMed] [Google Scholar]
- 2.Hotamisligil GS, Erbay E. Nutrient sensing and inflammation in metabolic diseases. Nat Rev Immunol 2008;8:923–934 [DOI] [PMC free article] [PubMed] [Google Scholar]
- 3.Hansson GK, Libby P. The immune response in atherosclerosis: a double-edged sword. Nat Rev Immunol 2006;6:508–519 [DOI] [PubMed] [Google Scholar]
- 4.Donath MY, Shoelson SE. Type 2 diabetes as an inflammatory disease. Nat Rev Immunol 2011;11:98–107 [DOI] [PubMed] [Google Scholar]
- 5.Shoelson SE, Lee J, Goldfine AB. Inflammation and insulin resistance. J Clin Invest 2006;116:1793–1801 [DOI] [PMC free article] [PubMed] [Google Scholar]
- 6.Romeo GR, Lee J, Shoelson SE. Metabolic syndrome, insulin resistance, and roles of inflammation - mechanisms and therapeutic targets. Arterioscler Thromb Vasc Biol 2012;32:1771–1776 [DOI] [PMC free article] [PubMed] [Google Scholar]
- 7.Lumeng CN, Bodzin JL, Saltiel AR. Obesity induces a phenotypic switch in adipose tissue macrophage polarization. J Clin Invest 2007;117:175–184 [DOI] [PMC free article] [PubMed] [Google Scholar]
- 8.Patsouris D, Li PP, Thapar D, Chapman J, Olefsky JM, Neels JG. Ablation of CD11c-positive cells normalizes insulin sensitivity in obese insulin resistant animals. Cell Metab 2008;8:301–309 [DOI] [PMC free article] [PubMed] [Google Scholar]
- 9.Shaul ME, Bennett G, Strissel KJ, Greenberg AS, Obin MS. Dynamic, M2-like remodeling phenotypes of CD11c+ adipose tissue macrophages during high-fat diet—induced obesity in mice. Diabetes 2010;59:1171–1181 [DOI] [PMC free article] [PubMed] [Google Scholar]
- 10.Lumeng CN, DelProposto JB, Westcott DJ, Saltiel AR. Phenotypic switching of adipose tissue macrophages with obesity is generated by spatiotemporal differences in macrophages subtypes. Diabetes 2008;57:3239–3246 [DOI] [PMC free article] [PubMed] [Google Scholar]
- 11.Lumeng CN, Deyoung SM, Bodzin JL, Saltiel AR. Increased inflammatory properties of adipose tissue macrophages recruited during diet-induced obesity. Diabetes 2007;56:16–23 [DOI] [PubMed] [Google Scholar]
- 12.Nishimura S, Manabe I, Nagasaki M, et al. CD8+ effector T cells contribute to macrophage recruitment and adipose tissue inflammation in obesity. Nat Med 2009;15:914–920 [DOI] [PubMed] [Google Scholar]
- 13.Feuerer M, Herrero L, Cipolletta D, et al. Lean, but not obese, fat is enriched for a unique population of regulatory T cells that affect metabolic parameters. Nat Med 2009;15:930–939 [DOI] [PMC free article] [PubMed] [Google Scholar]
- 14.Winer S, Chan Y, Paltser G. et al. Normalization of obesity-associated insulin resistance through immunotherapy. Nat Med 2009;15:921–929 [DOI] [PMC free article] [PubMed] [Google Scholar]
- 15.Hansson GK, Hermansson A. The immune system in atherosclerosis. Nat Immunol 2011;12:204–212 [DOI] [PubMed] [Google Scholar]
- 16.Romeo GR, Moulton KS, Kazlauskas A. Attenuated expression of profilin-1 confers protection from atherosclerosis in the LDL receptor null mouse. Circ Res 2007;101:357–367 [DOI] [PubMed] [Google Scholar]
- 17.Witke W, Sutherland JD, Sharpe A, Arai M, Kwiatkowski DJ. Profilin I is essential for cell survival and cell division in early mouse development. Proc Natl Acad Sci U S A 2001;98:3832–3836 [DOI] [PMC free article] [PubMed] [Google Scholar]
- 18.Kang F, Purich DL, Southwick FS. Profilin promotes barbed-end actin filament assembly without lowering the critical concentration. J Biol Chem 1999;274:36963–36972 [DOI] [PubMed] [Google Scholar]
- 19.Didry D, Carlier MF, Pantaloni D. Synergy between actin depolymerizing factor/cofilin and profilin in increasing actin filament turnover. J Biol Chem 1998;273:25602–25611 [DOI] [PubMed] [Google Scholar]
- 20.Tanaka Y, Minami Y, Mine S. et al. H-Ras signals to cytoskeletal machinery in induction of integrin-mediated adhesion of T cells. J Immunol 1999;163:6209–6216 [PubMed] [Google Scholar]
- 21.Théry C, Boussac M, Véron P, et al. Proteomic analysis of dendritic cell-derived exosomes: a secreted subcellular compartment distinct from apoptotic vesicles. J Immunol 2001;166:7309–7318 [DOI] [PubMed] [Google Scholar]
- 22.Caglayan E, Romeo GR, Kappert K, et al. Profilin-1 is expressed in human atherosclerotic plaques and induces atherogenic effects on vascular smooth muscle cells. PLoS One 2010;5:e13608. [DOI] [PMC free article] [PubMed] [Google Scholar]
- 23.Yarovinsky F, Zhang D, Andersen JF, et al. TLR11 activation of dendritic cells by a protozoan profilin-like protein. Science 2005;308:1626–1629 [DOI] [PubMed] [Google Scholar]
- 24.Beckman JA, Creager MA, Libby P. Diabetes and atherosclerosis: epidemiology, pathophysiology, and management. JAMA 2002;287:2570–2581 [DOI] [PubMed] [Google Scholar]
- 25.Clarkson MR, Murphy M, Gupta S, et al. High glucose-altered gene expression in mesangial cells. J Biol Chem 2002;277:9707–9712 [DOI] [PubMed] [Google Scholar]
- 26.Romeo G, Frangioni JV, Kazlauskas A. Profilin acts downstream of LDL to mediate diabetic endothelial cell dysfunction. FASEB J 2004;18:725–727 [DOI] [PubMed] [Google Scholar]
- 27.Romeo GR, Kazlauskas A. Oxysterol and diabetes activate STAT3 and control endothelial expression of profilin-1 via OSBP1. J Biol Chem 2008;283:9595–9605 [DOI] [PubMed] [Google Scholar]
- 28.Herrero L, Shapiro H, Nayer A, Lee J, Shoelson SE. Inflammation and adipose tissue macrophages in lipodystrophic mice. Proc Natl Acad Sci U S A 2010;107:240–245 [DOI] [PMC free article] [PubMed] [Google Scholar]
- 29.Romeo G, Liu WH, Asnaghi V, Kern TS, Lorenzi M. Activation of nuclear factor-kappaB induced by diabetes and high glucose regulates a proapoptotic program in retinal pericytes. Diabetes 2002;51:2241–2248 [DOI] [PubMed] [Google Scholar]
- 30.Gerhardinger C, Brown LF, Roy S, Mizutani M, Zucker CL, Lorenzi M. Expression of vascular endothelial growth factor in the human retina and in nonproliferative diabetic retinopathy. Am J Pathol 1998;152:1453–1462 [PMC free article] [PubMed] [Google Scholar]
- 31.Cinti S, Mitchell G, Barbatelli G, et al. Adipocyte death defines macrophage localization and function in adipose tissue of obese mice and humans. J Lipid Res 2005;46:2347–2355 [DOI] [PubMed] [Google Scholar]
- 32.McKnight AJ, Macfarlane AJ, Dri P, Turley L, Willis AC, Gordon S. Molecular cloning of F4/80, a murine macrophage-restricted cell surface glycoprotein with homology to the G-protein-linked transmembrane 7 hormone receptor family. J Biol Chem 1996;271:486–489 [DOI] [PubMed] [Google Scholar]
- 33.Radziuk J. Insulin sensitivity and its measurement: structural commonalities among the methods. J Clin Endocrinol Metab 2000;85:4426–4433 [DOI] [PubMed] [Google Scholar]
- 34.Hotamisligil GS, Shargill NS, Spiegelman BM. Adipose expression of tumor necrosis factor-alpha: direct role in obesity-linked insulin resistance. Science 1993;259:87–91 [DOI] [PubMed] [Google Scholar]
- 35.Fried SK, Bunkin DA, Greenberg AS. Omental and subcutaneous adipose tissues of obese subjects release interleukin-6: depot difference and regulation by glucocorticoid. J Clin Endocrinol Metab 1998;83:847–850 [DOI] [PubMed] [Google Scholar]
- 36.Kanda H, Tateya S, Tamori Y. et al. MCP-1 contributes to macrophage infiltration into adipose tissue, insulin resistance, and hepatic steatosis in obesity. J Clin Invest 2006;116:1494–1505 [DOI] [PMC free article] [PubMed] [Google Scholar]
- 37.Witke W. The role of profilin complexes in cell motility and other cellular processes. Trends Cell Biol 2004;14:461–469 [DOI] [PubMed] [Google Scholar]
- 38.Tamura M, Tanaka H, Yashiro A, et al. Expression of profilin, an actin-binding protein, in rat experimental glomerulonephritis and its upregulation by basic fibroblast growth factor in cultured rat mesangial cells. J Am Soc Nephrol 2000;11:423–433 [DOI] [PubMed] [Google Scholar]
- 39.Wu CH, Fallini C, Ticozzi N, et al. Mutations in the profilin 1 gene cause familial amyotrophic lateral sclerosis. Nature 2012;488:499–503 [DOI] [PMC free article] [PubMed] [Google Scholar]
- 40.Philips T, Robberecht W. Neuroinflammation in amyotrophic lateral sclerosis: role of glial activation in motor neuron disease. Lancet Neurol 2011;10:253–263 [DOI] [PubMed] [Google Scholar]
- 41.Jin W, Goldfine AB, Boes T, et al. Increased SRF transcriptional activity in human and mouse skeletal muscle is a signature of insulin resistance. J Clin Invest 2011;121:918–929 [DOI] [PMC free article] [PubMed] [Google Scholar]


