Abstract
Background
The pedunculopontine nucleus (PPN) is a brainstem structure with widespread connections to the basal ganglia. Despite the recent introduction of PPN deep brain stimulation (DBS) for the treatment of gait disorders, little is known about its physiology in humans.
Methods
We analyzed the discharge characteristics of single neurons in the PPN region in four patients and PPN local field potentials (LFP) in one patient, recorded during the course of DBS implantation. Two patients had Parkinson’s disease and two had non-sinemet responsive parkinsonism. Cell locations were plotted in the coordinate system of a human brainstem atlas.
Results
Fifty-six units in the PPN region were studied, of which 32 mapped to within PPN boundaries. The mean (+/− SD) discharge rate of neurons in the PPN was 23.2 (+/− 15.6) Hz. Spontaneous neuronal firing rate and burst discharge rate were significantly different between neurons in the region dorsal to PPN and those in the PPN. Responses to passive movement of contralateral and ipsilateral limbs were found. Theta and beta band oscillations were present in the PPN LFP.
Conclusion
PPN discharge characteristics may prove useful in the electrophysiologic identification of PPN during DBS implantation surgery.
Keywords: Parkinson’s disease, neurophysiology, gait, neurosurgery
INTRODUCTION
The pedunculopontine nucleus (PPN) is a brainstem structure located posterolateral to the decussation of the superior cerebellar peduncles.1, 2 It is the most inferior structure in the brain that has widespread connections to the basal ganglia (BG). 3-6 Recently, the PPN has attracted interest as a potential DBS target to improve freezing of gait (FOG). Low frequency PPN DBS (5-20 Hz) in parkinsonian nonhuman primates (NHPs) helps to alleviate akinesia in conjunction with levodopa treatment.7 Small, open-label, non-blinded clinical studies have demonstrated that PPN DBS can improve akinesia and FOG in patients with advanced Parkinson’s disease 8-10 or with progressive supranuclear palsy.11
The boundaries of the PPN cannot be well visualized with present anatomic imaging techniques, although surrounding nuclei can be seen using specific MRI protocols.2 Thus, physiologic localization may prove useful in future surgical trials. To date, there have only been two studies of PPN single unit physiology in NHPs 12, 13 and one in humans.14 One additional human study examined the PPN local field potential (LFP) through externalized DBS electrodes.15 Here, we report the characteristics of 56 PPN region neurons from four patients undergoing microelectrode guided DBS electrode placement in the awake state. The PPN LFP from one patient is also described. We anatomically localized recording sites using the DBS electrode location on postoperative MRI as a “registration mark.” We then plotted recording locations on a high resolution atlas of the human brainstem1 and compared the characteristics of neurons located within the PPN to those dorsal to the PPN.
METHODS
Patients were recruited from the movement disorders clinics of the University of California, San Francisco. The study was approved by the UCSF Committee for Human Research.
Surgical procedure and microelectrode recording
The subject’s head was fixed in a stereotactic headframe (Leksell G, Elekta, Atlanta, GA) and magnetic resonance imaging (MRI) of the brain was obtained on the morning of surgery to visualize the anatomic target.16 Images were imported into a stereotactic surgical planning software package (Framelink version 4.1; Medtronic-SNT, Boulder, CO). The initial anatomic target was selected as a point superolateral to the decussation of the superior cerebellar peduncles (dSCP) on T2 weighted fast spin echo images. The target coordinates were 6 to 7.5 mm lateral, 13 to 15 mm inferior, and 15 to 17 mm posterior with respect to the midcommissural point. With respect to the brainstem-based “B-F” coordinate system, the target coordinates were 6 to 7.5 mm lateral, 3 to 5 mm anterior to B, and 13 to 16 mm rostral to the B-F plane.2 The exact target was adjusted so as to be 2 to 3 mm from the lateral edge of the brainstem at the axial level of the pontomesencephalic junction.
A single microelectrode penetration directed toward the target was performed. Microelectrodes were advanced into the brain using a microdrive (FHC or Elekta, Inc.). We screened neurons for audible responses to passive (investigator-initiated) movements of the contralateral or ipsilateral shoulder, elbow, wrist, hip, knee, and foot. A subset of the neurons that showed movement-related discharge on this subjective screen were selected for further quantitative analysis as described below.
In one patient, local field potentials were recorded from the cylindrical contact (1.0 mm height, approximately 0.6 mm diameter) located on the guide cannula surrounding the microelectrode. Recordings were made during five alternating periods of rest and voluntary movement of the contralateral hand, elbow, shoulder, foot, or jaw, each epoch lasting 3-5 seconds (behavioral paradigm similar to that described by Miller et al.,17 designed to examine cortical beta-band oscillatory activity at rest and during movement). The LFP was bandpass filtered at 1-500 Hz, amplified x7000, and sampled at 1 KHz.
Data analysis
Digitized spike trains were imported into off-line spike sorting software (Plexon, Inc., Dallas TX) for discrimination of single populations of action potentials by cluster-cutting in principal components space. Spike times were used to calculate discharge rate, bursting, and oscillatory activity in the 0-200 Hz range. Three methods for burst detection that have been previously described were used: (1) The “burst index,” 18 (2) the “L” statistic,19, 20 and (3) the Poisson “surprise” method.21, 22 Oscillations in the spike train at 0-200 Hz were evaluated using the “spike shuffling” method.23 Neuronal data were included in this study only if single unit action potentials could be discriminated with a high degree of certainty, as indicated by the presence of a clear refractory period in the interspike interval (ISI) histogram, and if spontaneous activity was recorded for greater than 20 seconds. Normalized action potential widths were determined by dividing the widths of the largest component of the waveform (positive or negative) by the height or depth of the same component.
Quantitative analysis of peri-movement discharge
A subset of neurons that showed a reproducible response to passive movement in the initial subjective multi-joint screening was selected for quantitative investigation, focusing on the joint that produced the maximal modulation of discharge on the initial screen. During passive contralateral limb movement across a single joint, single unit discharge was digitized simultaneously with the voltage output of a triaxial accelerometer. Statistically significant increases or decreases in neuronal activity were determined by comparison with the mean and variance of the spike density function (SDF) in a pre-stimulus baseline period (−1.5 to −0.5 sec). The analysis period lasted 1500 msec from −0.5 to 1.0 sec. A significant response was defined as a deviation from the mean baseline firing rate that exceeded three times standard deviation (3xSD) of the baseline for at least 50 msec.
Analysis of LFP oscillations
For PPN LFPs, power spectral density (PSD) was calculated for 2 second data segments, starting 0.5 sec after movement or rest onset. A 512 point fast Fourier transform (FFT) (for 1.95 Hz frequency resolution) with Hanning window and 50% overlap was used (Matlab function pwelch). For each movement condition, we averaged PSD across 5 epochs. For plotting, PSD during movement was normalized to PSD during the rest epoch, at each frequency point. Five frequency bins (4-12Hz, 13-21Hz, 22-30Hz, 31-55Hz, 76-100Hz) were selected to study distribution of power.
Assignment of cell location
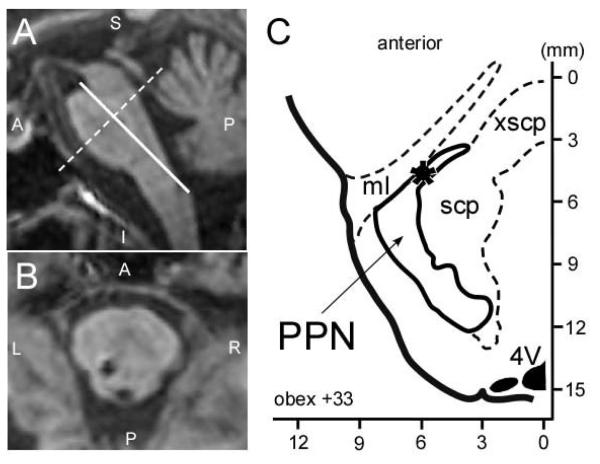
Lead tip and entry locations from postoperative MRI were used to plot the coordinates of all recorded cells with respect to the Paxinos Atlas of the Human Brainstem (Figure 1).1 The Paxinos atlas has a detailed histological delineation of the PPN and has been used by other groups interested in PPN surgery.2
Figure 1.
Determination of electrode tip location in the coordinates system of the Paxinos Atlas of the Human Brainstem1. (A) Post-operative sagittal plane MRI from case 4, reformatted in Paxinos atlas coordinates. The origin (0,0,0) is at the obex. (B) Same MRI as (A), reformatted in the axial plane 33 mm dorsal to the obex, showing DBS lead location at this axial level. (C) Drawing of the corresponding slice from the Paxinos Atlas of the Human Brainstem1 with lead location marked (*). The PPN and major surrounding structures have been traced from the Paxinos atlas.
Statistical analysis
Equivalence of mean discharge parameters were assessed using the Mann–Whitney test for unpaired data. The chi-square test was used to assess differences between neurons in PPN versus regions adjacent to PPN.
RESULTS
Patient characteristics
Patient characteristics are summarized in Table 1. The study population consisted of 4 patients, 2 with PD, 1 with atypical parkinsonism and 1 with primary progressive freezing gait (PPFG) disorder. The LFP recordings were performed in patient 4.
Table 1.
Patient characteristics
| Subject # |
Age at surgery |
diagnosis | Duration of symptoms (yrs) |
Prior neurosurgical procedures |
Side implanted (R, L, or both) |
Baseline UPDRS III ON/OFF medication (OFF DBS) |
|---|---|---|---|---|---|---|
| 1 | 74 | PPFG | 4 | none | both | 17/14 |
| 2 | 76 | PD | 13 | Bilateral STN-DBS |
R | 30/22 |
| 3 | 62 | PD | 20 | Bilateral STN-DBS |
R | 53/43 |
| 4* | 73 | Atypical parkinsonism |
7 | none | L | 41/31 |
Neuronal discharge parameters from this patient were not included in the grouped means.
Lead locations
Final electrode tip locations for all patients are given in Table 2, both with respect to a standard stereotactic coordinate system (AC-PC coordinates, left columns) and with respect the brainstem-based coordinate system used in the Paxinos Atlas of the Human Brainstem,1 right columns. Positive approach angles in the sagittal projection indicate an anterior approach relative to lead tip (in the coronal projection, positive angles indicate entry from the right). All DBS leads traversed the axial planes containing the PPN according to Paxinos coordinates.
Table 2.
Tip location and angulation of electrodes in two coordinates systems
| Case/side | Coordinates with respect to AC-PC midpoint | Scaled coordinates with respect to Paxinos atlas1 |
||||||||
|---|---|---|---|---|---|---|---|---|---|---|
|
|
||||||||||
| Tip coordinates | Approach angle* | Tip coordinates | Approach angle** | |||||||
|
|
||||||||||
| Lat | AP | Vert | Sagittal | Coronal | Lat | AP | Vert | Sagittal | Coronal | |
| Pt 1/ R | 6.3 | −15.8 | −15.3 | 29.6 | 25.1 | 6.4 | −6.0 | 33.2 | −1.9 | 25.1 |
| Pt 1/ L | −5 | −16.8 | −17.8 | 34.1 | −25.5 | −6.5 | −4.9 | 33.2 | −5.1 | −25.5 |
| Pt 2/ R | 5.8 | −17.4 | −18.6 | 35.1 | 23.1 | 6.0 | −6.0 | 31.0 | −0.9 | 23.1 |
| Pt 3/ R | 5.7 | −16.7 | −17.2 | 31.5 | 26.1 | 7.5 | −4.0 | 28.7 | −5.6 | 26.1 |
| Pt 4/ L** | −4.4 | −19.4 | −18.3 | 21.3 | −27.2 | −5.1 | −3.9 | 31.0 | −16.8 | −27.2 |
Approach angle is with respect to a line perpendicular to the AC-PC line, in the midsagittal plane
Approach angle is with respect to the Z-axis defined in the Atlas of the Human Brainstem 1.
Spontaneous discharge characteristics
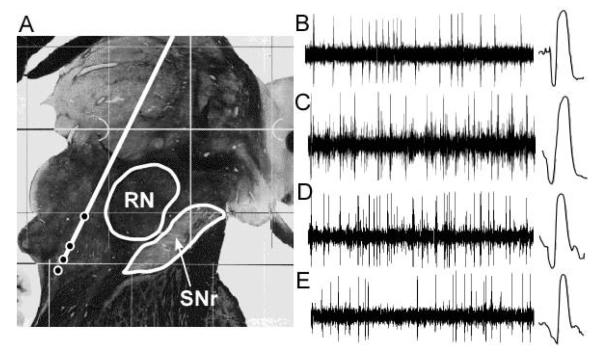
Representative neuronal recordings in the PPN region are shown in Figure 2 and grouped data are described in Table 3. Mean spontaneous discharge rate for neurons within PPN was 23.2 +/− 15.6, while the mean rate for neurons in the region dorsal to PPN was 35.2 /− 17.8. This difference was statistically significant (P<0.01). Bursting discharge was more prevalent in PPN compared with the region dorsal to PPN by all three standard measures of burst discharge (P<0.001).
Figure 2.
Examples of single unit recordings obtained at various distances above and within the pedunculopontine nucleus from case 1. (A) Average electrode trajectory superimposed on parasagittal section from the Schaltenbrand and Warren human brain atlas, 6.5 mm from midline. Circles along the trajectory indicate microelectrode recording location for the example recordings. (B–E) Examples of neuronal recordings. One second of data is shown on the left, with an expanded timescale (2 ms) trace of a single action potential at right. (B) Obex +39.5 mm. (C) Obex +35.6 mm. (D) Obex +33.7 mm. (E) Obex +32.2 mm. RN, red nucleus; SNr, substantia nigra pars reticulata.
Table 3.
Spontaneous neuronal discharge characteristics as a function of cell location
| Neuron type/diagnosis |
N | Mean spont DC rate |
SD spont DC rate |
% sig oscil |
Median frequency of sig oscil |
prop burst discharges |
Burst index |
L-stat |
|---|---|---|---|---|---|---|---|---|
| dorsal to PPN | 18 | 35.2 | 17.8 | 44.4 | 15.4 | 0.06 | 3.48 | 5.1 |
| Within PPN | 32 | 23.2 | 15.6 | 18.8 | 80.1 | 0.26 | 16.6 | 7.5 |
| p-value* | <0.01 | NS | <0.001 | <0.001 | <0.001 | |||
| Narrow AP | 50 | 26.1 | 16.7 | 32.0 | 36.6 | 0.21 | 11.1 | 6.9 |
| Wide AP | 6 | 28.4 | 21.2 | 16.7 | 106.5 | 0.26 | 23.3 | 6 |
| p-value* | NS | NS | NS | NS | NS | |||
| PD | 26** | 25.2 | 18.4 | 27.0 | 30.3 | 0.26 | 11.9 | 7.3 |
| PPFG | 24** | 27.1 | 14.8 | 37.5 | 69.8 | 0.16 | 10.2 | 6.4 |
| p-value* | NS | NS | NS | NS | NS |
Determined using the Mann-Whitney U test. NS = no significance
Only narrow action potential neurons included.
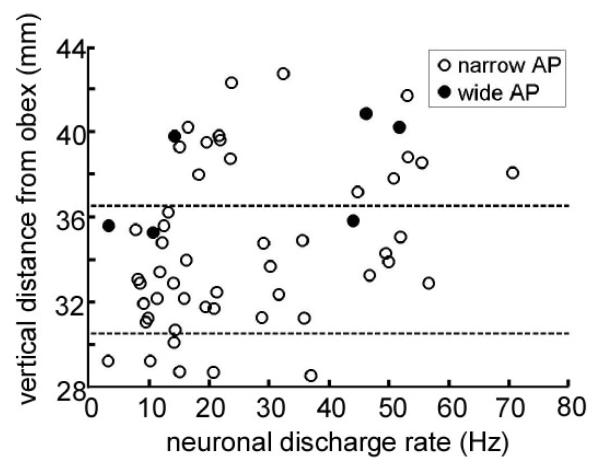
Neurons in the PPN regions had a range of action potential morphologies. Neurons with AP width less than 250 msec/volt appeared to form an approximate Gaussian distribution and were considered to be narrow action potential neurons. The six neurons with wider APs were considered to be wide action potential neurons. In Figure 3, neuronal firing rate and action potential morphology are plotted with respect to vertical distance from the obex. Wide action potential neurons were seen in the region dorsal to PPN, and in the dorsal part of PPN itself, but not in the inferior regions. Although the distribution is wide, the graph shows that neuronal firing tended to decrease with greater depth in the PPN region.
Figure 3.
Spontaneous neuronal discharge rate of all cells, plotted as a function of their normalised distances from the obex. The boundaries of the pedunculopontine nucleus, based on the Paxinos Atlas of the Human Brainstem,1 are indicated by dotted lines. Open circles, narrow action potential (AP) widths; closed circles, wide action potential widths.
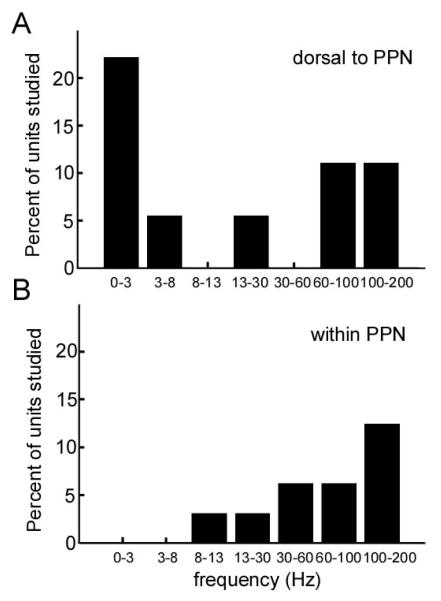
The frequency distribution of oscillations in spontaneous discharge is shown in Figure 4. In the region dorsal to PPN, 44% of neurons had significant oscillatory activity, while 19% of PPN neurons showed oscillatory activity. This difference did not reach statistical significance (chi-square). Oscillation frequencies within PPN tended to be higher than those dorsal to PPN, but this difference did not reach statistical significance.
Figure 4.
Distribution of oscillatory frequencies in spontaneous discharge. (A) Dorsal to PPN. (B) Within PPN.
Passive-movement related discharge
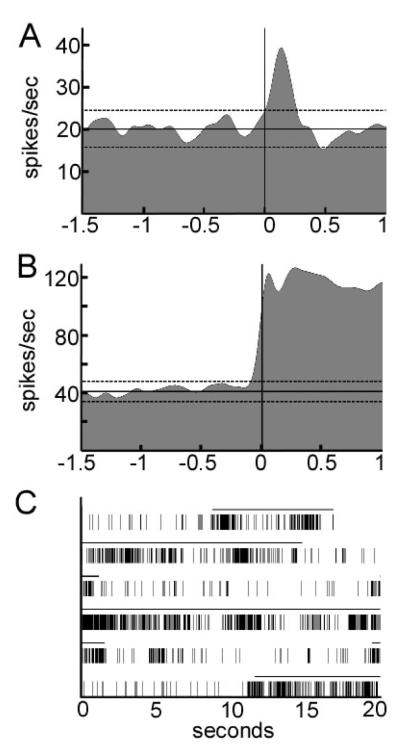
During the rapid, subjective, passive-movement screening (using audible change in discharge rate as the criteria for movement response), 43.2 % of units (16/37) had an apparent response to contralateral movement of a limb. Of these, 15 unit recordings had sufficient stability and signal amplitude to allow quantification of movement responses using peri-event SDFs calculated over at least four movement repetitions. Four units were studied during ipsilateral as well as contralateral movements. The results are summarized in Table 4, and examples of SDFs for two types of responses are shown in Figures 5A and 5B. Thirteen of the 15 neurons showed a statistically significant change in discharge rate at the onset of movement. The mean (+/− SD) latency from onset of movement (initial accelerometer deflection) to the onset of the change in neuronal activity was 48 +/− 230 milliseconds. Cells responding to passive movement were not specifically localized to PPN, as some were found to map to the region dorsal or ventral to the PPN. Most units responded to passive movement with a brief (less than 500 msec) phasic change in discharge. Most units responded with phasic increases in discharge, but some had a decrease response only. Typically, strong increase responses were followed by smaller “rebound” decrease responses; these were scored in Table 4 as increase responses. In four units (two units dorsal to PPN, one in PPN and one ventral to PPN), the change in discharge with movement persisted until the joint was returned to its baseline position (Figure 5B). Of the four units tested for both ipsilateral and contralateral movement, one showed a phasic response to both types, one a phasic response to contralateral movement only, and one a phasic response to ipsilateral movement only (the fourth showed no statistically significant response).
Table 4.
Characterization of responses to passive movements
| Cell location |
Cell number |
Contralateral passive movement* |
Ipsilateral passive movement* |
Duration of response (shorter than 1 sec) or longer than 1 sec) |
Joint studied |
|---|---|---|---|---|---|
| Dorsal to PPN |
1 | + /− | NT | long | wrist |
| 2 | +/+ | NT | short | elbow | |
| 3 | + /+ | NT | short | hip | |
| 4 | − /+ | NT | long | wrist | |
| 5 | +/+ | +/0 | short | elbow | |
| 6 | +/0 | NT | short | elbow | |
| 7 | +/0 | 0/0 | short | elbow | |
| 8 | 0/0 | +/0 | short | hip | |
| Within PPN | 9 | −/0 | NT | short | elbow |
| 10 | −/− | NT | short | hip | |
| 11 | +/− | NT | long | hip | |
| Ventral to PPN |
12 | +/0 | NT | short | hip |
| 13 | 0/0 | 0/0 | short | elbow | |
| 14 | 0/0 | NT | short | elbow | |
| 15 | +/− | NT | long | Shoulder |
First symbol is the response to flexion, adduction or internal rotation, and the second symbol is the response to extension, abduction, or external rotation. A (+) denotes a movement related increase in discharge, a (−) denotes a movement-related decrease, and 0 denotes no change. NT=not tested
Figure 5.
Examples of neuronal responses to passive joint movements and eye opening in the region of the PPN. (A) Perimovement spike density function illustrating a brief, phasic response to joint displacement (39.6 mm dorsal to obex). The initial accelerometer deflection occurred at time zero. Responses to 10 movement repetitions were averaged. Horizontal dotted lines represent threshold of significance. (B) Perimovement spike density function illustrating a prolonged response to joint displacement (38.8 mm dorsal to obex). Responses to 12 movement repetitions were averaged. (C) Raster plot of neuronal discharge (dorsal to pedunculopontine nucleus) showing a dramatic increase in activity with eye opening (40.7 mm dorsal to obex). The solid line above the raster marks the epochs when the eyes were open.
Finally, one unit (that did not respond to any limb movement), showed a dramatic, prolonged increase in discharge with eye opening that reversed immediately with eye closing (Figure 5C). This unit mapped to the midbrain tegmentum dorsal to the PPN.
Local field potential recording
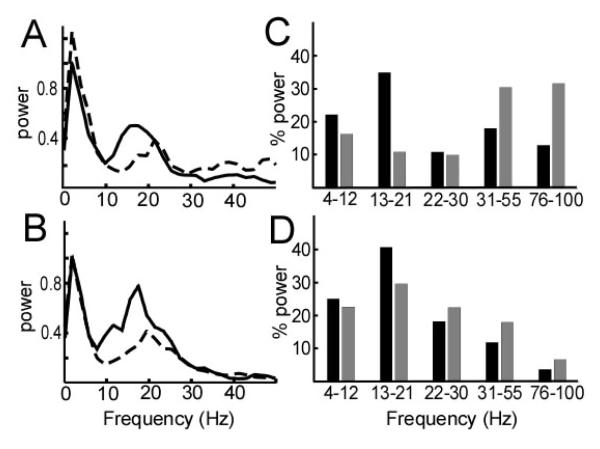
Figure 6 shows the power spectral density of the LFP at two points in the PPN region in patient 4: 37.8 mm from obex (dorsal to PPN) and 33.6 mm from obex (within the PPN). In both regions, there were spectral power peaks in the theta and beta ranges (Figure 6A, B). However, the percentage of power in the low beta range (13-21 Hz) increased from 35.2% to 40.8 % in the rest period, and 11.1% to 29.8% in the movement period, as the electrode was advanced into the PPN (Figure 6C, D).
Figure 6.
Power spectral density of the local field potential recorded in the region of the pedunculopontine nucleus (PPN) in subject 4, during alternating rest and voluntary contralateral elbow movement (solid line=rest, dotted line=movement). (A) Recording at depth of 37.8 mm in the Paxinos atlas coordinates (above the PPN). (B) Recording at depth 33.6 mm in the Paxinos atlas coordinates (in the PPN). (C, D) Percentage of power in theta-alpha, low beta, high beta, low gamma and high gamma frequency bands recorded dorsal to PPN (same data as in (A)) or within the PPN (same data as in (B)). Solid bar, rest; grey bar, movement.
DISCUSSION
The present study adds to the small existing literature on the electrophysiology of the PPN region in humans with movement disorders.14, 15 We used a detailed atlas of the human brainstem1 to plot locations of recorded cells and to show that the PPN can be distinguished from the region dorsal to it by spontaneous discharge rate and measures of bursting discharge. Response to passive movement of contralateral limbs did not distinguish the PPN from surrounding regions.
Discharge rates and action potential morphology
The mean firing rate for spontaneous PPN discharge in this series of patients was similar to previous findings from human and non-human primate studies.12-14 As in prior studies, we found a wide distribution of action potential widths in the PPN region, consistent with the known cellular heterogeneity in this region. Based on histological studies in rats, the PPN contains two different histological cell types: cholinergic and non-cholinergic. It has been proposed previously that wide action potential units are cholinergic.14, 24 In our study, there were relatively few neurons in the PPN region with wide action potentials, whereas in normal NHPs, the proportion of wide action potential neurons was higher.12 This difference could be explained by the known loss of cholinergic PPN neurons in PD patients as well as other neurodegenerative disorders affecting gait.25, 26 Two previous studies have made the observation that narrow action potential units have a higher firing rate than wide action potential units.12, 14 Our results did not support this finding, but the small number of wide action potential units collected in our study may explain the lack of significant differences in firing rates between the two neuron types in our data.
Bursting in spontaneous discharge
We found that PPN neurons had significantly more burst discharges, by multiple statistical measures of bursting, compared with neurons from the region dorsal to PPN. This finding is consistent with the observation by Weinberger et al. 14 of more “bursty”cells within PPN than above or below PPN. In a variety of movement disorders, basal ganglia neurons show an increased tendency to fire in bursts.27 Given the large afferent input to the PPN from the basal ganglia nuclei, it seems possible that PPN bursting in patients with movement disorders is transmitted via its basal ganglia inputs. Of note, the available studies of PPN in NHPs do not describe prominent bursting activity, although statistical measures of bursting were not used.12, 13 Alternatively, bursting may also reflect intrinsic membrane properties of PPN cells, as has been demonstrated with intracellular recordings in rodent slice preparations.24, 28
Movement-related activity
Previous studies of PPN physiology have looked for movement-related changes during a variety of movement paradigms, including passive movement, active movement, and visually-guided saccades.12-14 In spite of the wide range of movement paradigms, all studies including ours showed a roughly similar proportion of cells (40-60%) that respond to movement. Here, we found movement related responses to all body parts tested. Although most responses were of short duration as previously described, we did find neurons with prolonged responses to joint movements that would appear to encode joint position rather than movement. Since such responses are rare in the basal ganglia, it is possible that this type of response reflect sensory input to the PPN from the spinal cord.29 We also found neurons with responses to ipsilateral movements, consistent with the known reciprocal connections of the left and right PPN. Ipsilateral movement related responses in PPN were found in the NHP,12 but have not been previously documented in humans.14 Finally, our study is consistent with the finding by Weinberger et al. 14 that the presence of movement-related activity in the region of the PPN is not restricted to the PPN proper.
Local field potentials and oscillatory activity
We found both theta and beta peaks in the LFP power spectral density, with a slight increase in beta activity as the electrode entered the PPN proper. Beta desynchronization occurred during movement. Weinberger et al. studied LFPs recorded from microelectrodes and similarly found beta oscillations that increased in power within PPN proper.14 Given the presence of strong beta synchrony in the basal ganglia in the parkinsonian state,30 it is possible that PPN beta oscillations are transmitted from the basal ganglia. Consistent with Weinberger et al., we found that beta oscillatory power may be of localizing value during surgical navigation in the PPN region. Of note, one other study of PPN oscillatory activity, recorded through externalized bipolar macroelectrodes, showed only low frequency activity without a prominent beta peak.15 Differences between that study and ours may be a product of our use of an alternating rest/movement paradigm designed to maximize beta activity in the resting condition.17
Finally, neither our study nor that of Weinberger et al., found prominent beta oscillations in single unit discharge.14 This suggests that beta range activity seen in the LFP is a property more reflective of neuronal synchrony rather than individual neuronal discharge. Our study found some single units with oscillatory activity at frequencies above 100Hz. Most of those units had bursts with very high intraburst firing rates, which may account for high frequency oscillations in those units.
Implications for surgical navigation in the PPN
In the more established targets for DBS in movement disorders, such as the STN, GPi, and motor thalamus, single cell discharge characteristics have been well described. Neuronal physiology can be used to accurately map the borders of these nuclei, as well as localize within the motor territory by the known somatotopy of movement-related responses. In contrast, the role of MER in the PPN is not well established. Although we show statistical differences in bursting and firing rate between PPN and the region dorsal to it, these differences are not so obvious as to allow easy identification of the entry into PPN on a given MER penetration. Techniques for MRI based targeting of PPN are evolving, with a recent article showing MR visualization of many of the structures that form the PPN boundaries, as well as documenting the accuracy of a brainstem based coordinate system for stereotactic targeting.2 The relative utility of physiological versus anatomic targeting of PPN remains to be determined.
REFERENCES
- 1.Paxinos G, Huang X. Atlas of the Human Brainstem. Academic Press; London: 1995. [Google Scholar]
- 2.Zrinzo L, Zrinzo LV, Tisch S, et al. Stereotactic localization of the human pedunculopontine nucleus: atlas-based coordinates and validation of a magnetic resonance imaging protocol for direct localization. Brain. 2008;131(Pt 6):1588–1598. doi: 10.1093/brain/awn075. [DOI] [PubMed] [Google Scholar]
- 3.DeVito JL, Anderson ME. An autoradiographic study of efferent connections of the globus pallidus in Macaca mulatta. Experimental brain research Experimentelle Hirnforschung. 1982;46(1):107–117. doi: 10.1007/BF00238104. [DOI] [PubMed] [Google Scholar]
- 4.Harnois C, Filion M. Pallidofugal projections to thalamus and midbrain: a quantitative antidromic activation study in monkeys and cats. Experimental brain research Experimentelle Hirnforschung. 1982;47(2):277–285. doi: 10.1007/BF00239387. [DOI] [PubMed] [Google Scholar]
- 5.Nauta WJ, Mehler WR. Projections of the lentiform nucleus in the monkey. Brain research. 1966;1(1):3–42. doi: 10.1016/0006-8993(66)90103-x. [DOI] [PubMed] [Google Scholar]
- 6.Noda T, Oka H. Nigral inputs to the pedunculopontine region: intracellular analysis. Brain research. 1984;322(2):332–336. doi: 10.1016/0006-8993(84)90128-8. [DOI] [PubMed] [Google Scholar]
- 7.Jenkinson N, Nandi D, Miall RC, Stein JF, Aziz TZ. Pedunculopontine nucleus stimulation improves akinesia in a Parkinsonian monkey. Neuroreport. 2004;15(17):2621–2624. doi: 10.1097/00001756-200412030-00012. [DOI] [PubMed] [Google Scholar]
- 8.Mazzone P, Lozano A, Stanzione P, et al. Implantation of human pedunculopontine nucleus: a safe and clinically relevant target in Parkinson’s disease. Neuroreport. 2005;16(17):1877–1881. doi: 10.1097/01.wnr.0000187629.38010.12. [DOI] [PubMed] [Google Scholar]
- 9.Plaha P, Gill SS. Bilateral deep brain stimulation of the pedunculopontine nucleus for Parkinson’s disease. Neuroreport. 2005;16(17):1883–1887. doi: 10.1097/01.wnr.0000187637.20771.a0. [DOI] [PubMed] [Google Scholar]
- 10.Stefani A, Lozano AM, Peppe A, et al. Bilateral deep brain stimulation of the pedunculopontine and subthalamic nuclei in severe Parkinson’s disease. Brain. 2007;130(Pt 6):1596–1607. doi: 10.1093/brain/awl346. [DOI] [PubMed] [Google Scholar]
- 11.Moro E, Zadikoff C, Alkhairallah T, et al. Unilateral Pedunculopontine Stimulation in Progressive Supranuclear Palsy and Parkinson’s Disease: Preliminary Data (abstract) American Academy of Neurology. 2007 [Google Scholar]
- 12.Matsumura M, Watanabe K, Ohye C. Single-unit activity in the primate nucleus tegmenti pedunculopontinus related to voluntary arm movement. Neuroscience research. 1997;28(2):155–165. doi: 10.1016/s0168-0102(97)00039-4. [DOI] [PubMed] [Google Scholar]
- 13.Kobayashi Y, Inoue Y, Yamamoto M, Isa T, Aizawa H. Contribution of pedunculopontine tegmental nucleus neurons to performance of visually guided saccade tasks in monkeys. Journal of neurophysiology. 2002;88(2):715–731. doi: 10.1152/jn.2002.88.2.715. [DOI] [PubMed] [Google Scholar]
- 14.Weinberger M, Hamani C, Hutchison WD, Moro E, Lozano AM, Dostrovsky JO. Pedunculopontine nucleus microelectrode recordings in movement disorder patients. Experimental brain research Experimentelle Hirnforschung. 2008;188(2):165–174. doi: 10.1007/s00221-008-1349-1. [DOI] [PubMed] [Google Scholar]
- 15.Androulidakis AG, Mazzone P, Litvak V, et al. Oscillatory activity in the pedunculopontine area of patients with Parkinson’s disease. Experimental neurology. 2008;211(1):59–66. doi: 10.1016/j.expneurol.2008.01.002. [DOI] [PubMed] [Google Scholar]
- 16.Starr PA. Placement of deep brain stimulators into the subthalamic nucleus or Globus pallidus internus: technical approach. Stereotactic and functional neurosurgery. 2002;79(3-4):118–145. doi: 10.1159/000070828. [DOI] [PubMed] [Google Scholar]
- 17.Miller KJ, Leuthardt EC, Schalk G, et al. Spectral changes in cortical surface potentials during motor movement. J Neurosci. 2007;27(9):2424–2432. doi: 10.1523/JNEUROSCI.3886-06.2007. [DOI] [PMC free article] [PubMed] [Google Scholar]
- 18.Hutchison WD, Lang AE, Dostrovsky JO, Lozano AM. Pallidal neuronal activity: implications for models of dystonia. Annals of neurology. 2003;53(4):480–488. doi: 10.1002/ana.10474. [DOI] [PubMed] [Google Scholar]
- 19.Kaneoke Y, Vitek JL. Burst and oscillation as disparate neuronal properties. Journal of neuroscience methods. 1996;68(2):211–223. doi: 10.1016/0165-0270(96)00081-7. [DOI] [PubMed] [Google Scholar]
- 20.Goldberg JA, Boraud T, Maraton S, Haber SN, Vaadia E, Bergman H. Enhanced synchrony among primary motor cortex neurons in the 1-methyl-4-phenyl-1,2,3,6-tetrahydropyridine primate model of Parkinson’s disease. J Neurosci. 2002;22(11):4639–4653. doi: 10.1523/JNEUROSCI.22-11-04639.2002. [DOI] [PMC free article] [PubMed] [Google Scholar]
- 21.Legendy CR, Salcman M. Bursts and recurrences of bursts in the spike trains of spontaneously active striate cortex neurons. Journal of neurophysiology. 1985;53(4):926–939. doi: 10.1152/jn.1985.53.4.926. [DOI] [PubMed] [Google Scholar]
- 22.Wichmann T, Bergman H, Starr PA, Subramanian T, Watts RL, DeLong MR. Comparison of MPTP-induced changes in spontaneous neuronal discharge in the internal pallidal segment and in the substantia nigra pars reticulata in primates. Experimental brain research Experimentelle Hirnforschung. 1999;125(4):397–409. doi: 10.1007/s002210050696. [DOI] [PubMed] [Google Scholar]
- 23.Rivlin-Etzion M, Ritov Y, Heimer G, Bergman H, Bar-Gad I. Local shuffling of spike trains boosts the accuracy of spike train spectral analysis. Journal of neurophysiology. 2006;95(5):3245–3256. doi: 10.1152/jn.00055.2005. [DOI] [PubMed] [Google Scholar]
- 24.Takakusaki K, Shiroyama T, Kitai ST. Two types of cholinergic neurons in the rat tegmental pedunculopontine nucleus: electrophysiological and morphological characterization. Neuroscience. 1997;79(4):1089–1109. doi: 10.1016/s0306-4522(97)00019-5. [DOI] [PubMed] [Google Scholar]
- 25.Hirsch EC, Graybiel AM, Duyckaerts C, Javoy-Agid F. Neuronal loss in the pedunculopontine tegmental nucleus in Parkinson disease and in progressive supranuclear palsy. Proceedings of the National Academy of Sciences of the United States of America. 1987;84(16):5976–5980. doi: 10.1073/pnas.84.16.5976. [DOI] [PMC free article] [PubMed] [Google Scholar]
- 26.Kasashima S, Oda Y. Cholinergic neuronal loss in the basal forebrain and mesopontine tegmentum of progressive supranuclear palsy and corticobasal degeneration. Acta neuropathologica. 2003;105(2):117–124. doi: 10.1007/s00401-002-0621-x. [DOI] [PubMed] [Google Scholar]
- 27.Wichmann T, DeLong MR. Basal ganglia discharge abnormalities in Parkinson’s disease. Journal of neural transmission. 2006;(70):21–25. doi: 10.1007/978-3-211-45295-0_5. [DOI] [PubMed] [Google Scholar]
- 28.Kang Y, Kitai ST. Electrophysiological properties of pedunculopontine neurons and their postsynaptic responses following stimulation of substantia nigra reticulata. Brain research. 1990;535(1):79–95. doi: 10.1016/0006-8993(90)91826-3. [DOI] [PubMed] [Google Scholar]
- 29.Grunwerg BS, Krein H, Krauthamer GM. Somatosensory input and thalamic projection of pedunculopontine tegmental neurons. Neuroreport. 1992;3(8):673–675. doi: 10.1097/00001756-199208000-00004. [DOI] [PubMed] [Google Scholar]
- 30.Gatev P, Darbin O, Wichmann T. Oscillations in the basal ganglia under normal conditions and in movement disorders. Mov Disord. 2006;21(10):1566–1577. doi: 10.1002/mds.21033. [DOI] [PubMed] [Google Scholar]


