

Abstract
This study presents a case study of how social network and spatial analytical methods can be used simultaneously for disease transmission modeling. The paper first reviews strategies employed in previous studies and then offers the example of transmission of two bacterial diarrheal diseases in rural Bangladesh. The goal is to understand how diseases vary socially above and beyond the effects of the local neighborhood context. Patterns of cholera and shigellosis incidence are analyzed in space and within kinship-based social networks in Matlab, Bangladesh. Data include a spatially referenced longitudinal demographic database which consists of approximately 200,000 people and laboratory-confirmed cholera and shigellosis cases from 1983 to 2003. Matrices are created of kinship ties between households using a complete network design and distance matrices are also created to model spatial relationships. Moran's I statistics are calculated to measure clustering within both social and spatial matrices. Combined spatial effects-spatial disturbance models are built to simultaneously analyze spatial and social effects while controlling for local environmental context. Results indicate that cholera and shigellosis always clusters in space and only sometimes within social networks. This suggests that the local environment is most important for understanding transmission of both diseases however kinship-based social networks also influence their transmission. Simultaneous spatial and social network analysis can help us better understand disease transmission and this study has offered several strategies on how.
Keywords: Social Networks, Neighborhood Effects, Bangladesh, Cholera, Shigellosis
Introduction
This study demonstrates how combined social network and spatial analytical methods can be used simultaneously for disease transmission modeling. Separately, these two methods have been extensively used to incorporate physical and social context into health studies but researchers are only just beginning to explore using them simultaneously. Infectious disease transmission can be influenced by neighborhood-level environmental circumstances, as well as personal interactions within social networks. Individuals with social ties are more likely to interact with one another and share common household assets, thereby increasing the likelihood of transmitting infectious diseases. This paper first reviews strategies employed in previous studies to examine the effect of social ties and geographic proximity on disease transmission and then presents a case study of transmission of two bacterial diarrheal diseases in rural Bangladesh. This study investigates cholera and shigellosis transmission within social networks while controlling for spatial context in rural Bangladesh from 1983 to 2003. Cholera and shigellosis have been linked to the local environment and both have been shown to cluster in space (Miller, Feachem, and Drasar, 1985; Emch and Ali, 2001; Ruiz-Moreno et al. 2010; Carrel et al. 2009). However, they also can be spread through person-to-person contact and transmission is thus also controlled by social processes (Collins 1998). The use of integrated social and spatial analysis provides evidence as to whether local environmental transmission is more important than person-to-person diarrheal disease transmission.
Background
Cholera and Shigellosis
Cholera is a bacterial disease, characterized by watery diarrhea and dehydration. It has been linked to the aquatic environment and is a significant cause of morbidity and mortality in much of Asia and Africa (Colwell et al., 1990; Colwell, 1996; Islam, Drasar, and Sack,1993). A study in rural Bangladesh reported a case-fatality rate (CFR) of 4% however studies have reported wide ranges (Siddique et al. 1992). In 2009, 221,226 cases of cholera were reported to WHO with a case-fatality rate of 2.24% (WHO, 2009). In Somalia, where the public health system has virtually collapsed, a CFR of 13.6% was reported in a recent epidemic (Reuters 2007). The etiologic agent of cholera, Vibrio cholerae, can persistin brackish, coastal, and fresh water environments for significant periods of time. Transmission occurs via the fecal-oral route, through ingestion of contaminated surface water that is used for bathing, washing clothes and dishes, cooking, and sometimes drinking (Hoque et al., 1996). Person-to-person transmission has been reported during social events and through contamination of water and food in households (Swerdlow et al., 1992; St. Louis, et al., 1990). The infective dose is very high at approximately 100,000 to one million bacteria.
Shigellosis is an infectious disease caused by various species bacteria in the genus Shigella: S. boydii, S. dysenteriae, S. flexneri, and S. sonnei. The bacteria are transmitted from an infected person to another usually through the fecal-oral route. The infective dose for shigellosis is very low, only 10 to 200 organisms. Humans are the natural host and the bacteria are present in the diarrheal stools of infected persons while they are ill and for a week or two afterwards. Most shigellosis infections are the result of the bacteria passing from stools or soiled fingers of one person to the mouth of another person. This happens when basic hygiene and hand-washing habits are inadequate. Breast-feeding status, age, and nutritional status are the dominant predictors of pediatric shigellosis. Family and environmental variables can also have an impact on the risk of shigellosis. Children are at lower risk for shigellosis if the sentinel patient is an adult, because sick adults may have less personal contact with young children (Ahmed et al. 1997). The CFR varies significantly but can be as high as 5–15% for some strains in areas where medical care is poor (Rahaman et al., 1975; Kotloff et al., 1999).
Social Network Analysis
Social network analysis is used to measure relationships between social entities (Wasserman & Faust, 1994; Hanneman, 2001) and is particularly useful for measuring social relationships that influence disease outcomes or health interventions (Morris, 2004). In this study, we measure kinship relationships between households and how those relationships affect cholera and shigellosis disease incidence. Relationships with kin lay the foundation for most social interaction in certain societies, and may illuminate the risk of transmission through situations such as visits and shared meals. In social network analysis, linkages between social actors are modeled using empirical data. In our study the actors are people with a kinship relationship that fosters interactions between physical residences. There are different types of networks, and thus there are different analytical procedures based on how network data are collected. Complete (or full) networks require information about each actor's ties with all other actors (Hanneman, 2001) instead of just a sample of ties as is done with local or partial network designs (Morris, 2004). The field research area for this study offers a unique opportunity to build a complete social network because all kinship ties are meticulously recorded and internal migration tracked over time. We can therefore build ties between individuals that live in the same households as well as households with kinship ties to an individual who has migrated to another area. Well known examples of complete network designs include the National Longitudinal Study of Adolescent Health (AddHealth) (Bearman & Burns, 1998; Bearman et al., 2004) and the Nang Rong, Thailand study (Faust et al., 1999; Rindfuss et al., 2004; Entwisle et al., 2007).
Several studies have considered social networks and spatial context simultaneously (e.g., Faust et al., 1999) but few have investigated social networks and geographic context to examine health outcomes. Shared geographic space functions the same way as shared religious beliefs or ethnicity; actors in closer proximity use less effort to connect to one another than to those located further away, and may influence and affect each other to a greater degree (McPherson, Smith-Lovin, and Cook, 2001). Early research examining networks and space primarily focused on the influence of distance in relationship formation, using survey data on affiliations and measuring distance between associated units. Ties between students in common housing communities were shown to be related to the spatial proximity of dwellings (Festinger, Schachter, and Back, 1950; Caplow and Forman, 1950), and individuals of different races who lived closer to one another were shown to be more likely to form friendships and thus decrease interracial hostility (Deutsch and Collins, 1951). Studies on communication technology have found that despite technological advances that make communication easier, relationships are often formed and maintained with those in closer proximity (Wellman, Carrington, and Hall, 1988; Wellman, 1996; Mok, Wellman, and Basu, 2004).
Christakis and Fowler (2007) incorporated social as well as spatial distance into their analysis of 5124 individuals from the Framingham Heart Study. They studied social ties between family members, friends, and neighbors and the probability of obesity within those networks. Using a geographic information system (GIS), residential data, and geocoding techniques, spatial distance between the ego (individual of interest) and alter (the connected individual) was measured as a Euclidian distance. They found that while social proximity affected the likelihood of obesity in both parties, geographic distance appeared to have no effect. Radil, Flint, and Tita (2010) studied Los Angeles gang networks and the location of each gang's “turf,” combining social and spatial methods in order to better understand violence and youth behavior. They analyzed two types of “embededness” in relation to geographic patterns of violence, namely how gangs are socially positioned within the network, and their relative geographic location. Liu, King, and Bearman (2010) examined autism in California, finding that children living in closer proximity to children with autism were more likely to be diagnosed with the disorder. The driving factor behind spatial clustering and autism prevalence was social influence and information-sharing among families connected in space, therefore influencing the prevalence of diagnoses.
Several infectious disease studies have shown spatial clustering of individuals that are socially connected, often through a physical or sexual relationship. For example, sexual partnerships between individuals are shown to correspond to spatial proximity and common neighborhoods. Wylie, Cabral, and Jolly (2005) identified distinct geographic clusters of different chlamydia strains in Manitoba that were transmitted to sexual partners. Rothenberg et al. (2005) showed geographic and social clustering of HIV/AIDS in Colorado Springs intravenous drug networks. Other studies have used physical locations as nodes in a network, or used measures of centrality and geography as variables related to an outcome. Klovdahl (2001) found social settings such as bars and clubs to be points of tuberculosis transmission in a network where actors consisted of both patients and places they frequented in the Houston metropolitan area. Bates et al. (2007) found in rural Ecuador diarrheal disease risk is many times more common in more socially connected and densely populated communities.
The present study is one of the first to simultaneously examine social and spatial clustering of disease. We first measure each form of clustering separately to understand what patterns exist before controlling for the other. Social clustering observed on its own may be influenced by the shared environment; we therefore also use a spatial effects-spatial disturbance model to estimate social effects while controlling for both known confounding variables and unknown underlying spatial effects. Specific study questions include: (1) Do shigellosis and cholera cluster in kinship networks?; (2) Do shigellosis and cholera cluster geographically?; and (3) After controlling for known covariates and potential spatial autocorrelation, do shigellosis and cholera cluster within kinship networks? Because the primary transmission pathway for cholera is environmental, whereas shigellosis is commonly transmitted through person-to-person contact, we hypothesize that cholera will exhibit stronger spatial clustering while shigellosis will cluster more within social networks.
Data
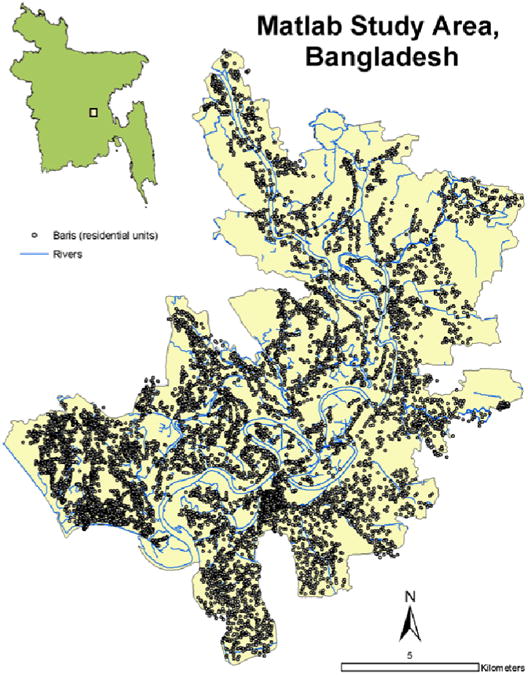
This study was conducted at the International Centre for Diarrhoeal Disease Research, Bangladesh (ICDDR,B). The research site for the ICDDR,B and for this project is called Matlab because the Centre's hospital is located in Matlab Town (Figure 1). Matlab is in south-central Bangladesh, approximately 50 kilometers southeast of Dhaka, adjacent to where the Ganges River meets the Meghna River forming the Lower Meghna River. A demographic surveillance system (DSS) has recorded all vital events of the study area population since 1966; the study area population is approximately 200,000. People are visited monthly by community health workers and if they have severe diarrhea are treated at a hospital run by the Centre. The Matlab DSS is the most comprehensive longitudinal demographic database of a large population in the developing world. The people in the study area live in clusters of patrilineally-related groups of households called baris which have been mapped and included in a comprehensive GIS of the study area (Figure 1) (Emch, 1999; Ali et al., 2001). Other spatial features included in the GIS database include the roads, rivers, ponds, and the location and depths of tubewells used for drinking water. Individual-level study data include the bari of residence of all Matlab residents between January 1st, 1983 and December 31st, 2003, dates of in- and out-migration, and all laboratory-confirmed cholera and shigellosis cases at the ICDDR,B diarrhea hospital.
Figure 1. Matlab Study area and GIS Database.
Methods
The methods employed for this study include (1) building a kinship-based complete network for all baris in Matlab, (2) creating spatial neighborhoods at multiple scales, (3) calculating Moran's I autocorrelation coefficients using the social network and spatial neighborhoods separately, and (4) integrating the social and spatial components by building a spatial effects-spatial disturbance model.
Network and Matrix Creation
The Matlab DSS was used to construct the kinship-based network. It records all kinship ties and contains the exact dates each person resided in different baris over time; therefore, a person can be traced from bari to bari over the course of his or her life in the Matlab study area. Migrations between baris are primarily kinship-based, e.g. due to marriage. The actors in the network are thus individuals with some kinship relationship that leads to relocation from one physical residence to another. The kinship-based network was created and analyzed under the assumption that when an individual moves, s/he maintains contact with the previous bari of residence at least for a short period of time. The mutual interaction between the old and new baris forms a non-directional social connection. Kinship-based relations are appropriate in this study population, given that these types of networks are an integral component of social interaction in rural settings in the developing world (Guest and Chamratrithirong, 1992; Hollinger and Haller, 1990). Traditional customs such as shared meals and family visits encourage social and physical interaction between kin. In these settings, transmission of infectious disease is possible, depending on sanitary conditions and practices, the infective dose of the disease, and individual characteristics. Cholera and shigellosis are both able to spread through contaminated food and water, potentially raising the risk for populations living or interacting with infected individuals. The rationale for employing social network methods in this case is that these models will capture social and physical contact both within and beyond the household.
The kinship network is based on individual-level migrations linking baris, which are the “nodes,” or units of analysis in the network. Each individual-level migration from bari x to bari y creates a social linkage between those two baris. These linkages are non-directional, meaning that the connection is mutual, rather than one-directional. Each linkage of this type is called a dyad. A complete list of all dyads, or an edgelist, can be represented as an n × n matrix, where n equals the number of actors. Graphs are another form of visualizing networks. For example, the eight baris included in Figure 2 show the family relationships between all baris. Bari 5 has no family ties to any of the other 7 baris, while baris 1, 2, and 3 are related, as are baris 6 and 7, and baris 4 and 8. We can represent relationships not only as graphs that can be visually inspected, but also in the form of matrices, which allow mathematical and computational methods to be employed that summarize and find patterns (Wasserman & Faust, 1994; Hanneman, 2001). A network matrix is a rectangular arrangement of a set of elements represented as cells that are organized within rows and columns. Table 1 shows a hypothetical matrix of relationships between baris 1 through 8 and is the matrix representation of the graph shown in Figure 2. The lines between nodes in Figure 2 have arrows pointing towards each node because the social relationships between family members are non-directional. In a social adjacency matrix, 1 represents the presence of a single, non-directional social connection between two baris and 0 represents no social connection. In Table 1, a value of 1 is given if there is a family relationship, while a value of 0 denotes that there is no relationship.
Figure 2. Network graph of 8 extended household units.

Table 1. Binary network matrix of 8 extended household units.
| Bari 1 | Bari 2 | Bari 3 | Bari 4 | Bari 5 | Bari 6 | Bari 7 | Bari 8 | |
|---|---|---|---|---|---|---|---|---|
| Bari 1 | 0 | 1 | 1 | 0 | 0 | 0 | 0 | 0 |
| Bari 2 | 1 | 0 | 1 | 0 | 0 | 0 | 0 | 0 |
| Bari 3 | 1 | 1 | 0 | 0 | 0 | 0 | 0 | 0 |
| Bari 4 | 0 | 0 | 0 | 0 | 0 | 0 | 0 | 1 |
| Bari 5 | 0 | 0 | 0 | 0 | 0 | 0 | 0 | 0 |
| Bari 6 | 0 | 0 | 0 | 0 | 0 | 0 | 1 | 0 |
| Bari 7 | 0 | 0 | 0 | 0 | 0 | 1 | 0 | 0 |
| Bari 8 | 0 | 0 | 0 | 1 | 0 | 0 | 0 | 0 |
For this study, multiple social networks were created and constructed for each year independent of others; i.e., the linkages between baris for 1983 were not considered when constructing the social network for baris in 1984, and so forth. This was to account for uncertainty regarding how long an active social linkage based on a migration may last. Each year was then analyzed independently in order to investigate trends over time, using matrices created from the dyads of bari-to-bari connections.
It is important to note that we restrict our social network analyses to kinship networks due to logistical difficulties in obtaining more refined network data, such as relationships associated with school and/or work networks. Given the transmission dynamics of both cholera and shigellosis, namely that both can be transmitted via fecal-oral routes, we would expect family ties to exposed/infected households to be associated with an increased risk of infection. Higher expected frequency of contacts among related households would reflect a greater propensity for individuals to be inadvertently exposed to respective pathogens through limited hygiene and/or food preparation practices of family members.
Moran's I
Spatial processes were expected to contribute significantly to cholera and shigellosis incidence because of the importance of environmental transmission to the disease dynamics. For instance, because water sources can be shared by neighboring baris, contamination of a water source will likely expose all baris within a neighborhood to cholera and/or shigellosis. Thus, environmental transmission of these pathogens is likely to be a spatially controlled process. Clustering of cholera and shigellosis in space was examined using the Moran's I statistic at various neighborhood scales in order to compare the effects of the local environment (Moran 1950). To measure spatial clustering of cholera and shigellosis, for each bari all other baris located within a 500, 1000, and 2000 meter buffer were identified. This was done to make three distance-band spatial matrices of all baris, where 1 represented a common neighborhood between two baris and 0 represented no common neighborhood. The three different buffers, or “neighborhoods,” were used in order to compare spatial clustering at various scales. The matrix created from the social network was based on the existence of a single tie or more in a given year, with 1 representing a connection. The total number of baris evaluated in both the social and spatial analysis was 8873. The dependent variable of interest was the rate of cholera or shigellosis in a bari during a specific year, aggregated from all individual recorded cases. For the entire 21-year study period, there were 8765 cases of cholera and 5492 cases of shigellosis in Matlab. For each year, the four 8873 × 8873 matrices, one of social adjacency and three representing the different shared spatial neighborhoods, were row-standardized into weights matrices. This gave both social affiliates and spatial neighbors equal “weight” in terms of their influence on a particular bari. The matrices could then each be multiplied by the n × 1 vector of disease rates per bari generating a lag operator which represents the average rate of disease in neighboring baris, or those either socially-affiliated (social lag) or spatially connected (spatial lag).
The global Moran's I statistic was applied to cholera and shigellosis rates to identify both the social and spatial clustering. Typically used as a measure of spatial autocorrelation, Moran's I can also be applied to detect clustering of other elements, such as language or cultural variables, within other types of networks, such as friendships or kinship (Dow, 2007). Z-scores for hypothesis tests were derived using 10,000 runs of Monte Carlo simulations, under a null hypothesis of no network autocorrelation either in geographic or social space. The test was run for each of the twenty-one years using the social connectivity matrix as well as the three spatial distance matrices. Each separate analysis produced both the coefficient representing the extent of clustering and a z-score for each year of the data. The analyses were done in Stata 10 and MATLAB 7.7.0.
Spatial Effects-Spatial Disturbance Models
Social clustering may be due to spatial clustering, i.e. individuals who are socially connected are more likely to live close to one another and thus are more likely to be affected by the same environmental risk factors. However, not all of the critical spatial factors are always known. In such cases, it is beneficial to also acknowledge the “error,” or “disturbances,” that exist in a spatial context but are not captured by a model. We therefore utilized maximum likelihood estimation procedures and spatial interaction estimation methods outlined by Doreian (1980, 1981). A combined linear spatial effects-spatial disturbance model was built to estimate social effects while controlling for both known independent variables and unknown underlying spatial effects (Doreian, 1980, 1981; Anselin, 1988). In other words, a disturbance model can measure the social effect of each disease above and beyond the neighborhood effect, whether those variables are known or not.
One social network matrix (W1) and another representing the shared spatial neighborhood at a 1000-meter scale (W2), were row-standardized into weights matrices. This granted social affiliates and spatial neighbors equal levels of influence on a particular bari. The matrices were then each multiplied by the n × 1 vector (Y) of either cholera or shigellosis rates per bari to generate a lag operator representing the average rate of each disease in baris either socially-affiliated (social lag) or spatially connected (spatial lag). For each bari, control variables (defined by the design matrix X) were created based on proximity to environmental features (i.e., rivers, ponds, and tubewells) that have been found to be associated with cholera or shigellosis transmission in previous research (Emch, 1999; Emch, Ali and Yunus, 2008). Distance to roads, which could facilitate social interaction, was also included as a covariate. We also included depth of the nearest tubewell as a covariate, because tubewell depth is expected to be inversely associated with disease risk (Escamilla et al. 2011). Using the above data, the spatial disturbance model was of the form: Y = ρ1W1Y + ρ2W2Y + Xβ. The social effect (ρ1) was assessed in terms of both existence and strength, while the spatial disturbance (ρ2) was used to correct the bias potentially created by autocorrelation at the neighborhood level. Using the social and spatial weights matrices, the model was run for each year using MATLAB 7.7.0 and the LeSage Econometrics Toolbox (LeSage, 1999; MATLAB, 2010).
Results
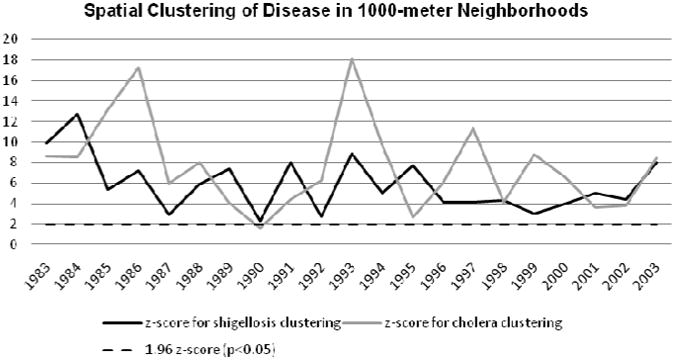
Test statistics associated with the Moran's I analyses indicated that across most years cholera and shigellosis cases were significantly clustered in space (Figures 3-5); however, except for four time periods, these diseases failed to demonstrate significant clustering across social networks (Figure 6). In the 500-meter neighborhood analysis there was significant spatial clustering of both shigellosis and cholera over the course of 21 years, with the exception of 1990 for cholera, when clustering was not significant (Figure 3). Similarly, at the 1000-meter scale, both diseases continued to cluster significantly in space during all years except 1990 (Figure 4). Figure 5 shows significant spatial clustering for all years for both diseases at the 2000-meter scale. The spatial clustering of both diseases was thus robust across multiple spatial scales. Figure 6 shows that both shigellosis and cholera clustered significantly in the social network in 1989 and 1993, while cholera clustered significantly in 1997, and shigellosis in 2000. This variation between the two diseases in 1997 and 2000 may indicate changes in epidemic trends and higher overall rates, which are then affected by network transmission.
Figure 3. Moran's I Z-scores within 500-meters for shigellosis and cholera.

Figure 5. Moran's I Z-scores within 2000-meters for shigellosis and cholera.

Figure 6. Moran's I Z-scores for social network matrix for shigellosis and cholera.

Figure 4. Moran's I Z-scores within 1000-meters for shigellosis and cholera.
The results of the combined social effects/spatial error model corroborated those found through the Moran's I cluster analyses. Namely, disease incidence could consistently be accounted for through spatial processes, and the impact of social ties was minimal across most years (Table 2). The spatial error (ρ2) was significant for every year at an α-level of 0.01 for both diseases. The parameter ρ2 represents the extent to which the clustering of cholera and shigellosis rates not explained by measured independent variables, nor the social effect, can be accounted for by the clustering of the error term. In other words, unaccounted-for variables related to similarity within the local environment were significant in all years. For cholera, when this underlying spatial error was controlled for, the social effects parameter (ρ1) was significant at an α-level of 0.01 for five out of twenty-one years, specifically for 1983, 1985, 1989, 1993, and 2000. The values represent the extent to which cholera rates clustered in the network; the lower coefficients are a result of the small number of overall cholera cases given the population size. The environmental control variables showed varying levels of significance in different years (Table 2). For shigellosis, there were significant social effects in six years, one more than for cholera and similar to cholera, the significant environmental control variables were different from year to year (Table 3).
Table 2.
Spatial error and significance, social effect and significance, and additional environmental variables that affect cholera rate.
| Year | Spatial Error | Significance | Social Effect | Signifiance | Other Variables |
|---|---|---|---|---|---|
| 1983 | 0.47 | ** | 0.01 | ** | Pond**, Tubewell* |
| 1984 | 0.48 | ** | 0.04 | Road* | |
| 1985 | 0.58 | ** | 0.05 | ** | Road*, Pond* |
| 1986 | 0.61 | ** | −0.01 | Road** | |
| 1987 | 0.54 | ** | 0.00 | ||
| 1988 | 0.53 | ** | 0.00 | ||
| 1989 | 0.46 | ** | 0.28 | ** | |
| 1990 | 0.34 | ** | 0.00 | ||
| 1991 | 0.42 | ** | -0.01 | ||
| 1992 | 0.52 | ** | -0.01 | Pond*, Tubewell* | |
| 1993 | 0.56 | ** | 0.15 | ** | |
| 1994 | 0.53 | ** | -0.01 | ||
| 1995 | 0.34 | ** | -0.01 | ||
| 1996 | 0.45 | ** | 0.00 | Tubewell Depth** | |
| 1997 | 0.54 | ** | 0.03 | ||
| 1998 | 0.42 | ** | -0.01 | River*, Tubewell Depth** | |
| 1999 | 0.57 | ** | -0.01 | ||
| 2000 | 0.54 | ** | 0.14 | ** | |
| 2001 | 0.43 | ** | 0.00 | Road** | |
| 2002 | 0.45 | ** | -0.01 | Tubewell* | |
| 2003 | 0.51 | ** | -0.01 |
p=<0.01;
p=<0.05
Table 3.
Spatial error and significance, social effect and significance, and additional environmental variables that affect shigellosis rates.
| Year | Spatial Error | Significance | Social Effect | Significance | Other Variables |
|---|---|---|---|---|---|
| 1983 | 0.52 | ** | −0.02 | Road * | |
| 1984 | 0.60 | ** | 0.03 | Tubewell* | |
| 1985 | 0.43 | ** | −0.01 | Road* | |
| 1986 | 0.49 | ** | −0.01 | ||
| 1987 | 0.42 | ** | 0.02 | ** | |
| 1988 | 0.44 | ** | 0.02 | ||
| 1989 | 0.55 | ** | 0.02 | ** | Road* |
| 1990 | 0.38 | ** | −0.01 | ||
| 1991 | 0.49 | ** | −0.02 | Road*, Pond* | |
| 1992 | 0.40 | ** | 0.00 | ||
| 1993 | 0.46 | ** | 0.21 | ** | |
| 1994 | 0.42 | ** | −0.01 | ||
| 1995 | 0.51 | ** | −0.01 | ||
| 1996 | 0.46 | ** | 0.00 | Road* | |
| 1997 | 0.40 | ** | 0.06 | ** | |
| 1998 | 0.45 | ** | −0.01 | ||
| 1999 | 0.41 | ** | 0.00 | ||
| 2000 | 0.44 | ** | 0.02 | ** | |
| 2001 | 0.39 | ** | 0.39 | ** | |
| 2002 | 0.51 | ** | 0.00 | ||
| 2003 | 0.59 | ** | 0.00 |
p=<0.01;
p=<0.05
Conclusions
This study shows that incidence of cholera and shigellosis are mostly associated with the local environment, but social networks also influence the transmission of both diseases in certain situations. The methods employed in this study compare the occurrence of social and spatial clustering separately, and also examine the joint effects of spatial and social networks. While there is a small but well-regarded body of prior literature examining the influence of social networks on diseases that have a behavioral component (e.g., sexually transmitted infections, obesity, and smoking), very few studies have examined the effect of social ties on infectious diseases such as cholera or shigellosis. In addition, only a very few studies have simultaneously examined the effect of both social connectedness and spatial proximity on disease transmission dynamics. This is one of the first to utilize a joint social-spatial model to examine disease incidence.
Calculating Moran's I spatial autocorrelation on both spatial and social matrices demonstrated that the local environment is consistently important in the transmission of shigellosis and cholera, while social networks are intermittently important. The social effects-spatial disturbance model accounts for the spatial autocorrelation of omitted predictor variables, or the autocorrelation of the error term. The model resulted in five (cholera) and six (shigellosis) years during which there was a significant social effect above and beyond spatial effects which were present in all years. During those years, processes related to kinship-based social networks influenced transmission and produced similar rates in connected extended households. In a recent paper investigating multiple transmission pathways for waterborne diseases, Tien and Earn (2010) noted that the relative contribution of a given transmission pathway can be outbreak-dependent. In other words, under endemic conditions of cholera and/or shigellosis, the primary route of transmission is environmental, through ingestion of contaminated water. However, outbreaks of these diseases may be driven by other transmission pathways, such as through direct contact. Social processes, though relatively unimportant for explaining endemic disease processes, may be instrumental for driving episodic outbreaks. Thus, the observed peaks in the importance of social ties to cholera and shigellosis dynamics during 4-5 years could be attributed to outbreak, rather than endemic, disease processes. Socially-driven transmission of cholera and/or shigellosis may be the result of actual physical transmission of the pathogen through direct person-to-person transmission, or may also be due to similar behaviors across related baris (i.e., hygiene or water storage practices) that either increase or reduce collective risk.
Significant spatial error parameters estimated by the model for all years suggest the importance of unidentified spatial components in producing common disease rates among socially connected baris. However, the spatial error parameter may “capture” those social interactions not included by the kinship network. Individuals will interact to some degree with their neighbors. As noted in the Methods section, social networks were defined only through kinship linkages, which is a limitation of the study. Kinship relationships, however, are important social outlets in Matlab and activities that may lead to cholera and shigellosis disease transmission, such as labor and meals, often take place with other family members (Amin, 1998; White, 1997). If cholera is spread via consumption of food or water contaminated by others, there is a significant chance that the transmission occurred between family members. In our analysis, the social effects term captures potential disease transmission attributable to familial interactions. Of course, individuals also interact with friends, many of whom live in close spatial proximity. The poor quality of roads and overall lack of transportation leads to limited mobility in Matlab, so an individual's activity space is rather limited. Since the primary source of exposure to cholera and shigellosis is through contaminated food and water we would expect neighbors, especially those who share water resources, to be affected by the oral-fecal-oral transmission process. In our analysis, the spatial error term captures this aspect of disease transmission, the risk attributable to spatial proximity. Though it is a limitation that we cannot explicitly examine non-kinship social connections, we suggest that including the spatial error term captures many of these social ties since most social interactions in this study area take place within a small geographic area.
As discussed in the introduction, we expected to find stronger social clustering of shigellosis, due to the hypothesized predominantly person-to-person transmission dynamics of the disease. It is clear that our results do not support this hypothesis, which may also be related to the fact that we could not examine non-kinship social ties. Using an incomplete contact network could bias results because the level of exposure may be underestimated. We also expected that cholera would cluster more in space and our results supported this hypothesis. These results support the idea that cholera is an environmentally-driven disease and that contact to contaminated water bodies is by far the most important mode of transmission.
This study explores ways to conduct integrated social network and spatial analysis. Both have been used to understand disease transmission separately, although spatial context is an important part of social interaction. This study provides a framework with which to address the relative contributions of social and spatial processes on infectious disease transmission dynamics, and can be widely applied to other disease systems for which social and spatial processes are likely to interact.
Acknowledgments
This study was conducted with the support of ICDDR,B donors which provide unrestricted support to the Centre for its operations and research. Current donors providing unrestricted support include: the Australian International Development Agency(AusAID), the Government of Bangladesh(GoB),the Canadian International Development Agency (CIDA),Embassy of the Kingdom of the Netherlands (EKN),the Swedish International Development Cooperative Agency (CIDA),and the Department for International Development, UK (DFID). This study was also supported by the following grants: NIAID R03-AI076748 and NSF BCS-0924479. Funding for SG was provided through the NSF IGERT program at the Carolina Population Center.
References
- Ahmed F, Clemens JD, Rao MR, Ansaruzzaman M, Haque E. Epidemiology of shigellosis among children exposed to cases of Shigella dysentery: a multivariate assessment. American Journal of Tropical Medicine Hygiene. 1997;56(3):258–64. doi: 10.4269/ajtmh.1997.56.258. [DOI] [PubMed] [Google Scholar]
- Ali M, Emch M, Ashley C, Streatfield PK. Implementation of a medical geographic information system: Concepts and uses. Journal of Health, Population, and Nutrition. 2001;19(2):100–110. [PubMed] [Google Scholar]
- Amin S. Family structure and change in rural Bangladesh: Implications for women's roles in the family. Development and Change. 1998;28(2):213–233. [Google Scholar]
- Anselin L. Spatial econometrics: Methods and models. Boston: Kluwer Academic; 1988. [Google Scholar]
- Bates SJ, Trostle J, Cevallos WT, Hubbard A, Eisenberg JNS. Relating diarrheal disease to social networks and the geographic configuration of communities in rural Ecuador. American Journal of Epidemiology. 2007;166(9):1088–1095. doi: 10.1093/aje/kwm184. [DOI] [PMC free article] [PubMed] [Google Scholar]
- Bearman P, Stovel K, Moody J, Thalji L. The structure of sexual networks and the National Longitudinal Study of Adolescent Health. In: Morris Martina., editor. Network epidemiology: A handbook for survey design and data collection. Oxford: Oxford University Press; 2004. [Google Scholar]
- Bearman PS, Burns L. Adolescents, health and school: Early findings from the National Longitudinal Study of Adolescent Health. NASSP Bulletin. 1998;82:601–23. [Google Scholar]
- Caplow T, Forman R. Neighbourhood interaction in a homogeneous community. American Sociolgical Review. 1950;15:357–366. [Google Scholar]
- Carrel M, Emch M, Streatfield PK, Yunus M. Spatio-temporal clustering of cholera: The impact of flood control in Matlab, Bangladesh, 1983-2003. Health & Place. 2009;15(3):771–782. doi: 10.1016/j.healthplace.2008.12.008. [DOI] [PMC free article] [PubMed] [Google Scholar]
- Christakis NA, Fowler JH. The spread of obesity in a large social network over 32 years. The New England Journal of Medicine. 2007;357:370–379. doi: 10.1056/NEJMsa066082. [DOI] [PubMed] [Google Scholar]
- Collins A. Environment, health and population displacement: Development and change in Mozambique's diarrhoeal disease ecology. Aldershot: Ashgate; 1998. [Google Scholar]
- Colwell RR, Tamplin ML, Brayton PR, Gauzens AL, Tall BD, Herrington D, Levine MM, Hall S, Huq A, Sack DA. Advances in research on cholera and related diarrhoea. 7th. Tokyo: KTK Scientific Publishers; 1990. Environmental aspects of Vibrio cholerae in transmission of cholera; pp. 327–343. [Google Scholar]
- Colwell RR. Global climate and infectious disease: The cholera paradigm. Science. 1996;274(5295):2025–2031. doi: 10.1126/science.274.5295.2025. [DOI] [PubMed] [Google Scholar]
- Deutsch M, Collins ME. Interracial housing: A psychological evaluation of a social experiment. Minneapolis: University of Minnesota Press; 1951. [Google Scholar]
- Doreian P. Linear models with spatially distributed data: Spatial disturbances or spatial effects? Sociological Methods & Research. 1980;9:29–60. [Google Scholar]
- Doreian P. Estimating linear models with spatially distributed data. Sociological Methodology. 1981;12:359–388. [Google Scholar]
- Dow MM. Galton's problem as multiple network autocorrelation effects: cultural trait transmission and ecological constraint. Cross-Cultural Research. 2007;41(4):336–363. [Google Scholar]
- Emch M, Ali M. Spatial and temporal patterns of diarrheal disease in Matlab, Bangladesh. Environment and Planning A. 2001;33:339–350. [Google Scholar]
- Emch ME. Diarrheal disease risk in Matlab, Bangladesh. Social Science and Medicine. 1999;49:519–30. doi: 10.1016/s0277-9536(99)00146-x. [DOI] [PubMed] [Google Scholar]
- Entwisle B, Faust K, Rindfuss R, Kaneda T. Networks and contexts: Variation in the structure of social ties. American Journal of Sociology. 2007;112(5):1495–1533. [Google Scholar]
- Escamilla V, Wagner B, Yunus M, Streatfield PK, van Geen A, Emch M. Impact of deep tubewells on childhood diarrhea in Bangladesh. Bulletin of the World Health Organization. 2011 doi: 10.2471/BLT.10.085530. Online first Article ID: BLT.10.085530. [DOI] [PMC free article] [PubMed] [Google Scholar]
- Faust K, Entwisle B, Rindfuss RR, Walsh SJ, Sawangdee Y. Spatial arrangement of social and economic networks among villages in Nang Rong District, Thailand. Social Networks. 1999;21(4):311–337. [Google Scholar]
- Festinger L, Schachter S, Back K. Social processes in informal groups. Stanford: Standford University Press; 1950. [Google Scholar]
- Guest P, Chamratrithirong A. The social context of fertility decline in Thailand. In: Goldscheider C, editor. Fertility Transitions, Family Structure, and Population Policy. Boulder, CO, USA: Westview Press; 1992. [Google Scholar]
- Hanneman RA. Introduction to social network methods Riverside. California: Department of Sociology, University of California at Riverside; 2001. [Google Scholar]
- Hollinger F, Haller M. Kinship and social networks in modern societies: A cross-cultural comparison among seven nations. European Sociological Review. 1990;6:103–124. [Google Scholar]
- Hoque BA, Juncker T, Sack RB, Ali M, Aziz KM. Sustainability of a water, sanitation and hygiene education project in rural Bangladesh: A 5-year follow-up. Bulletin of the World Health Organization. 1996;74(4):431–437. [PMC free article] [PubMed] [Google Scholar]
- Islam MS, Drasar BS, Sack RB. The Aquatic Environment as a Reservoir of Vibrio cholerae: A review. Journal of Diarrhoeal Disease Research. 1993;11(4):197–206. [PubMed] [Google Scholar]
- Klovdahl AS. Networks and tuberculosis: an undetected community outbreak involving public places. Social Science & Medicine. 2001;52(5):681–694. doi: 10.1016/s0277-9536(00)00170-2. [DOI] [PubMed] [Google Scholar]
- Kotloff KL, Winickoff JP, Ivanoff B, Clemens JD, Swerdlow DL, Sansonetti PJ, Adak GK, Levine MM. Global burden of Shigella infections: implications for vaccine development and implementation of control strategies. Bulletin of the World Health Organization. 1999;77(8):651–666. [PMC free article] [PubMed] [Google Scholar]
- LeSage JP. Applied econometrics using MATLAB. 1999 www.spatial-econometrics.com.
- Liu KY, King M, Bearman P. Social influence and the autism epidemic. American Journal of Sociology. 2010;5:1387–434. doi: 10.1086/651448. [DOI] [PMC free article] [PubMed] [Google Scholar]
- MATLAB. Version 7.7.0. The MathWorks, Inc.; Natick: 2010. [Google Scholar]
- McPherson M, Smith-Lovin L, Cook JM. Birds of a feather: Homophily in social networks. Annual Review of Sociology. 2001;27:415–44. [Google Scholar]
- Miller CJ, Feachem RG, Drasar BS. Cholera epidemiology in developed and developing countries: New thoughts on transmission, seasonality, and control. Lancet. 1985;8423:261–3. doi: 10.1016/s0140-6736(85)91036-0. [DOI] [PubMed] [Google Scholar]
- Mok D, Wellman B, Basu R. Does distance matter for relationships?; Presentation at SUNBELT International Social Network Conference; Portoroz, Slovenia. 2004. [Google Scholar]
- Moran PAP. Notes on continuous stochastic phenomena. Biometrika. 1950;37:17–33. [PubMed] [Google Scholar]
- Morris M. Network epidemiology: A handbook for survey design and data collection. Oxford: Oxford University Press; 2004. [Google Scholar]
- Rahaman MM, Khan MM, Aziz KMS, Islam MS, Kibriya AK. An outbreak of dysentery caused by Shigella dysenteriae type 1 on a Coral Island in the Bay of Bengal. The Journal of Infectious Diseases. 1975;132(1):15–19. doi: 10.1093/infdis/132.1.15. [DOI] [PubMed] [Google Scholar]
- Radil SM, Flint C, Tita GE. Spatializing social networks: Using social network analysis to investigate geographies of gang rivalry, territoriality, and violence in Los Angeles. Annals of the Association of American Geographers. 2010;100:307–326. [Google Scholar]
- Reuters. Somalia: Cholera kills 82 in central region. [Accessed on 30 Sep 2009];Alertnet 05 Feb 2007. 2007 http://www.alertnet.org/thenews/newsdesk/IRIN/289d0e116c1f0700790157eb152ae7ca.htm.
- Rindfuss RR, Jampaklay A, Entwistle B, Sawangdee Y, Faust K, Prasartkul P. In: The collection and analysis of social network data in Nang Rong, Thailand. Morris Martina., editor. Oxford: Oxford University Press; 2004. [Google Scholar]
- Rothenberg RB, Potterat JJ, Woodhouse DE, Muth SQ, Darrow WW, Klovdahl AS. Social network dynamics and HIV transmission. AIDS. 1998;12:1529–1536. doi: 10.1097/00002030-199812000-00016. [DOI] [PubMed] [Google Scholar]
- Ruiz-Moreno D, Pascual M, Emch M, Yunus M. Spatial clustering in the spatio-temporal dynamics of endemic cholera. BMC Infectious Diseases. 2010;10:51. doi: 10.1186/1471-2334-10-51. [DOI] [PMC free article] [PubMed] [Google Scholar]
- Siddique AK, Zaman K, Baqui AH, Akram K, Mutsuddy P, Eusof A, Haider K, Islam S, Sack RB. Cholera epidemics in Bangladesh: 1985-1991. Journal of Diarrhoeal Disease Research. 1992;10(2):79–86. [PubMed] [Google Scholar]
- St Louis M, Porter JD, Helal A, Drame K, Hargrett-Bean N, Wells JG, Tauxe RV. Epidemic cholera in West Africa: The role of food-handling and high-risk foods. American Journal of Epidemiology. 1990;131(4):719–728. doi: 10.1093/oxfordjournals.aje.a115556. [DOI] [PubMed] [Google Scholar]
- Swerdlow DL, Greene KD, Tauxe RV, Wells JG, Bean NH, Ries AA, Blake PA, Mintz ED, Pollack M, Rodriguez M, Seminario L, Ocampo C, Vertiz B, Espejo L, Saldana W. Waterborne transmission of epidemic cholera in Trujillo, Peru: Lessons for a continent at risk. The Lancet. 1992;340:28–32. doi: 10.1016/0140-6736(92)92432-f. [DOI] [PubMed] [Google Scholar]
- Tien JH, Earn DJD. Multiple transmission pathways and disease dynamics in a waterborne pathogen model. Bulletin of Mathematical Biology. 2010;72(6):1506–1533. doi: 10.1007/s11538-010-9507-6. [DOI] [PubMed] [Google Scholar]
- Wasserman S, Faust K. Methods and applications. Cambridge: Cambridge University Press; 1994. Social network analysis. [Google Scholar]
- Wellman B, Carrington P, Hall A. Networks as personal communities. In: Wellman B, Berkowitz SD, editors. Social structures: A network approach. Cambridge University Press; Cambridge: 1988. [Google Scholar]
- Wellman B. Are personal communities local? A Dumptarian reconsideration. Social Networks. 1996;18:347–354. [Google Scholar]
- White SC. Men, masculinities, and the politics of development. Gender and Development. 1997;5(2):14–22. doi: 10.1080/741922357. [DOI] [PubMed] [Google Scholar]
- Wylie JL, Cabral T, Jolly AM. Identification of networks of sexually transmitted infection: A molecular, geographic, and social network analysis. Journal of Infectious Diseases. 2005;191(6):899–906. doi: 10.1086/427661. [DOI] [PubMed] [Google Scholar]