Primary open-angle glaucoma (POAG) is a chronic neurodegenerative disease characterized by progressive thinning of the retinal nerve fiber layer (RNFL) and of the neuroretinal rim within the optic nerve head (ONH).1 Assessment of the ONH and the RNFL plays an essential role in the diagnosis and follow-up of glaucomatous patients. However, the clinical examination of these structures is often difficult, qualitative, and subjective.2 Several imaging technologies, such as optical coherence tomography (OCT), allow for quantitative measurements of ONH topography and RNFL thickness in a noninvasive and objective manner.3
OCT technology has changed considerably in recent years with the incorporation of spectral-domain (SD) imaging that offers significant advantages over the time-domain (TD) OCT techniques.4 Several SD-OCT instruments have been commercialized in recent years. The working principles are similar for all these devices and involve a superluminescent diode scan that collects 3-dimensional images of the peripapillary region from which information about the RNFL thickness can be obtained. Despite differences in acquisition time and resolution, these instruments have been shown to have similar diagnostic abilities to detect glaucoma.5
Until very recently, ophthalmic applications of OCT technology could be performed exclusively in the sitting position, limiting its use in non-compliant patients due to physical disabilities. The newly introduced iVue (Optovue Inc, Fremont, CA) is a portable SD-OCT device that enables imaging in different body positions. OCT imaging in the supine body position may induce new methodological errors that can influence measurements. IOP changes in the magnitude of 7 mmHg or greater, as a result of medical or surgical IOP-lowering, have been shown to affect measurements of the RNFL and ONH using confocal scanning laser ophthalmoloscopy (CLSO).6–8 This has been explained by the effect of IOP reduction causing a significant reversal of ONH cupping, interpreted as an increase in rim area by the CLSO. In contrast, posture-induced changes in IOP are generally in the order of 4–5 mmHg in healthy subjects9, 10 and glaucoma patients11, 12 over a 24-hour period. Therefore, it is important to understand whether small to moderate postural IOP variations affect OCT readings of ONH and RNFL parameters dynamically when measured by sensitive instruments for assessing these changes over time. Currently, it is not known whether these IOP changes might affect OCT topographic measurements.
Before a new device can be widely accepted for use in clinical practice, its repeatability and diagnostic accuracy should be validated. Estimating instrument repeatability is essential for quantifying small changes detectable for identifying and monitoring glaucomatous progression. The current study seeks to evaluate the short-term repeatability and the correlation between supine and sitting measurements of ONH and RNFL parameters obtained with a portable OCT in healthy participants and glaucoma patients.
METHODS
Participants
Three groups of 10 individuals were included in this cross-sectional, observational study. Younger healthy subjects (age, 22.9 ± 2.6 years) (mean ± standard deviation) and older healthy subjects (53.9 ± 5.0 years) were recruited from university employees and their families. A group of patients with POAG (61.3 ± 11.9 years) was recruited from a university-based glaucoma clinic at the Shiley Eye Center, University of California San Diego. Exclusion criteria included myopia ≤ −5 diopters13 and presence of ocular disease other than glaucoma. Eyes were classified as glaucomatous if they had repeatable (2 consecutive) abnormal SAP test results on the 24-2 program of the Humphrey visual field analyzer (Carl Zeiss Meditec, Inc., Dublin, CA). An abnormal SAP result was defined as having a pattern standard deviation outside the 95% confidence limits or a glaucoma hemifield test result outside the reference range, regardless of the appearance of the optic disc. Healthy subjects had a normal visual field test (using Statpac II, Swedish interactive thresholding algorithm 24-2, Zeiss-Humphrey Field Analyzer, Carl Zeiss Meditec, Inc., Dublin, CA), an IOP ≤ 21 mmHg, and no clinical signs of glaucomatous optic neuropathy on dilated slit lamp fundus exmaination. Written informed consent was obtained from all subjects. The study adhered to the tenets of the Declaration of Helsinki, was compliant with HIPAA regulations, and was approved by the Institutional Review Board of the University of California, San Diego.
Optical Coherence Tomography
Images of the optic nerve and adjacent retina were obtained using a portable spectral-domain OCT (SD-OCT) system (iVue SD-OCT; Optovue Inc, Fremont, CA). The iVue SD-OCT uses a superluminescent diode scan with a center wavelength of 840 ± 10 nm to provide high-resolution images. The manufacturer’s 3D Disk protocol was used to collect data. A 6 × 6-mm raster scan centered on the optic disc and composed of 101 B scans each composed of 512 A-scans (acquisition time, 2.2 seconds). The resulting scan provides a 3D image of the optic disc and surrounding area. The analysis points are derived from a 3.45 mm diameter area. The iVue SD-OCT is delivered on a slit-lamp style base but can be mounted on multi-directional rolling floor stand (iStand, Optovue) for universal positioning of the device. The stand’s articulating arm is designed to facilitate scanning in the supine and other positions. All SD-OCT scans were obtained through undilated pupils. Quality assurance checks were done and images that had RNFL segmentation algorithm failures, motion artifacts, were poorly focused, were not centered, or had a scan score index (SSI) of less than 40 were excluded.
Two experienced examiners scanned all participants. Measurements of both eyes of each study participant were taken in the supine followed by the sitting position. Participants were instructed to lie flat on a bed looking up for 5 minutes. For this position, the scan head was attached to the arm of the iStand, facing downward and placed directly over the subject’s eye. Five scans were taken of the right eye followed by the left eye. After having assumed the sitting position for 5 minutes, another set of 5 scans of each eye was taken in the same order using the iVue-table and mount.
Outcome measures were repeatability within the same body position and correlation between both body positions for 4 ONH parameters (optic disc area, cup area, rim area, and rim volume) and 3 RNFL parameters (overall average RNFL thickness, inferior, and superior). All RNFL values were sampled from a 3.45 mm diameter circle centered on the optic disc. The optic cup was defined automatically by the iVue software as the intersection points of the nerve head inner boundary and a parallel line that is 150 μm above the connecting line of the RPE tips. All other parameters were defined automatically by the iVue software.
Statistical Analysis
Paired t test, one-way analysis of variance (ANOVA) with Scheffé’s test for multiple comparisons, and chi-square test were used to compare different measures between subject groups. Repeatability was defined as the variation of repeat measurements in the same body position. Intraclass correlation coefficients (ICC) were used to test repeatability of 5 measurements per eye in each body position. Concordance correlation coefficients (CCC) were calculated to test the strength of the relationship between body position and each of the ONH and RNFL parameters. CCCs are based on the differences between the observations made on the same subject in different positions and thus evaluate the agreement between two readings by measuring the variation from the 45° line through the origin.14 For this reason, CCC analysis was preferred to other reported statistical methods for evaluating correlation, such as intraclass correlation coefficients and linear regression.14 A correlation between 0.4 and 0.75 is considered fair to good, whereas higher correlations are qualified as excellent agreement.15 The agreement between measurements in the sitting and supine positions was further graphically evaluated using Bland-Altman plots and the difference in slopes was analyzed using Pitcairn’s test of difference in variance.16 Finally, Pearson correlation coefficients were used to determine the association between image quality and ONH and RNFL measurements.
Based on a significance level of 5%, a type II error rate (β) of 10%, our study had an 82% power to detect a difference of 0.3 mm2 between disc area (for a mean area of 1.5 mm2 and a mean standard deviation of 0.4 mm2) and a 96% power to detect a difference of 10 μm between the RNFL measurements obtained in each position (for a mean RNFL thickness of 100 μm and a mean standard deviation of 10 μm). The 10 μm difference was based on the minimum significant difference required to exceed the intramachine variability.17 All tests were two-tailed and a P-value less than 0.05 was considered statistically significant. All statistical analyses were performed with commercially available software (Stata version 10; StataCorp, College Station, TX).
RESULTS
This study included 60 eyes (40 healthy, 20 glaucomatous) from 30 individuals (20 healthy, 10 glaucomatous). Mean age was 22.9 ± 2.6 years (mean ± standard deviation) for the younger healthy subjects, 53.9 ± 5.0 years for the older healthy subjects and 61.3 ± 11.9 years for the glaucomatous patients. The older subjects had a similar age-range to the glaucoma patients (P = 0.09). Glaucomatous eyes had a mean IOP of 16.9 ± 3.8 mmHg under ocular hypotensive treatment and a mean visual field mean deviation (MD) of −1.6 ± 2.0 dB and a mean pattern standard deviation (PSD) of 4.0 ± 3.7 dB at the time of iVue SD-OCT examination compared to 15.3 ± 2.3 mmHg (P = 0.09), 0.6 ± 1.1 dB (P < 0.001), and 1.6 ± 0.4 dB (P < 0.001), respectively, in the older group. Table 1 demonstrates demographic characteristics of the study population. All participants in the older healthy group were female and the difference to the other two groups was statistically significant (P < 0.001). There was no difference in ancestry between the groups. Five RNFL scans of five different eyes had to be excluded from the analysis because of motion artifacts despite adequate quality scores and valid ONH readings.
Table 1.
Demographic Characteristics of Healthy Participants and Glaucoma Patients.
| Younger healthy (n=10, 20 eyes) | Older healthy (n=10, 20 eyes) | Glaucoma (n=10, 20 eyes) | |
|---|---|---|---|
| Age, average (SD) a | 22.9 (2.6) | 53.9 (5.0) | 61.3 (11.9) |
| Gender, female b | 4 (40%) | 10 (100%) | 6 (60%) |
| Ancestry, | |||
| White | 5 (50%) | 6 (60%) | 6 (60%) |
| Hispanic | 5 (50%) | 3 (30%) | 3 (30%) |
| Asian | 0 | 1 (10%) | 1 (10%) |
P < 0.001 (analysis of variance),
P < 0.001 (Chi-square test)
SD = standard deviation
Variation of repeat measurements in the same body position
Tables 2 and 3 show the repeatability of iVue SD-OCT ONH and RNFL thickness measurements for each body position. The ICCs for ONH parameters ranged from 86% (rim volume) to 99% (cup area) for the younger healthy group, 77% (rim area) to 99% (cup area) for the older healthy group, and 73% (rim area) to 99% (cup volume) for the glaucoma group. The ICCs for RNFL thickness parameters ranged from 72% (inferior RNFL thickness) to 99% (superior RNFL thickness) for the younger healthy group, 72% (inferior RNFL thickness) to 97% (superior RNFL thickness) for the older healthy group, and 92% (inferior RNFL thickness) to 99% (overall RNFL thickness) for the glaucoma group.
Table 2.
Repeatability (intraclass correlation coefficients) of optic nerve head measurements in each body position and by subject group.
| Group | Position | Disc area (μm2) | Cup area (μm2) | Rim area (μm2) | Rim volume (μm3) |
|---|---|---|---|---|---|
| Younger healthy | |||||
| OD | |||||
| Supine | 0.96 (0.92–0.99) | 0.98 (0.97–0.99) | 0.95 (0.92–0.99) | 0.97 (0.95–0.99) | |
| Sitting | 0.97 (0.94–0.99) | 0.98 (0.96–0.99) | 0.93 (0.87–0.99) | 0.88 (0.78–0.98) | |
| OS | |||||
| Supine | 0.96 (0.95–0.99) | 0.99 (0.99–1.0) | 0.94 (0.89–0.99) | 0.86 (0.74–0.98) | |
| Sitting | 0.98 (0.96–1.0) | 0.99 (0.99–1.0) | 0.95 (0.91–0.99) | 0.96 (0.95–1.0) | |
| Older healthy | |||||
| OD | |||||
| Supine | 0.93 (0.88–0.99) | 0.98 (0.97–1.0) | 0.96 (0.91–1.0) | 0.97 (0.94–0.99) | |
| Sitting | 0.97 (0.93–0.99) | 0.98 (0.97–1.0) | 0.95 (0.91–0.99) | 0.97 (0.93–0.99) | |
| OS | |||||
| Supine | 0.93 (0.86–0.99) | 0.98 (0.96–0.99) | 0.89 (0.79–0.98) | 0.95 (0.91–0.99) | |
| Sitting | 0.90 (0.81–0.99) | 0.99 (0.97–1.0) | 0.77 (0.59–0.95) | 0.94 (0.88–0.99) | |
| Glaucoma | |||||
| OD | |||||
| Supine | 0.84 (0.69–0.98) | 0.96 (0.92–1.0) | 0.75 (0.55–0.96) | 0.84 (0.70–0.98) | |
| Sitting | 0.93 (0.86–0.99) | 0.98 (0.96–1.0) | 0.73(0.51–0.95) | 0.81 (0.64–0.97) | |
| OS | |||||
| Supine | 0.94 (0.88–0.99) | 0.97 (0.93–1.0) | 0.82 (0.66–0.98) | 0.89 (0.79–0.99) | |
| Sitting | 0.98 (0.96–1.0) | 0.97 (0.93–1.0) | 0.82 (0.66–0.98) | 0.90 (0.80–0.99) | |
Values represent the mean and 95% confidence interval.
Table 3.
Repeatability (intraclass correlation coefficients) of retinal nerve fiber layer thickness measurements in each body position, by subject group.
| Group | Position | Overall RNFL | Superior RNFL | Inferior RNFL |
|---|---|---|---|---|
| Younger healthy | ||||
| OD | Supine | 0.93 (0.87–0.99) | 0.99 (0.97–1.0) | 0.72 (0.51–0.93) |
| Sitting | 0.97 (0.95–0.99) | 0.99 (0.97–0.10) | 0.90 (0.81–0.99) | |
| OS | Supine | 0.97 (0.95–1.0) | 0.97 (0.94–1.0) | 0.91 (0.83–0.99) |
| Sitting | 0.98 (0.97–1.0) | 0.98 (0.96–1.0) | 0.98 (0.96–1.0) | |
| Older healthy | ||||
| OD | Supine | 0.87 (0.76–0.98) | 0.97 (0.93–0.99) | 0.72 (0.51–0.92) |
| Sitting | 0.93 (0.87–0.99) | 0.97 (0.95–0.99) | 0.86 (0.75–0.98) | |
| OS | Supine | 0.96 (0.92–0.99) | 0.95 (0.91–0.99) | 0.92 (0.85–0.99) |
| Sitting | 0.94 (0.86–0.99) | 0.95 (0.90–0.99) | 0.94 (0.88–0.99) | |
| Glaucoma | ||||
| OD | Supine | 0.99 (0.98–1.0) | 0.98 (0.97–1.0) | 0.98 (0.95–1.0) |
| Sitting | 0.98 (0.96–0.99) | 0.98 (0.97–1.0) | 0.92 (0.84–0.99) | |
| OS | Supine | 0.98 (0.95–1.0) | 0.98 (0.96–1.0) | 0.98 (0.96–1.0) |
| Sitting | 0.99 (0.98–1.0) | 0.97 (0.94–1.0) | 0.98 (0.96–1.0) | |
Values represent the mean and 95% confidence interval.
RNFL = Retinal nerve fiber layer
Variation of measurements between the supine and sitting position
Table 4 shows the different ONH parameters of each group for the two body positions. Statistical comparison of mean values and standard deviations among groups did not show significant posture-related differences for any of the studied parameters. Table 6 shows concordance correlation coefficients (CCC) and their 95% limits of agreement for ONH measurements in healthy subjects and glaucoma patients. Overall, CCC values were high, ranging from 98% to 99% for all parameters. Table 5 shows the different RNFL thickness parameters of each group for the two body positions. The correlation between RNFL thickness measurements for supine vs. sitting positions was also very strong. Overall, CCC values varied from 96% (inferior RNFL thickness) to 99% (overall average RNFL thickness). (Table 7)
Table 4.
Summary statistics of optic nerve head measurements.
| Group | Position | Disc area (μm2) | Cup area (μm2) | Rim area (μm2) | Rim volume (μm3) |
|---|---|---|---|---|---|
| Younger healthy | |||||
| OD | Supine | 1.85 (0.40) | 0.54 (0.46) | 1.31 (0.34) | 0.25 (0.15) |
| Sitting | 1.87 (0.41) | 0.54 (0.45) | 1.34 (0.32) | 0.27 (0.16) | |
| P | 0.92 | 0.99 | 0.88 | 0.86 | |
| OS | Supine | 1.90 (0.50) | 0.53 (0.60) | 1.38 (0.34) | 0.29 (0.15) |
| Sitting | 1.89 (0.51) | 0.53 (0.61) | 1.36 (0.35) | 0.29 (0.15) | |
| P | 0.95 | 0.99 | 0.97 | 0.98 | |
| Older healthy | |||||
| OD | Supine | 1.98 (0.35) | 0.73 (0.44) | 1.25 (0.45) | 0.20 (0.12) |
| Sitting | 1.97 (0.36) | 0.74 (0.47) | 1.24 (0.42) | 0.20 (0.12) | |
| P | 0.99 | 0.97 | 0.95 | 0.97 | |
| OS | Supine | 1.91 (0.40) | 0.73 (0.46) | 1.18 (0.27) | 0.19 (0.09) |
| Sitting | 1.92 (0.36) | 0.71 (0.46) | 1.21 (0.22) | 0.20 (0.10) | |
| P | 0.98 | 0.96 | 0.96 | 0.98 | |
| Glaucoma | |||||
| OD | Supine | 1.61 (0.86) | 1.07 (0.58) | 0.55 (0.29) | 0.05 (0.03) |
| Sitting | 2.10 (0.42) | 1.41 (0.51) | 0.69 (0.15) | 0.06 (0.03) | |
| P | 0.12 | 0.18 | 0.18 | 0.22 | |
| OS | Supine | 1.95 (0.40) | 1.14 (0.49) | 0.81 (0.18) | 0.08 (0.04) |
| Sitting | 1.98 (0.40) | 1.11 (0.50) | 0.87 (0.18) | 0.09 (0.03) | |
| P | 0.89 | 0.89 | 0.48 | 0.71 | |
Values represent the mean and standard deviation.
Table 6.
Correlation of supine and sitting measurements of optic nerve head parameters, assessed using concordance correlation coefficients.
| Group | Disc area | Cup area | Rim area | Rim volume |
|---|---|---|---|---|
| Younger healthy | 0.97 (0.94–0.99) | 0.99 (0.99–1.00) | 0.98 (0.97–0.99) | 0.98 (0.96–0.99) |
| Older healthy | 0.98 (0.96–0.99) | 0.99 (0.98–0.99) | 0.98 (0.97–0.99) | 0.99 (0.98–0.99) |
| Glaucoma | 0.96 (0.94–0.99) | 0.98 (0.96–0.99) | 0.84 (0.71–0.97) | 0.92 (0.85–0.99) |
|
| ||||
| Overall | 0.98 (0.97–0.99) | 0.99 (0.99–1.00) | 0.98 (0.96–0.99) | 0.99 (0.98–0.99) |
Values represent the mean and 95% confidence interval.
Table 5.
Summary statistics of retinal nerve fiber layer thickness measurements.
| Group | Position | Overall RNFL (μm) | Superior RNFL (μm) | Inferior RNFL (μm) |
|---|---|---|---|---|
| Younger healthy | ||||
| OD | Supine | 103.9 (8.3) | 128.1 (16.5) | 137.8 (15.5) |
| Sitting | 104.3 (9.3) | 127.7 (15.7) | 141.3 (15.6) | |
| P | 0.72 | 0.87 | 0.12 | |
| OS | Supine | 101.7 (8.7) | 124.5 (14.4) | 138.1 (12.1) |
| Sitting | 101.6 (9.2) | 126.2 (16.1) | 139.1 (13.7) | |
| P | 0.89 | 0.44 | 0.59 | |
| Older healthy | ||||
| OD | Supine | 100.7 (3.9) | 115.4 (12.8) | 129.4 (9.0) |
| Sitting | 102.0 (4.5) | 116.5 (14.0) | 131.8 (9.2) | |
| P | 0.03 | 0.58 | 0.06 | |
| OS | Supine | 98.7 (5.3) | 119.0 (12.2) | 127.9 910.2) |
| Sitting | 98.3 (4.2) | 117.5 (9.1) | 129.5 (10.4) | |
| P | 0.6 | 0.36 | 0.26 | |
| Glaucoma | ||||
| OD | Supine | 79.5 (13.4) | 89.1 (18.0) | 101.3 (20.6) |
| Sitting | 78.7 (14.2) | 90.5 (18.9) | 99.7 (22.0) | |
| P | 0.77 | 0.71 | 0.72 | |
| OS | Supine | 82.7 (12.6) | 99.3 (15.4) | 107.0 (19.2) |
| Sitting | 84.1 (12.8) | 99.3 (15.2) | 108.8 (20.4) | |
| P | 0.58 | 0.99 | 0.64 | |
Values represent the mean and standard deviation.
RNFL = retinal nerve fiber layer
Table 7.
Correlation of supine and sitting measurements of retinal nerve fiber layer thickness measurements, assessed using concordance correlation coefficients.
| Group | Overall RNFL | Superior RNFL | Inferior RNFL |
|---|---|---|---|
| Younger healthy | 0.96 (0.98–0.99) | 0.97 (0.94–0.99) | 0.93 (0.87–0.99) |
| Older healthy | 0.88 (0.78–0.99) | 0.90 (0.81–0.99) | 0.87 (0.76–0.98) |
| Glaucoma | 0.97 (0.95–0.99) | 0.98 (0.97–0.99) | 0.93 (0.87–0.99) |
|
| |||
| Overall | 0.99 (0.98–0.99) | 0.98 (0.97–0.99) | 0.96 (0.94–0.98) |
Values represent the mean and 95% confidence interval.
RNFL = retinal nerve fiber layer
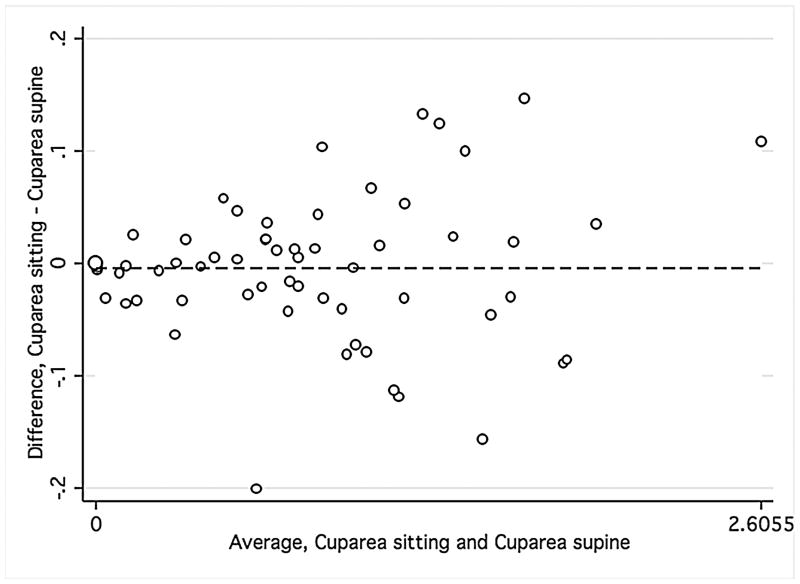
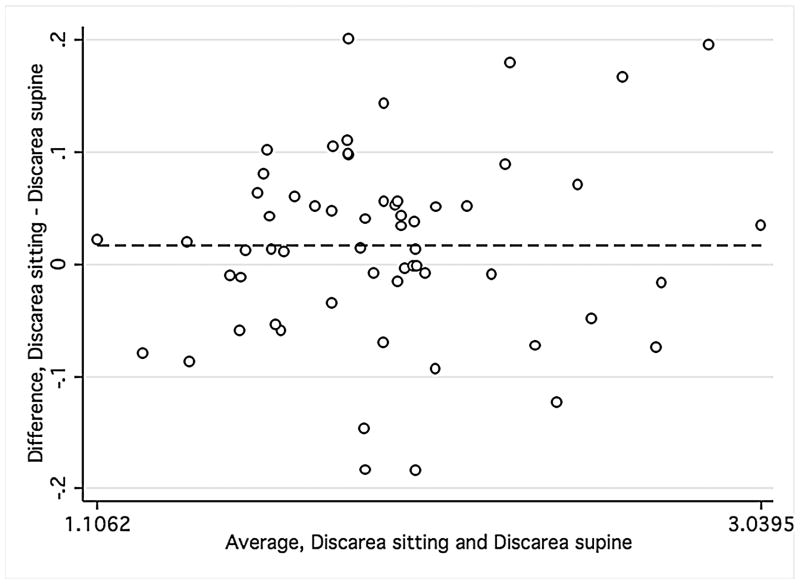
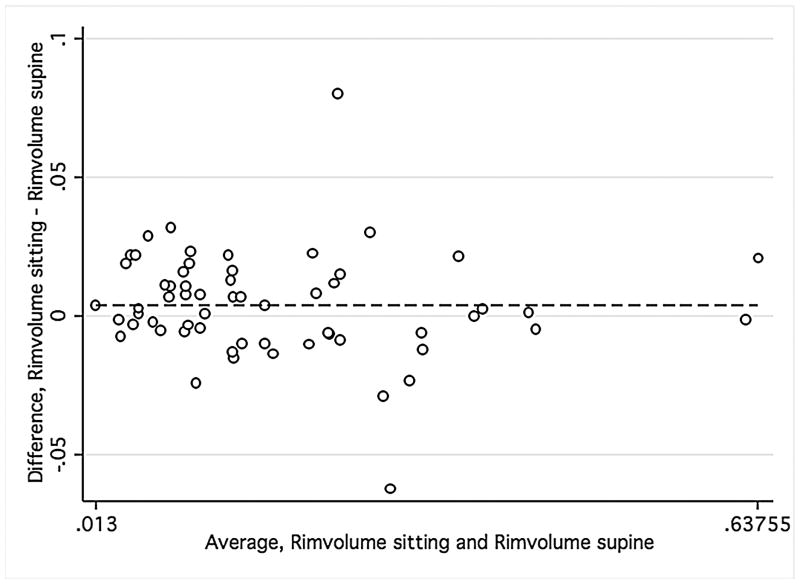
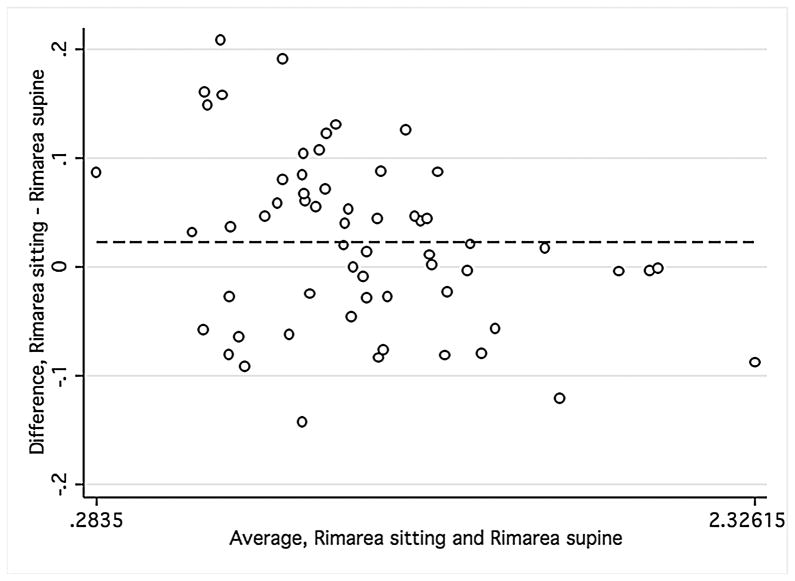
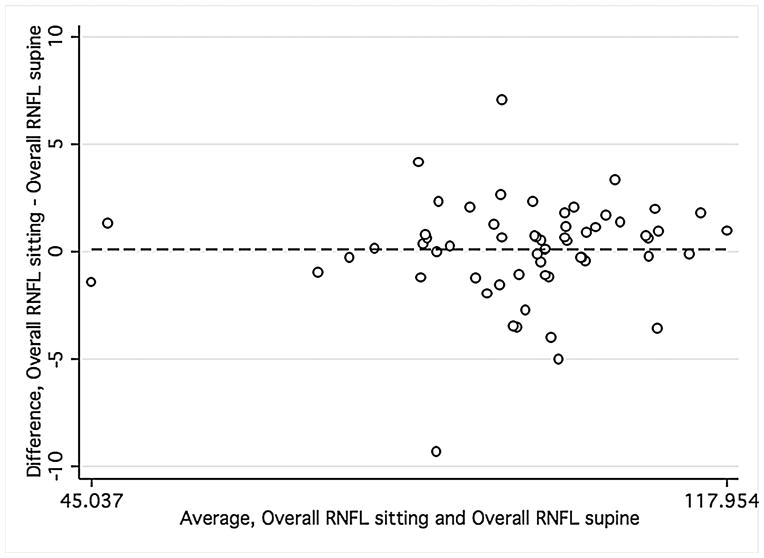
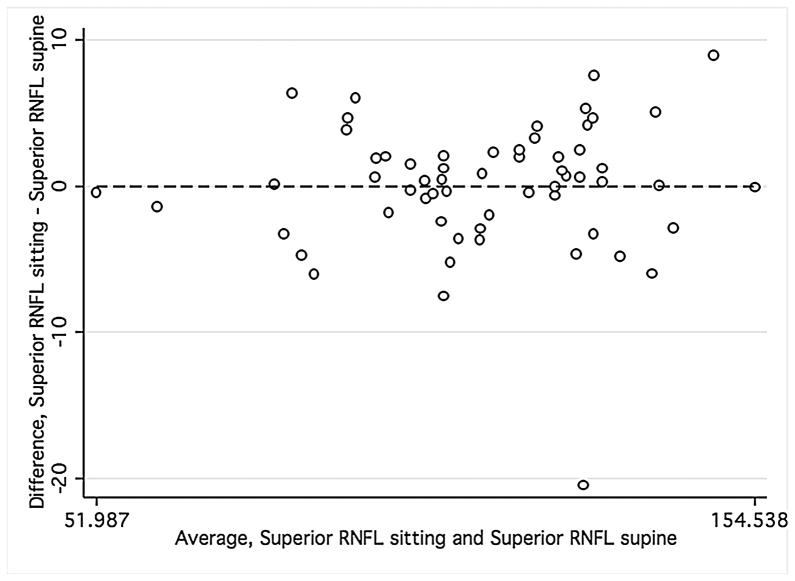
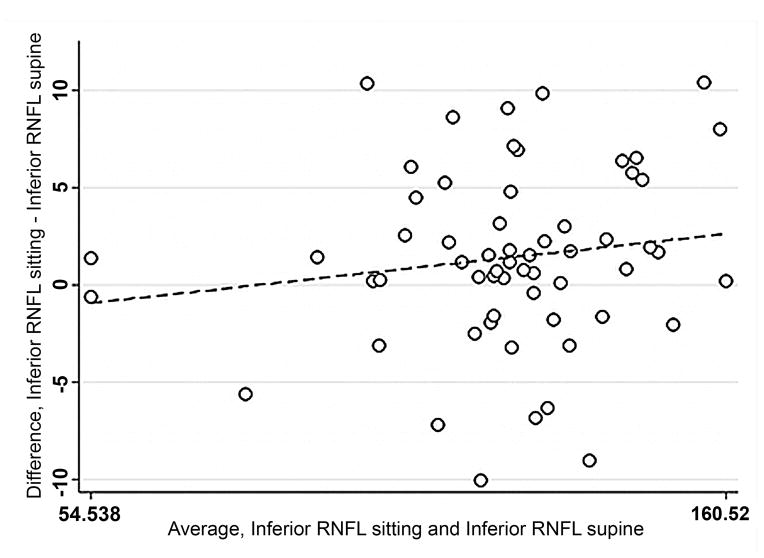
Bland-Altman plots were used to evaluate the agreement between supine and sitting measurements. Values for all three groups were combined to assess the agreement between different ranges of ONH parameters using Bland-Altman plots (Figure 1). The slopes calculated were similar for disc area (r = −0.12; P = 0.38), cup area (r = 0.12; P = 0.37), and rim volume (r = −0.11; P = 0.43) but not rim area (r = −0.34; P = 0.01), indicating that sitting measurements are similar to supine measurements, with the exception of rim area. Bland-Altman plots were also constructed for the average overall RNFL thickness and average inferior and superior RNFL thickness (Figure 2) for healthy and glaucomatous eyes combined. The slopes were similar in both body positions for overall RNFL thickness (r = 0.09; P = 0.50), inferior RNFL thickness (r = 0.17; P = 0.20), and superior RNFL thickness (r = 0.05; P = 0.70). For ONH and RNFL parameters, there was no statistically significant difference in agreement within individual subject groups when this analysis was performed separately (Data not shown).
FIGURE 1.
Bland-Altman plots showing the agreement of optic nerve head measurements between the supine and sitting position in the combined group of young healthy subjects, older healthy subjects, and glaucoma patients.
Footnote: Cup area (Mean difference = −.005, Limits of agreement;−.13, .13) (1 Top left), disc area (Mean difference = .017, Limits of agreement; −.15, .18) (2 Top right), rim volume (Mean difference = .004, Limits of agreement;−.03,.04) (3 Bottom right), and rim area (Mean difference = .02, Limits of agreement;−.13, .18) (4 Bottom left). Variability is consistent for cup area (r = 0.12; P = 0.37), disc area (r = −0.12; P = 0.38), and rim volume (r = −0.11; P = 0.43) but not rim area (r = −0.34; P = 0.01).
FIGURE 2.
Bland-Altman plots of showing the agreement between the supine and sitting position in the combined group of young healthy subjects, older healthy subjects, and glaucoma patients. Variability is low and stable across the range of mean values.
Footnote: Overall average retinal nerve fiber layer (RNFL) thickness (Mean difference = .10, Limits of agreement; −4.47, 4.68), superior RNFL thickness (Mean difference = .016, Limits of agreement; −8.61, 8.64), and inferior RNFL thickness (Mean difference = 1.12, Limits of agreement; −10.12, 12.36). Variability is consistent for overall RNFL thickness (r = 0.09; P = 0.50), superior RNFL thickness (r = 0.05; P = 0.70), inferior RNFL thickness (r = 0.17; P = 0.20).
The iVue SD-OCT instrument measures a total of 11 ONH and 15 RNFL thickness parameters. All of these parameters were analyzed but only the most relevant are reported in this paper. No statistically significant differences in terms of ICC and CCC were seen in any of the other parameters and therefore, due to their limited relevance, they are not shown.
Relationship Between Image Quality and Agreement
The mean signal strengths of scans for younger healthy eyes in the sitting and supine positions were 79.01 (95% confidence interval [CI], 76.55 to 81.46) and 75.84 (95% CI, 73.52 to 78.16), 75.44 (95% CI, 73.24 to 77.63) and 70.10 (95% CI, 66.21 to 73.98) in older healthy eyes, and 62.58 (95% CI, 58.45 to 66.70) and 59.90 (95% CI, 56.42 to 63.39) in glaucoma eyes, respectively. Positive correlations were found between signal strength and decreasing age in the sitting (r2 = 0.45; 95% CI, 0.62 to 0.25; P < 0.001) and the supine (r2 = 0.46; 95% CI, 0.63 to 0.24, P <0.001) position for the combined group. The signal strength was significantly higher in the healthy vs. the glaucoma group in the sitting (P = 0.01) but not the supine position (P = 0.09). There were no statistically significant correlations with other studied variables, such as gender (r2 = 0.09; P = 0.16), ancestry (r2 = 0.16; P = 0.82), CCT (r2 = 0.05; P = 0.09), and IOP (r2 = 0.19; P = 1.80).
DISCUSSION
The iVue SD-OCT is one of only two commercially available portable OCT instruments. The first of these, the handheld-OCT (Bioptigen, Durham, NC), has been demonstrated to have utility in children18, 19 and for intraoperative imaging.20 Their repeatability and positional dependence of measurements has not been reported. In this study, we investigated cross-sectional ONH and RNFL thickness measurements obtained with the iVue SD-OCT. Our results show that these measurements do not change significantly between the supine and sitting positions in healthy and glaucoma eyes.
The repeatability of all ONH parameters in the same body position was good to excellent. The ONH parameter with the lowest repeatability (although not statistically significant) was rim area. Rim area and rim volume are of particular interest because, like the RNFL thickness, they reflect the number of axons converging to leave the eye. The ICC of rim area measurements varied between 93% to 95% (younger healthy), 77% to 96% (older healthy), and 73% to 82% (glaucoma). These results are in the lower range of reported average ICC values of 96% with the Cirrus HD-OCT21 and 96% (glaucoma eyes) and 97% (healthy eyes) with the RTVue SD-OCT.22 With an average 0.73 mm2, the rim area was smaller in our glaucoma patients than in previous studies, suggesting more advanced disease.21, 22 Several earlier studies have shown that OCT measurements in glaucomatous eyes are slightly more variable than in normal eyes.22, 23, 24 It is possible that repeatability of ONH parameters decreases with more severe disease,23 particularly in the absence of an eye-tracking system. This study, however, was not designed to answer this particular question.
Repeatability for overall average RNFL thickness was also good to excellent with values ranging from 93% to 98% (younger healthy), 87% to 96% (older healthy), and 98% to 99% (glaucoma). These results are comparable to reported ICC values with different OCT instruments, ranging from 79% (Stratus TD-OCT)25 to 99% (Spectralis SD-OCT).26 There was no statistically significant difference in variability between different RNFL thickness parameters. The current results showed somewhat lower ICCs with the iVue SD-OCT than previous studies. The RTVue SD-OCT analyzes RNFL thickness using the ONH scan pattern and sampling from a 3.45 mm diameter circle centered on the optic disc (TSNIT circle). This circle is sampled after the scan is complete and is adjusted to be centered on the optic disc in every scan. In addition, the ONH scan is registered to the 3-D Disc scan using an algorithm that matches the scans based on blood vessel patterns, allowing for more precise registration of scans. This study used iVue SD-OCT beta software, in which RNFL thickness measurements were derived from the TSNIT circle centered on the optic disc from the 3-D Disc scans but blood vessel registration was not available and was not used. This may have reduced the repeatability of RNFL measurements. In addition, the 3-D disc scans take longer to acquire than the ONH scans, and are more susceptible to eye motion artifacts potentially adding further to the variability.
Beyond the good repeatability of measurements, the iVue SD-OCT can image the eye in different body positions. OCT imaging has been problematic in certain population groups, such as pediatric patients and patients with chronic or acute physical disabilities precluding examination in the vertical position. Therefore, the correlation between measurements taken in the two body positions is of particular interest. This correlation was very strong for both ONH (CCC, 98% to 99%) and RNFL parameters (CCC, 96% to 99%). The standard deviation measurements were similar between the two body positions, with a statistically non-significant tendency for lower variability in the supine position (for average overall RNFL thickness, SD range was 6.8–14.2μm in sitting vs. 3.9–13.4μm in supine), despite the more challenging manipulation of the instrument in the latter. This could be due to a more stable head position or less displacement of the head with breathing, as the subject lies flat. Although the correlation between supine and sitting measurements was very strong, postural effects of IOP may have induced some changes in the studied parameters, which cannot be detected using the current technology of SD-OCT.
IOP generally increases when individuals change from the sitting to the supine.27–30 The magnitude of this postural effect on IOP has been reported to be generally between 4 to 5 mmHg in normals and higher in glaucoma patients.11, 29 Previous studies have looked at the impact of acute IOP increases on ONH topographic parameters in non-human primates.6, 31 Using CSLO imaging of enucleated human eyes, Yan et al.,32 demonstrated progressive increase in cup depth with increasing IOP from 5 to 50 mmHg. More recently, Fatehee et al.,33 evaluated the effects of acute IOP increase from 0 to 49 mmHg in ex vivo porcine eyes using SD-OCT technology and demonstrated a posterior displacement of the ONH and lamina cribrosa. In this previous study, cup area increased by 28%, while lamina cribrosa area and prelaminar tissue area decreased by 18% and 5.5%, respectively.
In vivo observations in human eyes have shown that smaller changes in IOP can also affect ONH measurements. Agoumi et al.,34 used ophthalmodynamometry to raise IOP in a group of glaucoma patients, age-matched normal subjects, and young healthy subjects. Using SD-OCT imaging, they found increased cupping with a mean IOP elevation of 12.4 mmHg and suggested that this was directly linked to prelaminar tissue compression. Of interest, the percentage of the prelaminar compression was 4 times higher in young subjects and 2 times higher in old controls compared to glaucoma patients. Ophthalmodynamometry, however, may itself lead to non-physiological ONH changes by altering the intraorbital and optic nerve tissue pressures. A case report showed significant changes in CLSO-ONH parameters in a glaucoma patient with a particularly large diurnal intraocular pressure fluctuation of 42 mmHg.35 Other studies have shown that medical and surgical lowering of IOP by as little as 7.2 mmHg could lead to changes in CLSO-ONH topography in glaucoma patients.7, 36, 37 It can reasonably be expected that most individuals in our group would present a significantly smaller IOP change between the two body positions than the above-mentioned reports.38 It is, therefore, unlikely, that physiological postural IOP changes would have affected the iVue SD-OCT readings significantly.
It is possible that differences in signal strength between images taken in the 2 positions may have influenced the correlation between the measurements. Previous studies have shown a significant association between the magnitude of signal strength and SD-OCT values.39, 40 To minimize this effect, all images were reviewed for quality and only images with good signal strength were included. A post-hoc analysis did not show any significant association between signal strength and iVue SD-OCT values in our study. Although glaucomatous patients had, in the sitting position only, lower signal strength compared with healthy eyes, this was most likely the result of a significant relationship between older age and signal strength. No significant effect of signal strength was found on other studied parameters after adjusting for age.
This study has some limitations. We investigated relatively short durations (5 minutes) in each body position, similar to durations used in other studies.9, 41 It is possible that longer durations in the supine position,42 as in prolonged surgical interventions, may affect OCT measurements either by a sustained higher IOP or intracranial pressure,43 or both. However, a probable concomitant increase of cerebrospinal fluid in the supine position could counter the biomechanical effect of rising IOP on translaminar pressure and could mitigate changes in optic nerve head parameters. Future studies with longer testing protocols could address these matters. Another limitation is that all subjects in the older healthy group were of female sex, potentially introducing a selection bias. It seems, however, unlikely that such a bias would alter the overall results of this study.
In conclusion, these results suggest that the ability of the portable iVue SD-OCT to quantify ONH and RNFL parameters is good to excellent in both body positions and comparable to reported values for stationary SD-OCT instruments in the sitting position. The iVue-SD-OCT is useful for individuals in whom imaging in body positions other than sitting is indicated.
Acknowledgments
Financial support: Velux Foundation, Zuerich, Switzerland (KM) and Swiss Foundation for the Prevention of Blindness, Zuerich, Switzerland (KM).
Supported in part by NIH EY021818 (FAM)
Footnotes
Contributions of Authors: Design of the study (KM, JHL); Conduct of the study (KM, AT); Statistical expertise (KM); Writing the article (KM); Critical revision of the article and final approval (KM, JHL, AT, FAM, RNW); Provision of materials, patients, or resources (KM, JHL, RNW).
Statement about Conformity with Author Information: This prospective study was compliant with HIPAA regulations and adhered to the Declaration of Helsinki and all federal or state laws. It was approved by the University of California, San Diego Human Research Protections Program (IRB protocol #081148) with patient informed consent for participation in research. This study was registered at http://clinicaltrials.gov (NCT01319000)
Financial disclosures: K Mansouri, Research and financial support from Sensimed AG; JH Liu, none; A Tafreshi, none; FA Medeiros, Research and financial support from Carl Zeiss Meditec, Inc., Pfizer, Inc. Reichert, Inc., Depew, NY; RN Weinreb, Research and financial support from Carl Zeiss Meditec, Inc., Dublin, CA; Heidelberg Engineering, GmbH, Heidelberg, Germany; Optovue, Inc., Fremont, CA; Topcon Medical Systems, Inc., Livermore, CA; Nidek, Aichi, Japan.
References
- 1.Weinreb RN, Khaw PT. Primary open-angle glaucoma. Lancet. 2004;363(9422):1711–1720. doi: 10.1016/S0140-6736(04)16257-0. [DOI] [PubMed] [Google Scholar]
- 2.Reus NJ, Lemij HG, Garway-Heath DF, et al. Clinical assessment of stereoscopic optic disc photographs for glaucoma: the European Optic Disc Assessment Trial. Ophthalmology. 2010;117(4):717–723. doi: 10.1016/j.ophtha.2009.09.026. [DOI] [PubMed] [Google Scholar]
- 3.Mansouri K, Leite MT, Medeiros FA, Leung CK, Weinreb RN. Assessment of rates of structural change in glaucoma using imaging technologies. Eye (Lond) 2011;25(3):269–77. doi: 10.1038/eye.2010.202. [DOI] [PMC free article] [PubMed] [Google Scholar]
- 4.Leitgeb R, Hitzenberger C, Fercher A. Performance of fourier domain vs. time domain optical coherence tomography. Opt Express. 2003;11(8):889–894. doi: 10.1364/oe.11.000889. [DOI] [PubMed] [Google Scholar]
- 5.Schuman JS. Spectral domain optical coherence tomography for glaucoma (an AOS thesis) Trans Am Ophthalmol Soc. 2008;106:426–458. [PMC free article] [PubMed] [Google Scholar]
- 6.Coleman AL, Quigley HA, Vitale S, Dunkelberger G. Displacement of the optic nerve head by acute changes in intraocular pressure in monkey eyes. Ophthalmology. 1991;98(1):35–40. doi: 10.1016/s0161-6420(91)32345-5. [DOI] [PubMed] [Google Scholar]
- 7.Bowd C, Weinreb RN, Lee B, Emdadi A, Zangwill LM. Optic disk topography after medical treatment to reduce intraocular pressure. Am J Ophthalmol. 2000;130(3):280–286. doi: 10.1016/s0002-9394(00)00488-8. [DOI] [PubMed] [Google Scholar]
- 8.Alencar LM, Zangwill LM, Weinreb RN, et al. A comparison of rates of change in neuroretinal rim area and retinal nerve fiber layer thickness in progressive glaucoma. Invest Ophthalmol Vis Sci. 2010;51(7):3531–3539. doi: 10.1167/iovs.09-4350. [DOI] [PMC free article] [PubMed] [Google Scholar]
- 9.Mosaed S, Liu JH, Weinreb RN. Correlation between office and peak nocturnal intraocular pressures in healthy subjects and glaucoma patients. Am J Ophthalmol. 2005;139(2):320–324. doi: 10.1016/j.ajo.2004.09.062. [DOI] [PubMed] [Google Scholar]
- 10.Liu JH, Bouligny RP, Kripke DF, Weinreb RN. Nocturnal elevation of intraocular pressure is detectable in the sitting position. Invest Ophthalmol Vis Sci. 2003;44(10):4439–4442. doi: 10.1167/iovs.03-0349. [DOI] [PubMed] [Google Scholar]
- 11.Tsukahara S, Sasaki T. Postural change of IOP in normal persons and in patients with primary wide open-angle glaucoma and low-tension glaucoma. Br J Ophthalmol. 1984;68(6):389–392. doi: 10.1136/bjo.68.6.389. [DOI] [PMC free article] [PubMed] [Google Scholar]
- 12.Liu JH, Zhang X, Kripke DF, Weinreb RN. Twenty-four-hour intraocular pressure pattern associated with early glaucomatous changes. Invest Ophthalmol Vis Sci. 2003;44(4):1586–1590. doi: 10.1167/iovs.02-0666. [DOI] [PubMed] [Google Scholar]
- 13.Wang G, Qiu KL, Lu XH, et al. The effect of myopia on retinal nerve fibre layer measurement: a comparative study of spectral-domain optical coherence tomography and scanning laser polarimetry. Br J Ophthalmol. 2011;95(2):255–260. doi: 10.1136/bjo.2009.176768. [DOI] [PubMed] [Google Scholar]
- 14.Barnhart HX, Haber M, Song J. Overall concordance correlation coefficient for evaluating agreement among multiple observers. Biometrics. 2002;58(4):1020–1027. doi: 10.1111/j.0006-341x.2002.01020.x. [DOI] [PubMed] [Google Scholar]
- 15.Fleiss H. Statistical Methods for Rates and Proportions. 2. New York: Wiley; 1981. [Google Scholar]
- 16.Bland JM, Altman DG. Measuring agreement in method comparison studies. Stat Methods Med Res. 1999;8(2):135–160. doi: 10.1177/096228029900800204. [DOI] [PubMed] [Google Scholar]
- 17.Sehi M, Guaqueta DC, Feuer WJ, Greenfield DS. A comparison of structural measurements using 2 Stratus optical coherence tomography instruments. J Glaucoma. 2007;16(3):287–292. doi: 10.1097/IJG.0b013e3180391a72. [DOI] [PubMed] [Google Scholar]
- 18.Muni RH, Kohly RP, Sohn EH, Lee TC. Hand-held spectral domain optical coherence tomography finding in shaken-baby syndrome. Retina. 2010;30(4 Suppl):S45–50. doi: 10.1097/IAE.0b013e3181dc048c. [DOI] [PubMed] [Google Scholar]
- 19.Muni RH, Kohly RP, Charonis AC, Lee TC. Retinoschisis detected with handheld spectral-domain optical coherence tomography in neonates with advanced retinopathy of prematurity. Arch Ophthalmol. 2010;128(1):57–62. doi: 10.1001/archophthalmol.2009.361. [DOI] [PubMed] [Google Scholar]
- 20.Hayashi A, Yagou T, Nakamura T, Fujita K, Oka M, Fuchizawa C. Intraoperative changes in idiopathic macular holes by spectral-domain optical coherence tomography. Case Report Ophthalmol. 2011;2(2):149–154. doi: 10.1159/000328752. [DOI] [PMC free article] [PubMed] [Google Scholar]
- 21.Sharma A, Oakley JD, Schiffman JC, Budenz DL, Anderson DR. Comparison of automated analysis of Cirrus HD OCT spectral-domain optical coherence tomography with stereo photographs of the optic disc. Ophthalmology. 2011;118(7):1348–1357. doi: 10.1016/j.ophtha.2010.12.008. [DOI] [PMC free article] [PubMed] [Google Scholar]
- 22.Gonzalez-Garcia AO, Vizzeri G, Bowd C, Medeiros FA, Zangwill LM, Weinreb RN. Reproducibility of RTVue retinal nerve fiber layer thickness and optic disc measurements and agreement with Stratus optical coherence tomography measurements. Am J Ophthalmol. 2009;147(6):1067–1074. 1074e1061. doi: 10.1016/j.ajo.2008.12.032. [DOI] [PMC free article] [PubMed] [Google Scholar]
- 23.Li JP, Wang XZ, Fu J, Li SN, Wang NL. Reproducibility of RTVue retinal nerve fiber layer thickness and optic nerve head measurements in normal and glaucoma eyes. Chin Med J (Engl) 2010;123(14):1898–1903. [PubMed] [Google Scholar]
- 24.Cremasco F, Massa G, Goncalves Vidotti V, Pedroso de Carvalho Lupinacci A, Costa VP. Intrasession, intersession, and interexaminer variabilities of retinal nerve fiber layer measurements with spectral-domain OCT. Eur J Ophthalmol. 2011;21(3):264–270. doi: 10.5301/EJO.2010.5469. [DOI] [PubMed] [Google Scholar]
- 25.Paunescu LA, Schuman JS, Price LL, et al. Reproducibility of nerve fiber thickness, macular thickness, and optic nerve head measurements using StratusOCT. Invest Ophthalmol Vis Sci. 2004;45(6):1716–1724. doi: 10.1167/iovs.03-0514. [DOI] [PMC free article] [PubMed] [Google Scholar]
- 26.Mansoori T, Viswanath K, Balakrishna N. Reproducibility of peripapillary retinal nerve fibre layer thickness measurements with spectral domain optical coherence tomography in normal and glaucomatous eyes. Br J Ophthalmol. 2011;95(5):685–688. doi: 10.1136/bjo.2010.183020. [DOI] [PubMed] [Google Scholar]
- 27.Friberg TR, Sanborn G, Weinreb RN. Intraocular and episcleral venous pressure increase during inverted posture. Am J Ophthalmol. 1987;103(4):523–526. doi: 10.1016/s0002-9394(14)74275-8. [DOI] [PubMed] [Google Scholar]
- 28.Jain MR, Marmion VJ. Rapid pneumatic and Mackey-Marg applanation tonometry to evaluate the postural effect on intraocular pressure. Br J Ophthalmol. 1976;60(10):687–693. doi: 10.1136/bjo.60.10.687. [DOI] [PMC free article] [PubMed] [Google Scholar]
- 29.Prata TS, De Moraes CG, Kanadani FN, Ritch R, Paranhos A., Jr Posture-induced intraocular pressure changes: considerations regarding body position in glaucoma patients. Surv Ophthalmol. 2010;55(5):445–453. doi: 10.1016/j.survophthal.2009.12.002. [DOI] [PubMed] [Google Scholar]
- 30.Wuthrich UW. Postural change and intraocular pressure in glaucomatous eyes. Br J Ophthalmol. 1976;60(2):111–114. doi: 10.1136/bjo.60.2.111. [DOI] [PMC free article] [PubMed] [Google Scholar]
- 31.Strouthidis NG, Fortune B, Yang H, Sigal IA, Burgoyne CF. Effect of acute intraocular pressure elevation on the monkey optic nerve head as detected by spectral domain optical coherence tomography. Invest Ophthalmol Vis Sci. 2011;52(13):9431–9437. doi: 10.1167/iovs.11-7922. [DOI] [PMC free article] [PubMed] [Google Scholar]
- 32.Yan DB, Flanagan JG, Farra T, Trope GE, Ethier CR. Study of regional deformation of the optic nerve head using scanning laser tomography. Curr Eye Res. 1998;17(9):903–916. doi: 10.1076/ceyr.17.9.903.5143. [DOI] [PubMed] [Google Scholar]
- 33.Fatehee N, Yu PK, Morgan WH, Cringle SJ, Yu DY. The impact of acutely elevated intraocular pressure on the porcine optic nerve head. Invest Ophthalmol Vis Sci. 2011;52(9):6192–6198. doi: 10.1167/iovs.10-7137. [DOI] [PubMed] [Google Scholar]
- 34.Agoumi Y, Sharpe GP, Hutchison DM, Nicolela MT, Artes PH, Chauhan BC. Laminar and prelaminar tissue displacement during intraocular pressure elevation in glaucoma patients and healthy controls. Ophthalmology. 2011;118(1):52–59. doi: 10.1016/j.ophtha.2010.05.016. [DOI] [PubMed] [Google Scholar]
- 35.Lee BL, Zangwill L, Weinreb RN. Change in optic disc topography associated with diurnal variation in intraocular pressure. J Glaucoma. 1999;8(3):221–223. doi: 10.1097/00061198-199906000-00014. [DOI] [PubMed] [Google Scholar]
- 36.Irak I, Zangwill L, Garden V, Shakiba S, Weinreb RN. Change in optic disk topography after trabeculectomy. Am J Ophthalmol. 1996;122(5):690–695. doi: 10.1016/s0002-9394(14)70488-x. [DOI] [PubMed] [Google Scholar]
- 37.Lesk MR, Spaeth GL, Azuara-Blanco A, et al. Reversal of optic disc cupping after glaucoma surgery analyzed with a scanning laser tomograph. Ophthalmology. 1999;106(5):1013–1018. doi: 10.1016/S0161-6420(99)00526-6. [DOI] [PubMed] [Google Scholar]
- 38.Mansouri K, Shaarawy T. Continuous intraocular pressure monitoring with a wireless ocular telemetry sensor: initial clinical experience in patients with open angle glaucoma. Br J Ophthalmol. 2011;95(5):627–629. doi: 10.1136/bjo.2010.192922. [DOI] [PubMed] [Google Scholar]
- 39.Sung KR, Wollstein G, Schuman JS, et al. Scan quality effect on glaucoma discrimination by glaucoma imaging devices. Br J Ophthalmol. 2009;93(12):1580–1584. doi: 10.1136/bjo.2008.152223. [DOI] [PMC free article] [PubMed] [Google Scholar]
- 40.Wu Z, Huang J, Dustin L, Sadda SR. Signal strength is an important determinant of accuracy of nerve fiber layer thickness measurement by optical coherence tomography. J Glaucoma. 2009;18(3):213–216. doi: 10.1097/IJG.0b013e31817eee20. [DOI] [PMC free article] [PubMed] [Google Scholar]
- 41.Hirooka K, Shiraga F. Relationship between postural change of the intraocular pressure and visual field loss in primary open-angle glaucoma. J Glaucoma. 2003;12(4):379–382. doi: 10.1097/00061198-200308000-00015. [DOI] [PubMed] [Google Scholar]
- 42.Chiquet C, Custaud MA, Le Traon AP, Millet C, Gharib C, Denis P. Changes in intraocular pressure during prolonged (7-day) head-down tilt bedrest. J Glaucoma. 2003;12(3):204–208. doi: 10.1097/00061198-200306000-00004. [DOI] [PubMed] [Google Scholar]
- 43.Morgan WH, Chauhan BC, Yu DY, Cringle SJ, Alder VA, House PH. Optic disc movement with variations in intraocular and cerebrospinal fluid pressure. Invest Ophthalmol Vis Sci. 2002;43(10):3236–3242. [PubMed] [Google Scholar]


