Abstract
Objective:
To evaluate the 5-year impact of stroke and TIA on utility and quality-adjusted survival.
Methods:
TIA and stroke patients from a UK population-based study (Oxford Vascular Study) were recruited from 2002 to 2007, and followed up until 2012. Quality of life was assessed over 5 years using the EQ-5D (EuroQol-5 Dimensions), with responses converted into utilities ranging from −0.59 (worse than death) to 1 (perfect health), using UK population valuations. Utilities for stroke and TIA patients were compared with those in matched controls obtained from the 2006 Health Survey for England. Five-year quality-adjusted life years were estimated by combining utility and survival information.
Results:
Four hundred forty TIA and 748 stroke patients were ascertained and included. Utility remained constant at approximately 0.78 over the 5 years after TIA. Utility improved from 0.64 one month after stroke to 0.70 at 6 months (p = 0.006), remaining at approximately 0.70 thereafter. Matched controls had considerably higher utility levels than stroke/TIA patients (0.85, p < 0.001). Event severity and recurrent stroke were significant predictors of decreased long-term utility. Five-year quality-adjusted life expectancy was 3.32 (95% confidence interval: 3.22–3.48) quality-adjusted life years after TIA and 2.21 (2.15–2.37) after stroke, varying considerably by severity (minor: 2.94; moderate: 1.65; and severe: 0.70).
Conclusion:
Quality-adjusted survival is low over the 5 years after stroke and TIA, with severity and recurrent stroke being major predictors. There remains considerable scope for improvements in acute treatment and secondary prevention to improve the quality of life after TIA and stroke.
Stroke exerts negative effects on patients, affecting many functions and the ability to perform usual activities.1 One approach when measuring its impact is to assess patients' health-related quality of life (QoL). Numerous instruments are available to measure QoL after stroke,2 some of which facilitate utility estimation, whereby QoL is measured from 0 (death) to 1 (perfect health) according to individuals' preferences, and where negative values represent states worse than death. Utilities can be combined with life expectancy to generate quality-adjusted life years (QALYs).3
QALYs are advocated as outcome measures when assessing the cost-effectiveness of interventions.4 Reliable outcome measures are valuable to researchers, particularly as inputs to decision-analytic models. In England, the National Institute for Health and Care Excellence, which uses such models to evaluate new interventions, requires cost-effectiveness information with outcomes measured in QALYs, and QoL measured using the EuroQol-5 Dimensions (EQ-5D).4
Population-based studies with full case ascertainment are the most accurate sources of information on stroke incidence and outcome.5 Although other population-based studies have evaluated long-term health outcomes after stroke,6 only one, the North East Melbourne Incidence Study (NEMESIS) conducted in the 1990s, has evaluated long-term QoL after stroke in terms of utility.7,8 The study objective is to provide up-to-date estimates of long-term outcomes after TIA and stroke by evaluating health-related QoL in terms of utility over a 5-year period using a population-based study.
METHODS
The Oxford Vascular Study (OXVASC) population comprises more than 91,000 patients registered in 9 general practices across Oxfordshire, UK. Study methods have been described elsewhere.9 Patient registration began on April 2002 and is ongoing. Only consenting patients recruited from April 2002 to March 2007 were included in this analysis to ensure a 5-year follow-up, with the current study spanning 10 years (i.e., 2002–2007 for patient recruitment and 2007–2012 for follow-up). Patients in whom TIA/stroke was suspected were ascertained using multiple overlapping methods of “hot” and “cold” pursuit10:
A daily (weekdays only), urgent, open-access “TIA clinic” to which participating general practitioners (GPs) and the local accident and emergency department send all individuals with suspected TIA/stroke whom they would not normally admit to hospital, with alternative on-call review provision at weekends.
Daily searches of admissions to the medical, stroke, neurology, and other relevant wards.
Daily searches of the local emergency attendance register.
Monthly computerized searches of GPs and hospital discharge diagnostic coding.
Monthly searches of all cranial and carotid imaging studies performed in local hospitals.
Monthly reviews of all death certificates and coroners' reports.
Patients were assessed urgently by study clinicians and considered for inclusion. Stroke was defined according to World Health Organization definitions, and included all ischemic events, intracerebral hemorrhage, subarachnoid hemorrhage, and strokes of uncertain type. Stroke subtype was defined using the Trial of Org 10172 in Acute Stroke Treatment (TOAST) classification. Assessments of neurologic impairment, presentation, medical and social history, and risk factors were made. Impairment was measured using the NIH Stroke Scale (NIHSS). Minor stroke was defined as NIHSS scores ≤3, moderate as scores from 4 to 10, and severe as scores >10. All cases were subsequently reviewed by a senior neurologist (P.M.R.) on a daily basis, and imaging results were assessed by the same neuroradiologist. Final classification of TIA, stroke, or other condition was made by the same senior neurologist and neuroradiologist in all cases.
From the first TIA/stroke in the study period for which the patient sought medical attention (referred to as the index event), patients were followed up via their GP and hospital records. Recurrent vascular events were identified by ongoing ascertainment, and all patients had centralized mortality follow-up. Surviving patients were followed up by a nurse at 1, 6, 12, 24, and 60 months after the event, and asked about their current QoL using the EQ-5D-3 levels questionnaire,11 whereby patients are required to report any problems (none, some, or unable/extreme) in 5 attributes. The EQ-5D has been found to be a valid QoL measure after stroke.12 However, during the first 15 months of OXVASC, the EQ-5D was not administered at 6 months, and the 24-month follow-up was discontinued for patients recruited on or after April 1, 2005.
EQ-5D responses were converted into utilities using UK population tariffs developed in the 1990s,13 when a sample of health states was valued using the time-trade-off by 3,337 members of the general public,14 and regression equations were fitted to obtain a tariff for all 243 possible EQ-5D health states, generating a tariff ranging from −0.59 to 1.13
Comparison with controls.
TIA and stroke are associated with old age and comorbidities,9 making their impact on QoL difficult to determine. We compared QoL in OXVASC patients with that in a set of controls, derived from a representative sample of the English population who took part in the 2006 Health Survey for England (HSE) and completed the EQ-5D-3L.15 Although the HSE is conducted annually, the EQ-5D has only been included in the 1996 and 2006 waves. Therefore, for controls, we had only one set of cross-sectional utilities. For each OXVASC follow-up point, cases were matched 1:1 with controls for the following: age at time of follow-up (categorized as younger/older than 70 years); sex; history of diabetes, angina/myocardial infarction, stroke, hypertension, and disability; and marital status. When more than one control was identified, preference was given to controls with the closest age and education levels.
Statistical analyses.
Mean utility and SD are reported. Utility differences between cases and controls were estimated using 1,000 bootstrap estimates.
Survival was estimated using the Kaplan-Meier survival function. A quality-adjusted survival curve was generated by plotting, against time, the product of the mean QoL at each follow-up and the probability of surviving to that follow-up. This area under the curve represents the mean quality-adjusted survival (i.e., 5-year QALYs).16 QALYs were reported as means alongside 95% confidence intervals, calculated using 1,000 bootstrap estimates.
Regression analyses were performed to assess the relationship between 1-month and 5-year utility and potential predictors including event characteristics, age and sex, history of disease and disability, marital and social status, education, and subsequent vascular events. Analyses of utility pose challenges because they are negatively skewed and censored at one.17 Consequently, a 2-part model was used: logistic regression to assess the predictors of reporting problems in the EQ-5D; and conditional on reporting problems in the EQ-5D, a general gamma linear model with a log identity to determine the predictors of utility loss (i.e., 1-utility). Using the product of the 2-part model, we estimated the mean expected utility gain/loss associated with different patient characteristics. Analyses were performed in STATA v.12 (StataCorp, College Station, TX). Statistical significance was set at p < 0.05.
We used multiple imputation to deal with missing data,18 which might lead to statistical power loss and bias.19 Multivariate regressions were used to generate 10 replacement values for each case of missing data, generating 10 imputed datasets using the STATA “mi impute” command (for more details, see e-Methods and tables e-1 and e-2 on the Neurology® Web site at www.neurology.org). The multivariate analyses used to assess the predictors of utility were then repeated by combining information from the 10 imputed datasets using STATA's “micombine” command.18
Standard protocol approvals, registrations, and patient consents.
OXVASC is approved by our local ethics committee. Written consent was obtained from all patients (or their relatives) participating in the study.
RESULTS
Patient sample.
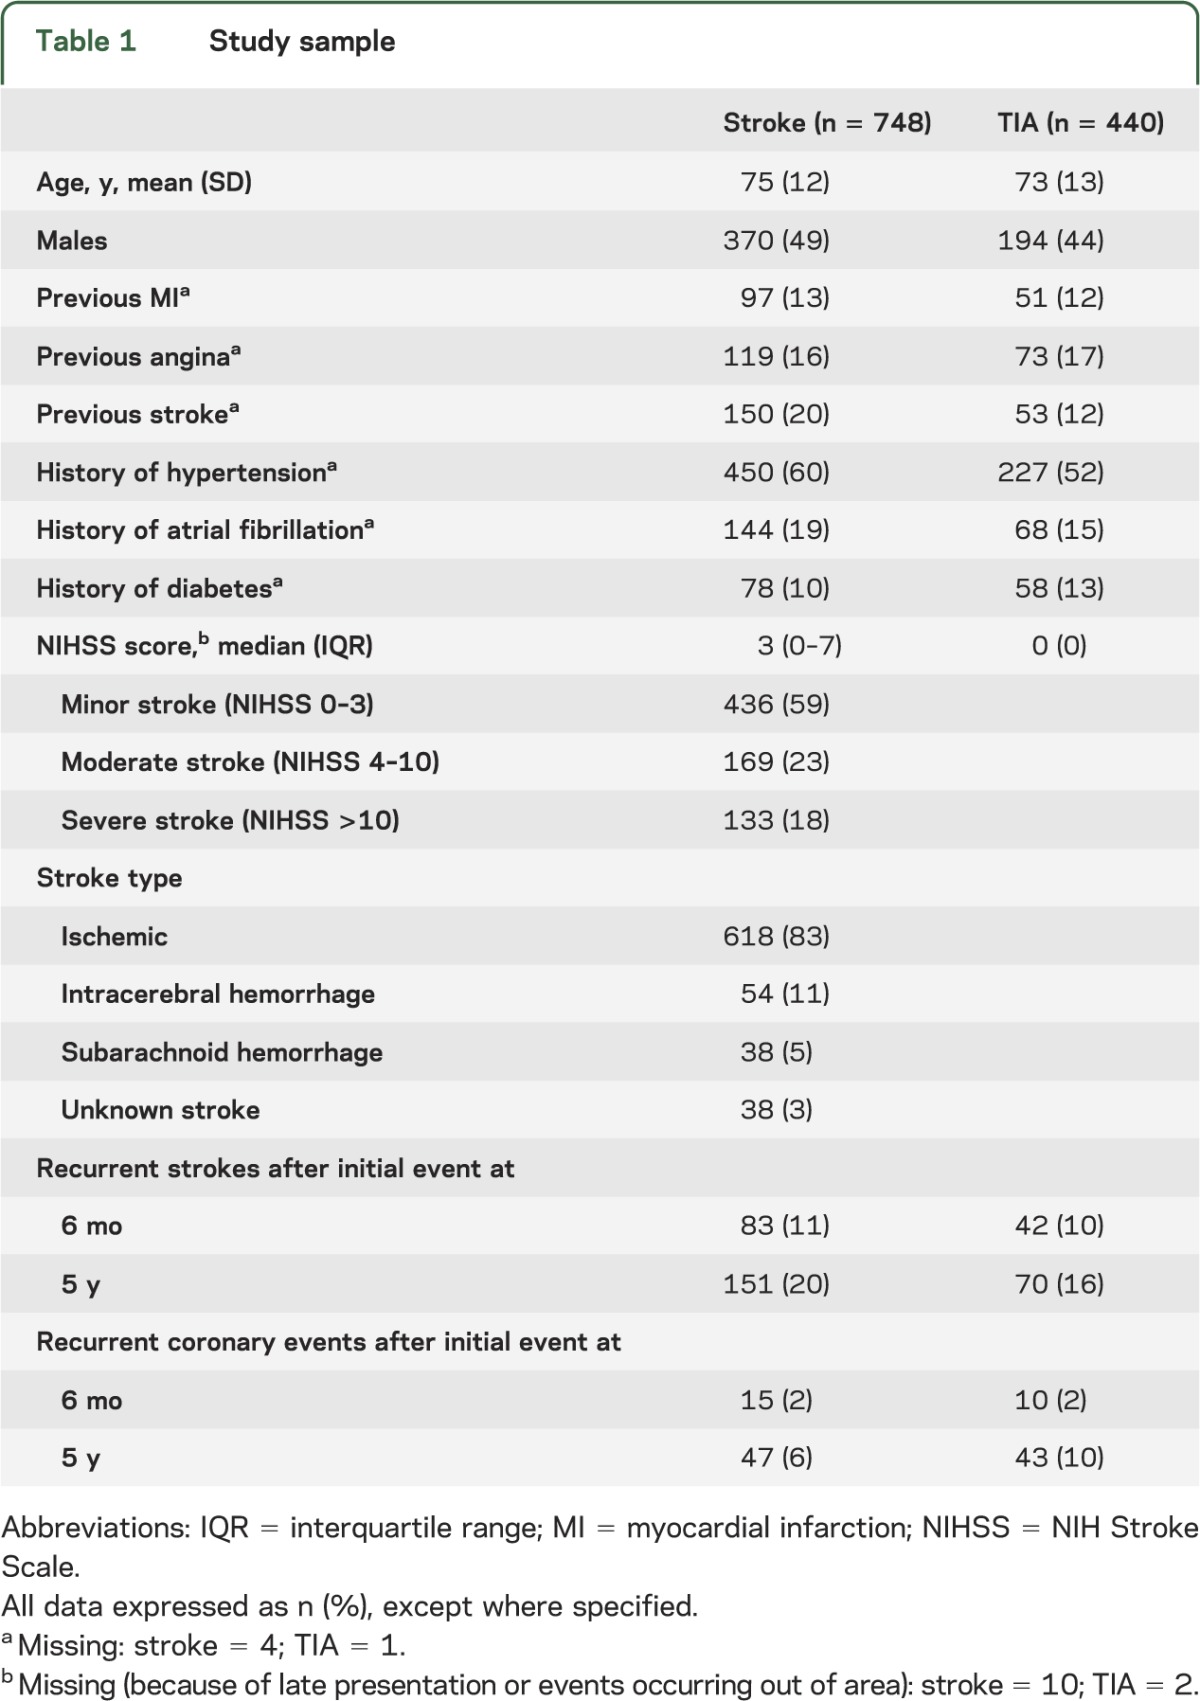
During the study period, 748 patients experienced a stroke and 440 patients a TIA as their index event (table 1). Of 738 (99%) strokes with available NIHSS scores, 436 (59%) were classified as minor, 169 (23%) as moderate, and 133 (18%) as severe.
Table 1.
Study sample
EQ-5D information was available for 759 (70%), 723 (75%), and 479 (67%) patients alive at the 1-, 12-, and 60-month follow-up, respectively. Because the EQ-5D was not included in the 6-month follow-up for the first 15 months of OXVASC, data were not available at 6 months for 251 patients (25%), with data missing in an additional 176 patients (17%). Because the 2-year follow-up was discontinued for patients recruited after April 2005, data were not available at 2 years for 338 patients (37%), with outcome information missing in a further 134 patients (15%). Reasons for missing data are reported in table e-3.
A control sample was drawn from 12,565 individuals aged 18 years or older completing the EQ-5D in the 2006 HSE. Of the 759 TIA and stroke cases with EQ-5D responses at 1 month, a control was found for 652 cases (86%), with similar proportions for the utility comparisons at 6-month (91%), 1-year (87%), 2-year (87%), and 5-year (89%) follow-ups.
EQ-5D utility values after TIA or stroke.
EQ-5D responses are reported in table e-4. At 1 month, stroke patients' mean utility was 0.64 compared with 0.78 (p < 0.001) for TIA patients (table 2). For TIA patients, utility did not vary over the 5-year follow-up. However, stroke patients' utility had increased to 0.70 by 6 months (p = 0.006). Even after removing from the 1-month utility average those patients who subsequently died, this improvement in utility was still observed at 6 months. For the 287 stroke patients surviving past 6 months and completing the EQ-5D at both the 1- and 6-month follow-ups, EQ-5D utility improved from 0.67 at 1 month to 0.72 at 6 months (p = 0.001).
Table 2.
EQ-5D utility after index TIA or stroke
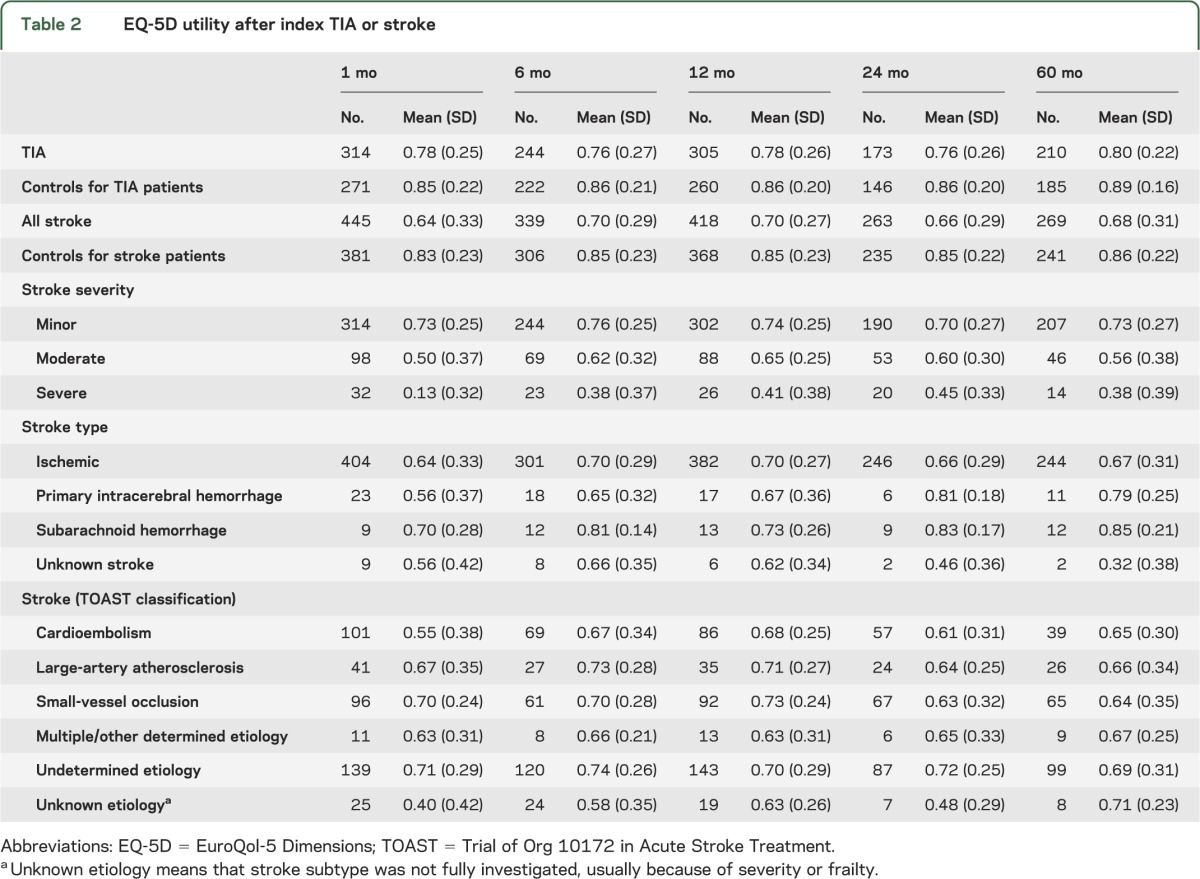
At 1 month, average utility for severe stroke patients was 0.13 compared with 0.50 for moderate stroke and 0.73 for minor stroke patients (table 2). For severe stroke patients, utility increased to 0.45 at 2 years (p = 0.001), whereas for minor stroke patients, utilities remained constant over the 5-year follow-up period. The great majority of patients reporting utilities lower than 0 were patients who had moderate and severe stroke (figure e-1).
Impact of TIA and stroke on EQ-5D utility: Comparison with controls.
Mean EQ-5D utility for matched TIA patients at 1 month was 0.77 compared with 0.85 for controls, a mean difference of −0.08 (95% confidence interval: −0.12 to −0.04; p < 0.001). The average utility for matched stroke patients at 1 month was 0.61 compared with 0.83 for controls, a mean difference of −0.22 (−0.26 to −0.18; p < 0.001). Utilities for matched cases at 5 years postevent were lower than for controls: −0.09 (−0.13 to −0.05; p < 0.001) for TIA and −0.18 (−0.23 to −0.13; p < 0.001) for stroke.
Quality-adjusted life years.
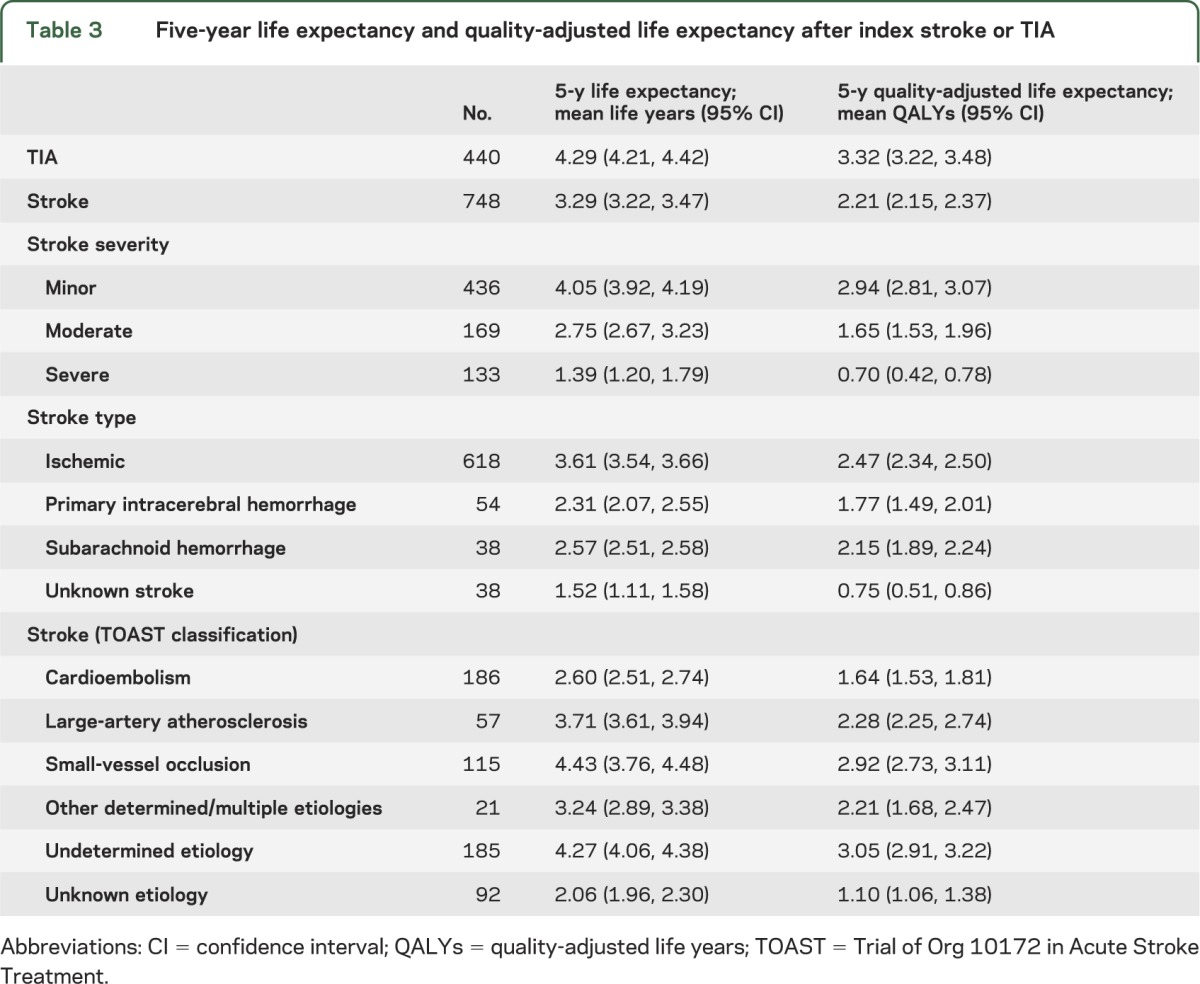
Survival data (figure 1) were combined with utility to estimate 5-year QALYs. Of a possible 5 years in perfect health, stroke patients lost 1.71 years due to mortality, and a further 1.08 due to reduced QoL, resulting in 2.21 QALYs (table 3). Patients whose stroke subtype was not fully investigated (i.e., unknown TOAST type), either because of event severity or frailty, had particularly poor prognosis with a 5-year quality-adjusted life expectancy of 1.10 QALYs. For TIA patients, 5-year life expectancy was 4.29 years, which after adjusting for QoL was reduced to 3.32 QALYs. Considerable 5-year quality-adjusted survival differences were observed depending on stroke severity: 2.94 QALYs after minor stroke, 1.65 after moderate stroke, and 0.70 for severe stroke. Table e-5 reports QALYs in present value terms, with gains occurring after the first year discounted.
Figure 1. Five-year survival.
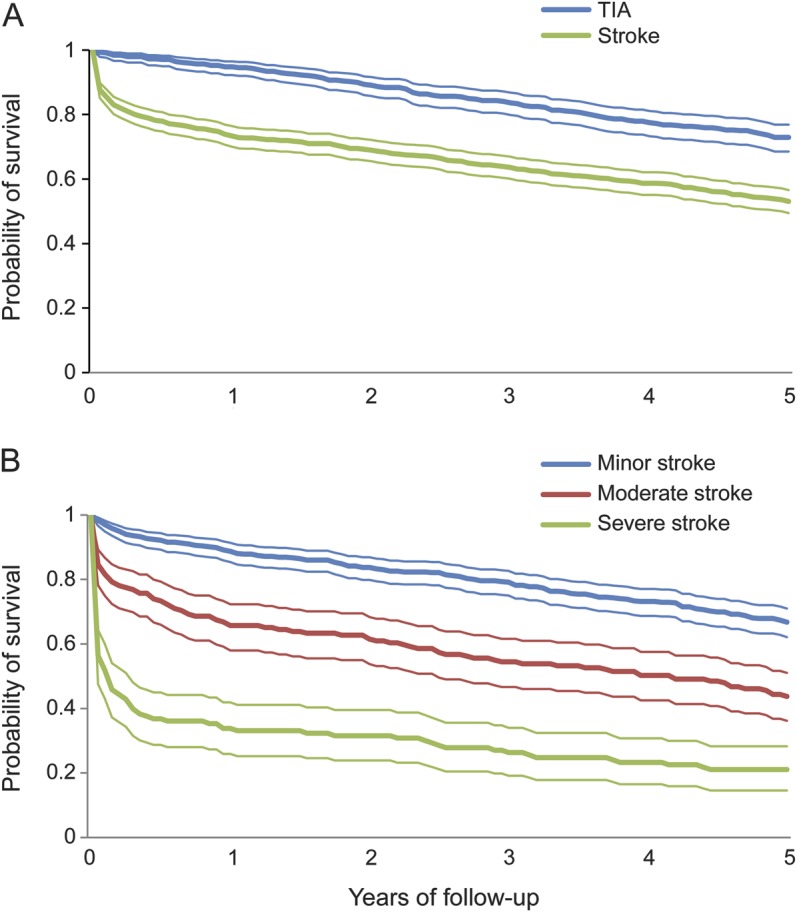
(A) After index stroke or TIA. (B) By stroke severity.
Table 3.
Five-year life expectancy and quality-adjusted life expectancy after index stroke or TIA
Predictors of short- and long-term EQ-5D utility after stroke and TIA.
A 2-part regression model was used to ascertain the predictors of utility (table e-6). Using the probability of reporting problems in the EQ-5D and the associated utility loss, we estimated the mean expected utility gain/loss associated with different patient characteristics (table 4). Event severity was a predictor of diminished utility both in the short- and long-term, with a 1-point NIHSS score increase reducing utility by 0.029 at 1 month and by 0.031 at 5 years. Although having a stroke, as opposed to a TIA, was not a predictor of 1-month utility, stroke patients' utility was 0.057 lower than TIA patients at 5 years. Experiencing one or more recurrent strokes was also a predictor of decreased utility, reducing utility by 0.150 at 1 month and 0.068 at 5 years.
Table 4.
Predictors of EQ-5D utility at 1 month and 5 years after index TIA or stroke
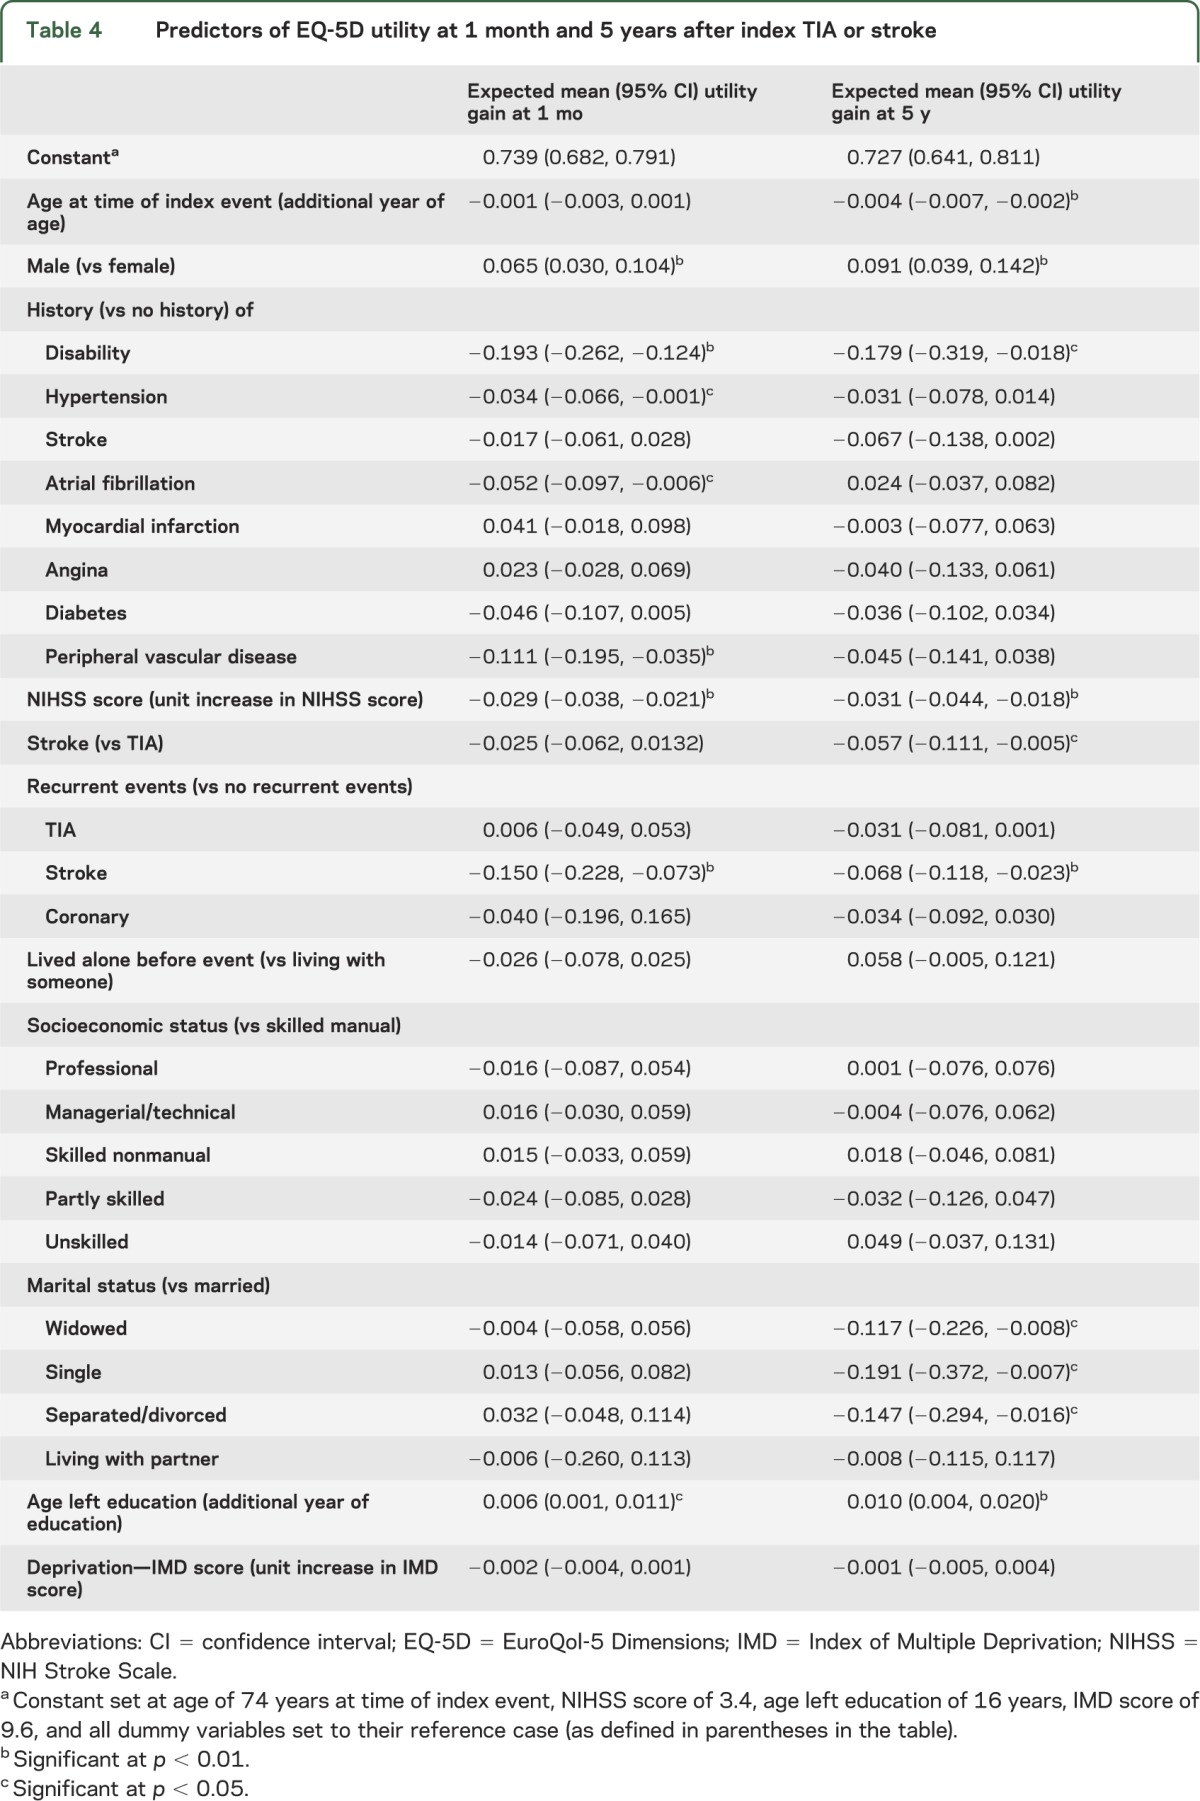
Men were found to have higher utility than women at both 1 month and 5 years after the event (table 4). Education levels also predicted short- and long-term utility. After controlling for patient characteristics, married patients had significantly higher utilities than did widowed, single, and separated/divorced patients.
The results of the regression analysis did not vary substantially when cases with missing data were imputed (table e-7). However, given the increase in sample size, more variables became statistically significant including: age, and having a stroke as index event for the 1-month analysis; and having recurrent coronary events and living alone for the 5-year analysis.
DISCUSSION
QALYs have become the dominant outcome measure in health economic evaluation.20 Much of the cost-effectiveness evidence that public agencies consider derives from decision-analytic models, and it is paramount that model inputs, such as utility and survival estimates, are reliable and up to date.
However, this is only the second population-based study to assess utility over the long term after stroke, is the first in Europe, and the first to include TIA. Our study shows that utility for TIA and stroke patients was lower throughout the 5-year follow-up than for matched controls. Consequently, quality-adjusted survival was considerably affected after stroke and TIA, with 5-year quality-adjusted life expectancy being 2.21 QALYs for stroke and 3.32 QALYs for TIA patients.
Because TIA symptoms leave little or no permanent damage to the brain, TIA would be expected to have little impact on QoL. However, the overall combined effect of medication, anxiety about experiencing subsequent events, and, for those in employment, the impact on their working life, will affect QoL. For example, one study found that 1 month after TIA, patients who were clinically considered to have made a full recovery had QoL scores below population norms, with 27% having anxiety symptoms.21 Subsequent stroke will also affect TIA patients' QoL: we found that having subsequent strokes during the period between TIA onset and 1-month follow-up reduced utility by 0.150 points.
For stroke patients, we found an improvement in utility between 1 and 6 months, which was then maintained throughout the remaining 5 years. Although some improvement was attributable to more severe, sicker patients dying between follow-ups, the improvement remained when the analysis was limited to survivors. Although we found low levels of utility at 5 years when compared with controls, our estimates were higher than those observed in NEMESIS,7,8 the only other population-based study evaluating long-term utility after stroke. In NEMESIS, average utility for 5-year stroke survivors was 0.50, compared with 0.68 in OXVASC.
Such differences could be explained by 1) different settings and populations (in the UK, only 62% of stroke patients are hospitalized,22 compared with 85% in Australia23); 2) differences in stroke severity (because NEMESIS did not ascertain TIAs, minor strokes might have been underascertained); 3) OXVASC used the EQ-5D, whereas NEMESIS used the Assessment of QoL instrument to measure QoL24; and 4) different valuation methods. In the EQ-5D, tariffs were derived from a representative sample of the UK population.14 In the Assessment of QoL, these were derived from samples of patients and Melbourne residents.24 However, in both studies, the predictors of long-term utility included age, sex, event severity, and stroke recurrence.
The limitations of this study should be noted. First, between 20% and 30% of EQ-5D data were missing for reasons including patient refusal to be followed up face-to-face, patients being too ill/disabled, and patients not attending follow-up appointments or simply being lost to follow-up. Also, during the first 15 months of OXVASC, the EQ-5D was not administered to patients at the 6-month follow-up, and after April 2007, 2-year follow-up visits were no longer undertaken.
To assess the impact of missing data, we used multiple-imputation methods. The results indicated that average utility was lower than in the complete-case analysis. Differences were greatest for the more severe events, suggesting that severe stroke survivors with no utility data had even more severe events than those cases with complete data. For example, mean NIHSS score for severe stroke cases with no utility data were 18.7 compared with 14.4 for severe stroke cases with utility data at 1 month (p < 0.001). Given that patients with very high NIHSS scores are likely to have language or cognitive deficits, these patients were more likely to have missing EQ-5D data because they were not able to complete the EQ-5D. One option, used by other researchers to circumvent this problem, is to obtain hypothetical estimates of the utility associated with hypothetical major stroke among patients with and without a history of stroke.25
Second, we assessed the direct impact of stroke and TIA by comparing utilities of cases with that of matched controls. Although we managed to match approximately 90% of cases, our controls were not recruited concurrently to cases, but were drawn from a cross-sectional survey with just one EQ-5D measurement in 2006, and with ascertainment of comorbidities only by self-report. It is possible that cases and controls could have differed regarding unmeasured factors that are protective against stroke/TIA.
The impact of high case fatality and attrition reduced the available study sample. As a result, for certain characteristics such as stroke type, the relatively low numbers of patients surviving intracerebral hemorrhage and subarachnoid hemorrhage, rendered any statistical analyses inconclusive.
Finally, EQ-5D responses were converted into utilities using UK tariffs developed in the 1990s; these are widely used, but might not accurately reflect the utilities of the current UK population if, for example, preferences have changed. A new UK population EQ-5D tariff has been proposed, but is still under development. The UK tariff used for this current study is recommended in current English guidelines for health technology assessment.4
This study has shown that 5-year quality-adjusted survival after stroke and TIA is substantially reduced. Being older, female, having a moderate to severe stroke, and subsequent strokes after event onset were independent factors in predicting lower utility. Consequently, there remains considerable scope for improvements in acute treatment and secondary prevention to improve QoL after TIA and stroke.
Supplementary Material
ACKNOWLEDGMENT
The authors are grateful to all patients who took part in the study and thank all primary care practices and physicians who collaborate with OXVASC.
GLOSSARY
- EQ-5D
EuroQol-5 Dimensions
- GP
general practitioner
- HSE
Health Survey for England
- NEMESIS
North East Melbourne Incidence Study
- NIHSS
NIH Stroke Scale
- OXVASC
Oxford Vascular Study
- QALY
quality-adjusted life year
- QoL
quality of life
- TOAST
Trial of Org 10172 in Acute Stroke Treatment
Footnotes
Supplemental data at www.neurology.org
AUTHOR CONTRIBUTIONS
R.L.-F.: study concept and design, data management, draft and revision of the manuscript, statistical analysis, interpretation of data. A.M.G.: revision of the manuscript, interpretation of data, statistical analysis. L.B., S.W., F.C.: data acquisition, revision of the manuscript. P.M.R.: study concept and design, revision of the manuscript, interpretation of data, study supervision.
STUDY FUNDING
R.L.-F. is funded from an Economic and Social Research Council/Medical Research Council/National Institute for Health Research (NIHR) early career fellowship in economics of health. The research was supported by the NIHR Oxford Biomedical Research Centre Programme. OXVASC is funded by the UK Medical Research Council, the Dunhill Medical Trust, Wellcome Trust, and the Stroke Association. The Health Economics Research Centre obtains part of its funding from the NIHR.
DISCLOSURE
R. Luengo-Fernandez receives funding from a UK National Institute for Health Research/Medical Research Council/Economic and Social Research Council postdoctoral fellowship in Health Economics. A.M. Gray is in receipt of an NIHR Senior Investigator Award. L. Bull, S. Welch, and F. Cuthbertson report no disclosures. P.M. Rothwell is in receipt of an NIHR Senior Investigator Award and Wellcome Trust Senior Investigator Award. Go to Neurology.org for full disclosures.
REFERENCES
- 1.Stroke prevention by the practitioner: epidemiology of stroke. Cerebrovasc Dis 1999;9(suppl 4):1–68 [DOI] [PubMed] [Google Scholar]
- 2.Jenkinson C, Gibbons E, Fitzpatrick R. A structured review of patient-reported outcome measures (PROMs) for stroke: report to the Department of Health [online]. Available at: http://phi.uhce.ox.ac.uk/pdf/PROMs_Oxford_Stroke_17092010.pdf. Accessed June 4, 2013
- 3.Torrance GW, Feeny D. Utilities and quality-adjusted life years. Int J Technol Assess Health Care 1989;5:559–575 [DOI] [PubMed] [Google Scholar]
- 4.National Institute for Health and Care Excellence Guides to the methods of technology appraisal [online]. Available at: http://publications.nice.org.uk/pmg9. Accessed June 4, 2013 [PubMed]
- 5.Feigin VL, Hoorn SV. How to study stroke incidence. Lancet 2004;363:1920. [DOI] [PubMed] [Google Scholar]
- 6.Gall SL, Tran PL, Martin K, Blizzard L, Srikanth V. Sex differences in long-term outcomes after stroke. Stroke 2012;43:1982–1987 [DOI] [PubMed] [Google Scholar]
- 7.Paul SL, Sturm JW, Dewey HM, Donnan GA, Macdonell RAL, Thrift AG. Long-term outcome in the North East Melbourne stroke incidence study: predictors of quality of life at 5 years after stroke. Stroke 2005;36:2082–2086 [DOI] [PubMed] [Google Scholar]
- 8.Leach MJ, Gall SL, Dewey HM, Macdonell RAL, Thrift AG. Factors associated with quality of life in 7-year survivors of stroke. J Neurol Neurosurg Psychiatry 2011;82:1365–1371 [DOI] [PubMed] [Google Scholar]
- 9.Rothwell PM, Coull AJ, Silver LE, et al. Population-based study of event-rate, incidence, case fatality, and mortality for all acute vascular events in all arterial territories (Oxford Vascular Study). Lancet 2005;366:1773–1783 [DOI] [PubMed] [Google Scholar]
- 10.Coull AJ, Silver LE, Bull LM, Giles MF, Rothwell PM. Direct assessment of completeness of ascertainment in a stroke incidence study. Stroke 2004;35:2041–2045 [DOI] [PubMed] [Google Scholar]
- 11.EuroQol Group How to use EQ-5D [online]. Available at: http://www.euroqol.org. Accessed November 14, 2012
- 12.Dorman PJ, Waddell F, Slattery J, Dennis M, Sandercock P. Is the EuroQol a valid measure of health-related quality of life after stroke? Stroke 1997;28:1876–1882 [DOI] [PubMed] [Google Scholar]
- 13.Dolan P. Modeling valuations for EuroQol health states. Med Care 1997;35:1095–1108 [DOI] [PubMed] [Google Scholar]
- 14.Dolan P, Gudex C, Kind P, Williams A. The time trade-off method: results from a general population study. Health Econ 1996;5:141–154 [DOI] [PubMed] [Google Scholar]
- 15.The Information Centre Health Survey for England 2006: cardiovascular disease and risk factors [online]. Available at: http://www.ic.nhs.uk/pubs/hse06cvdandriskfactors. Accessed November 14, 2012
- 16.Billingham LJ, Abrams DR, Jones DR. Methods for the analysis of quality-of-life and survival data in health technology assessment. Health Technol Assess 1999;3:1–152 [PubMed] [Google Scholar]
- 17.Pullenayegum EM, Tarride JE, Xie F, O'Reilly D. Calculating utility decrements associated with an adverse event: marginal Tobit and CLAD coefficients should be used with caution. Med Decis Making 2011;31:790–799 [DOI] [PubMed] [Google Scholar]
- 18.Rubin DB. Multiple Imputation for Nonresponse in Surveys. New York: John Wiley & Sons; 1987 [Google Scholar]
- 19.Shafer JL, Graham JW. Missing data: our view of the state of the art. Psychol Methods 2002;7:147–177 [PubMed] [Google Scholar]
- 20.Baker B, Bateman I, Donaldson C, et al. Weighting and valuing quality-adjusted life-years using stated preference methods: preliminary results from the Social Value of a QALY Project. Health Technol Assess 2010;14:1–162 [DOI] [PubMed] [Google Scholar]
- 21.Verbraak ME, Hoeksma AF, Lindeboom R, Kwa VIH. Subtle problems in activities of daily living after transient ischemic attack or an apparently fully recovered non-disabling stroke. J Stroke Cerebrovasc Dis 2012;21:124–130 [DOI] [PubMed] [Google Scholar]
- 22.Luengo-Fernandez R, Gray A, Rothwell PM. Population-based study of determinants of initial secondary care costs of acute stroke in the United Kingdom. Stroke 2006;37:2579–2587 [DOI] [PubMed] [Google Scholar]
- 23.Sturm JW, Dewey HM, Donnan GA, Macdonell RA, McNeil JJ, Thrift AG. Handicap after stroke: how does it relate to disability, perception of recovery, and stroke subtype? The North East Melbourne Stroke Incidence Study (NEMESIS). Stroke 2002;33:762–768 [DOI] [PubMed] [Google Scholar]
- 24.Hawthorne G, Richardson J, Osborne R. The Assessment of Quality of Life (AQoL) instrument: a psychometric measure of health-related quality of life. Qual Life Res 1999;8:209–224 [DOI] [PubMed] [Google Scholar]
- 25.Samsa GP, Matchar DB, Goldstein L, et al. Utilities for major stroke: results from a survey of preferences among persons at increased risk for stroke. Am Heart J 1998;136:703–713 [DOI] [PubMed] [Google Scholar]
Associated Data
This section collects any data citations, data availability statements, or supplementary materials included in this article.


