

Abstract
An imbalance between cortical excitation and inhibition is a central component of many models of autistic neurobiology. We tested a potential behavioral footprint of this proposed imbalance using binocular rivalry, a visual phenomenon in which perceptual experience is thought to mirror the push and pull of excitatory and inhibitory cortical dynamics. In binocular rivalry, two monocularly presented images compete, leading to a percept that alternates between them. In a series of trials, we presented separate images of objects (e.g., a baseball and a broccoli) to each eye using a mirror stereoscope and asked human participants with autism and matched control subjects to continuously report which object they perceived, or whether they perceived a mixed percept. Individuals with autism demonstrated a slower rate of binocular rivalry alternations than matched control subjects, with longer durations of mixed percepts and an increased likelihood to revert to the previously perceived object when exiting a mixed percept. Critically, each of these findings was highly predictive of clinical measures of autistic symptomatology. Control “playback” experiments demonstrated that differences in neither response latencies nor response criteria could account for the atypical dynamics of binocular rivalry we observed in autistic spectrum conditions. Overall, these results may provide an index of atypical cortical dynamics that may underlie both the social and nonsocial symptoms of autism.
Introduction
From the moment we open our eyes, we receive two slightly dissimilar images of the world. Normally, these two sources of input are complementary: their disparity provides dimensional cues about elements in the environment, and they are resolved into a rich and unified perceptual experience. This unified percept collapses when incongruous images are presented to each eye, creating interocular conflict. During such conflict, each image is perceived singly and serially, in stochastic alternation (Wheatstone, 1838). This phenomenon, known as “binocular rivalry,” is mediated by competitive interactions between populations of neurons that code for the two inputs at various levels of visual processing. As an image is suppressed from perceptual awareness, electrophysiology and functional imaging techniques reveal a concomitant reduction in the amplitude of response in brain regions that process the nondominant image, which is reversed as that percept regains dominance (Sheinberg and Logothetis, 1997; Tong and Engel, 2001). As a result, the distributions of the durations of sequential dominant percepts are known to be very regular, comparable between human and monkey (Leopold and Logothetis, 1996).
The reliance of binocular rivalry on competitive interactions in the visual cortex makes it an ideal paradigm with which to investigate the autistic brain. An imbalance between cortical excitation and inhibition has been posited to characterize the autistic cortex (Rubenstein and Merzenich, 2003; Vattikuti and Chow, 2010). Furthermore, such an imbalance has been proposed as the source of varied features of autistic spectrum conditions (ASCs), such as an enhanced perception of visual detail (Kéïta et al., 2011), atypical motion perception (Foss-Feig et al., 2013), and a propensity toward repetitive behaviors (Marín, 2012). But testing these hypotheses in ASCs has proved challenging, requiring a behavioral test that affords a simple way to quantify atypical excitatory–inhibitory interactions.
Binocular rivalry, which has been suggested to depend on the relative levels of cortical excitation and inhibition (Laing and Chow, 2002; Wilson, 2003), may provide such a test. Changes in the balance of excitatory–inhibitory interactions modulate rivalry dynamics in computational models (Dayan, 1998; Klink et al., 2010; Said et al., 2013), and pharmaceutical manipulations of GABA levels alter rivalry in humans (van Loon et al., 2013). We tested participants with autism and matched control subjects in a classic rivalry paradigm, presenting different object images to each eye and asking participants to continuously report which object they perceived or whether they had a mixed percept. We found that binocular rivalry dynamics were significantly affected in autism. Specifically, autistic individuals had a reduced rate of switching between percepts, a higher proportion of reversions to the previous percept, and longer durations of mixed percepts—all of which correlated with clinical measures of autistic symptomatology, potentially reflecting the atypical cortical dynamics that are hypothesized to characterize the autistic brain.
Materials and Methods
Participants.
Twenty adults with high-functioning autism (12 males, 8 females) and 19 control subjects (4 males, 15 females) were recruited from the Cambridge University Autism Research Centre volunteer database (www.autismresearchcenter.com), autism clinics, and support centers throughout the United Kingdom. All patients met international criteria for ASCs according to the Diagnostic and Statistical Manual of Mental Disorders, 4th edition (DSM-IV), as judged by clinicians specializing in the assessment and diagnosis of ASCs. All participants had normal or corrected-to-normal vision, and individuals with other psychiatric conditions, such as attention deficit-hyperactivity disorder, were not recruited. Written consent was obtained from all participants in accordance with a protocol approved by the Cambridge University Psychology Research Ethics Committee.
Psychometric testing.
Participants completed the Wechsler Abbreviated Scale of Intelligence. ASCs and control groups were matched in age (t = 1.53, p > 0.13) and nonverbal IQ (t = 0.15, p > 0.88; Table 1). All participants also completed the Autism Spectrum Quotient (AQ), a self-report questionnaire that quantifies autistic traits across both ASCs and control populations (Baron-Cohen et al., 2001). Additionally, an hour-long diagnostic protocol was administered to all ASC participants [Autism Diagnostic Observation Schedule (ADOS); Lord et al., 2000].
Table 1.
Psychometric data
| Subjects | N | Minimum | Maximum | Mean | SD |
|---|---|---|---|---|---|
| ASC | |||||
| Age (years) | 20 | 19 | 52 | 33.3 | 9.932 |
| IQ | 19 | 86.00 | 140.00 | 119.68 | 11.314 |
| Gender | 12 M/8 F | ||||
| Control | |||||
| Age | 19 | 20 | 52 | 28.79 | 8.324 |
| IQ | 18 | 101.00 | 137.00 | 119.17 | 9.192 |
| Gender | 4 M/15 F |
ASC and control groups were matched in age (t = 1.53, p > 0.13) and nonverbal IQ (t = 0.15, p > 0.88). M, Male; F, female.
Procedure and psychophysical setup: main experiment.
On each run, two distinct objects (e.g., a baseball and a piece of broccoli) appeared on the left and right of the screen, on the horizontal meridian (Fig. 1a). Each object (average width: 2.79°; average height: 2.31°) was displayed within a tinted square (green or red; width: 3.5°), which was surrounded by a black circle to support binocular fusion (radius: 4.95°; Meng and Tong, 2004). Stimuli were chosen from a bank of standardized nonsocial objects. Different sets of images were presented in each run, and the side of the screen on which a red or green square was presented was counterbalanced.
Figure 1.

Binocular rivalry paradigm. a, Experimental setup. Two images, each randomly selected from a bank of standard objects, were presented on the horizontal meridian of an LCD screen, surrounded by a black circle (radius: 4.95°) and a tinted square (width: 3.5°; red or green). A mirror stereoscope reflected the left and right sides of the screen to the participants' left and right eyes (respectively), so that each eye viewed a unique image. This presentation is known to induce binocular rivalry, in which the two incongruous monocular inputs “rival” for perceptual awareness, so that only one input dominates perceptual experience at any given instant. b, A sample sequence of binocular rivalry alternations. Throughout a run, participants were instructed to continuously report their perceived image (red, green, intermediate) through button press (right, left, up). The end of an episode of perceptual dominance was labeled a “transition.” Transitions were retrospectively divided into switches (e.g., R-Up-L) and reversions (e.g., L-Up-L).
Participants viewed a Dell LCD monitor (width: 43.5 cm; resolution: 1600 × 900; refresh rate: 60 Hz) from a distance of 43 cm (fixed using a chin rest) through a mirror stereoscope. The stereoscope reflected the left and right sides of the screen into the participants' left and right eyes, so that each eye was presented with only one of the two images (red/green; Fig. 1a). Fusion was achieved for each participant by slowly moving the two black circles from the edge toward the center of the screen until the point at which participants reported seeing one circle. All testing took place in a darkened room.
Before the experiment, participants were given instruction and practice with the task. Participants were instructed to continuously indicate whether they perceived “the red image, the green image, or a mixture of the two images.” Testing sessions were composed of two 30 s practice runs, followed by four 60 s experimental runs. Each run was separated by a 15 s break, the end of which was indicated by three 1-s-long beeps. At the beginning of each run, the black circles appeared and participants controlled object onset by pressing the “Up” key to start the run.
Participants were asked to continuously report whether they perceived a fully dominant percept—the red image (right key) or the green image (left key)—or a mixture of the two images (up key), which is sometimes observed between phases of perceptual dominance (Klink et al., 2010).
Performance analysis: main experiment.
Since the key press was continuous (sampling rate: 4 ms), a sequence of perceptual transitions was computed as events in which one continuous key press was terminated and another began (Fig. 1b). Key presses lasting <150 ms or periods where no key was pressed were omitted from the analysis. The sequence of perceptual transitions was subdivided into two classes: switches and reversions. “Switches” were defined as sequences in which the perceptual report shifted from one object to the other (left (L) to right (R) or R to L), with or without an intermediate mixed percept (Up). In contrast, reversions were defined as sequences in which the percept reverted to the previously reported object following a mixed percept (L-Up-L or R-Up-R; Fig. 1b). The frequencies of transitions, switches, and reversions, as well as the duration of any percept (red, green, or mixed) were calculated. Participants whose percept durations were determined to fall outside of 2 SDs of the group mean (dominance durations: one ASC; mixed-percept durations: one control) were excluded from the reported analyses. All analyses were performed both with and without these participants; they did not qualitatively influence the results. All effects reported below remained significant when age, IQ, or gender were treated as covariates of no interest (all p < 0.05).
Procedure: control experiments.
A subset of the participants from our main experiment (N = 21, 10 ASCs) participated in two “playback” control experiments (collected during a separate testing session) during which they viewed a simulated series of binocular rivalry alternations through a mirror stereoscope. Throughout a run, two distinct objects (the same used in the main experiment, e.g., a baseball and a piece of broccoli) appeared in temporal alternation on the screen, interposed by computer-generated mixed-image transition periods, to simulate the experience of binocular rivalry (for similar playback control experiments used in previous studies, see Lee and Blake, 2004; Baker and Graf, 2009).
The stimuli were presented using exactly the same setup and stimulus parameters as in the main experiment, but identical images were continuously presented to each eye. Participants were given the same instructions as in the initial rivalry experiment: to continuously report whether they perceived a fully dominant stimulus—the red image (right key) or the green image (left key)—or a mixture of the two images (up key).
Following two 30 s practice runs, participants performed four runs in each of two experiments: (1) “sudden onset,” and (2) the “gradual onset.” Each run lasted for 60 s (∼16 transitions). On average, two transitions in each run were “reversions,” to simulate the typical rivalry experience. Reversions were omitted from any response time analyses reported below; all results were qualitatively similar whether they were included or not.
Stimuli: control experiments.
In each control experiment, we used a linear blending computation in MATLAB (Open GL α blending) to create physical transitions between the stimuli. During a transition, the proportion of either image displayed at any pixel was determined by 15 Gaussian filters, which were distributed randomly within the image.
In the “sudden-onset” experiment, participants viewed stepwise, sudden transitions between single-image and mixed-image stimuli (a 50% blend of the two images; see Fig. 4a). This stepwise, sudden transition allowed us to determine whether there were any differences in participants' response latencies to clear, obvious transitions. The duration of each stimulus in this condition was drawn from the duration distributions of dominant and mixed percepts that we observed in our main experiment. Because these durations were different for each group in the main experiment (Fig. 2e), each participant participated in two runs during which transition durations were drawn from the ASC group's distributions [“autism-matched playback”: mixed-image mean (±SD) = 2.75 ± 1.90 s; single-image mean = 2.09 ± 1.01 s], and two runs during which mixed-image presentation durations were drawn from the control group's distributions (“control-matched playback”: mixed-image mean = 1.41 ± 0.72 s; single-image mean = 2.28 ± 0.94 s). All durations <0.5 s were rounded to 0.5 s to ensure participants' had adequate time to respond. Playback trials were created from the group distributions (rather than each subject viewing their own trace), so that each individual could participate in both control-matched and ASC-matched playback trials, avoiding the possibility of an own-versus-other trace effect that would be completely confounded with the type of playback.
Figure 4.
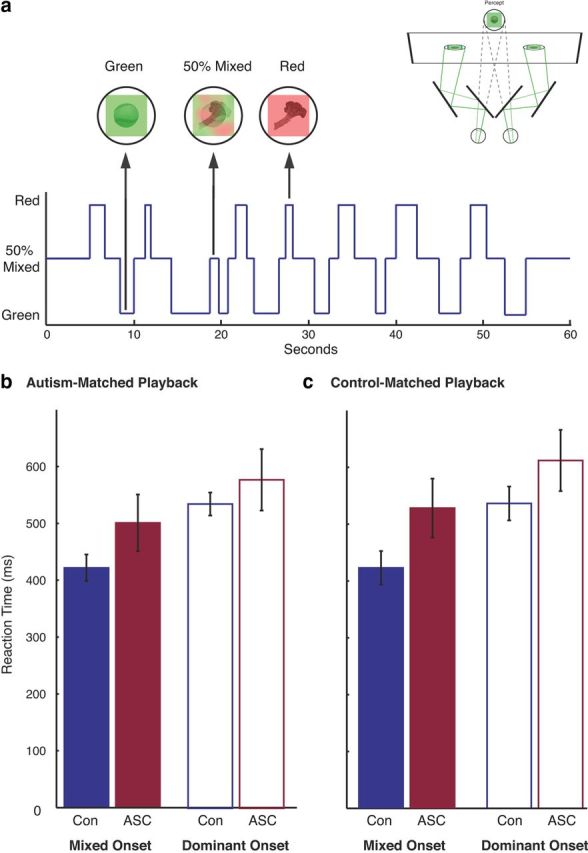
Sudden-onset rivalry playback experiment. a, To test whether individuals with and without ASCs have different response latencies to report perceptual changes during rivalry, we designed a control experiment in which participants viewed a sequence of playback rivalry alternations in which computer-generated mixed stimuli (50% blends of the two stimuli displayed in each trial) interposed dominant stimulus presentations with instantaneous transitions. b, c, Response latencies to detect the sudden onset of mixed (solid bars) and single-image (open bars) stimuli during the playback sequences drawn from the ASC (b) or control (c) rivalry reports. Although individuals with ASCs demonstrated atypical dynamics during actual binocular rivalry, the results of our sudden-onset control experiment demonstrated no significant differences in response latency compare with a sequence of sudden stimuli onsets between ASC and control participants. In all plots, error bars represent 1 SEM.
Figure 2.
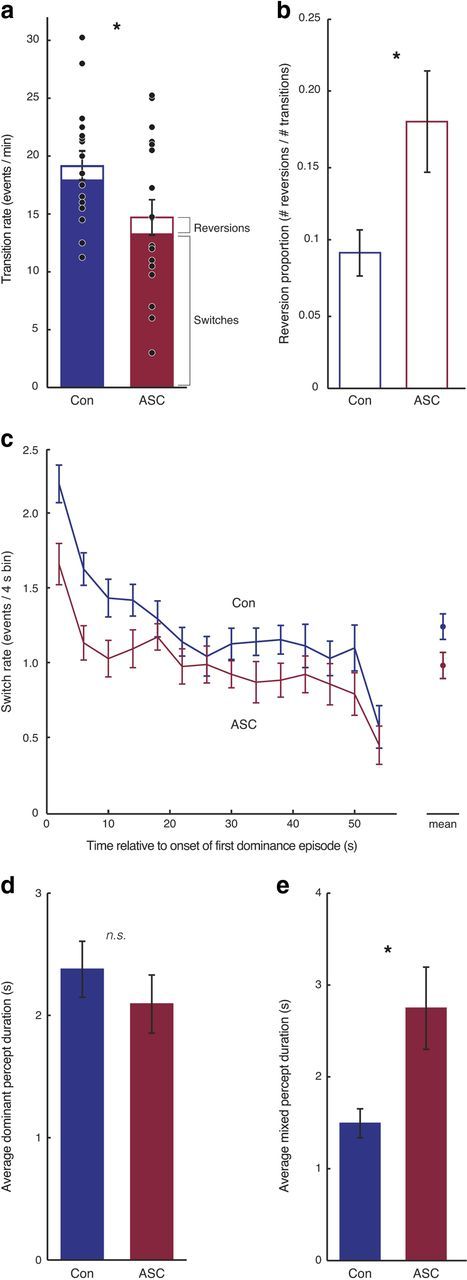
Slower rate of binocular rivalry alternations in autism. a, Individuals with ASCs demonstrated fewer perceptual transitions between the inputs to their left and right eyes, compared with control subjects. The mean number of these transitions that were perceptual switches or reversions is marked for each group. b, The proportion of transitions that were perceptual reversions (calculated as the number of reversions/number of transitions) was greater in the ASC group. c, In both groups, the frequency of perceptual switches declined throughout the run. Across the duration of the run, individuals with ASCs experienced fewer perceptual switches than control subjects (mean plotted on right). d, The duration of dominance episodes was comparable between the two groups. e, However, individuals with ASCs exhibited longer mixed percepts than control subjects. In all plots, error bars represent 1 SEM. *p < 0.05, difference between the two groups.
In the “gradual-onset” experiment, participants viewed gradual, linear transitions between stimuli (see Fig. 5a). The onset of each of the 15 Gaussians was randomly determined during the first 20% of the transition, after which the SD of each Gaussian filter linearly ramped from zero to a third of the image size. This allowed us to determine each participant's response criteria: the extent of blending that led to either a mixed or a dominant percept decision. In this experiment, mixed-image presentation durations were fixed at the mean duration of a mixed percept in the ASC group for two runs (“autism-matched playback”) or the mean duration of a mixed percept in the control group for two runs (“control-matched playback”). Single-image presentation durations were drawn from the duration distributions of dominant percepts observed in the main experiment.
Figure 5.

Gradual-onset rivalry playback experiment. a, To test whether individuals with and without ASCs have an implicitly different criterion for reporting changes in gradually evolving stimuli, we designed a control experiment in which participants viewed a sequence of playback rivalry alternations with computer-generated gradual transitions between dominant stimuli based on the reported rivalry from either the ASCs or control reports (see Materials and Methods). b, c, Response latencies to report the onset of the mixed-image stimulus from the onset of the transition (solid bars) and the latency to report the onset of the single-image stimulus (open bars) during the sequences created from the ASC (b) or control (c) rivalry reports. Although individuals with ASCs demonstrated atypical dynamics during actual binocular rivalry, the results of our gradual-onset control experiment show that they have equivalent criteria for reporting the onset of single-image or mixed-image stimuli. This suggests that individuals with and without ASCs use similar response criteria to determine the percentage through an evolving perceptual transition at which the stimulus is best described as being a single-image or mixed-image stimulus. In sum, more conservative response criteria are unlikely to underlie the atypical dynamics of binocular rivalry individuals with ASCs demonstrated in our main experiment. In all plots, error bars represent 1 SEM.
Results
Fewer perceptual transitions in ASCs
Participants with ASCs reported significantly fewer perceptual transitions than control subjects (Fig. 2a), reporting a change in percept an average of 14.7 times per minute, compared with 19.2 times in control subjects (t = 2.30, p < 0.028). Importantly, there was no response bias toward any particular eye (left/right), key (left/right), or percept (red/green): measures of the proportion of report (frequency of event/all events), broken down by each of these factors, revealed no significant differences in either group (all p > 0.48). These findings indicate that the rate at which competing percepts alternate in awareness is slower in individuals with ASCs.
To characterize the dynamics of binocular rivalry in ASCs in more detail, we decomposed each participant's sequence of transitions into two classes: switches and reversions.
Fewer switches in ASC
Switches were denoted as transitions in which the participant reported one percept (e.g., red image) and subsequently reported the alternate percept (e.g., green image), whether directly or by way of the mixed perceptual state (Fig. 1b). We found significantly fewer switches in participants with ASC (12.6 per minute) compared with control subjects (17.4 per minute; t = 2.51, p < 0.017; Fig. 2a).
To investigate the temporal profile of this effect, for each participant we aligned the sequence of switches in a run with the time at which the first switch occurred, and divided this sequence into 4 s bins for each run, excluding the last bin to account for individual variation in the timing of the final switch. While individuals with ASCs evidenced fewer switches throughout the run, the rate of switches decreased equivalently in both ASC and control individuals throughout the run (Fig. 2c). Repeated-measures ANOVA, with time as a within-subjects factor and diagnosis as a between-subjects factor, revealed the main effects of both time (F(12,420) = 20.44, p < 0.001) and diagnosis (F(1,35) = 5.02, p < 0.031), but no interaction between them (F(12,420) = 1.45, p < 0.140). This result indicates a slower rate of binocular rivalry alternations in ASC than control subjects throughout a run, with the overall rate declining comparably in both groups.
More reversions in ASC
The other class of transitions, reversions, occurred when the participant reported one dominant percept (e.g., red image), and then entered the mixed perceptual state before reverting back to the same dominant percept (red image; Fig. 1b). The number of reversions was comparable between the ASC and control groups (control group: 1.7; ASC group: 2.1; t = 0.89, p < 0.379). However, given the reduced number of transitions in ASCs, the proportion of transitions that resulted in reversions rather than switches was significantly higher in the ASC group (17.9%) than in the control group (9.1%; t = 2.38, p < 0.023; Fig. 2b). Thus, after leaving a dominant percept, participants with ASCs were almost twice as likely to “revert” back to this percept than control individuals. This result suggests that not only do individuals with ASCs switch perceptual states less frequently, but also each dominant percept is more perseverant.
Longer mixed percepts, but not dominance durations in ASCs
The reduced rate of perceptual switches in ASCs could correspond to longer durations of dominant percepts, mixed percepts, or both. We therefore investigated whether the average amount of time spent reporting a particular percept (red, green, or mixed) differed between the two groups. Control and ASC participants reported approximately equivalently long dominant percepts (Fig. 2d; ASC: 2.1 s, Con: 2.4 s; t = 0.88, p < 0.383). However, ASC participants reported mixed percepts for nearly twice as long on average (2.8 s) as control subjects (1.4 s; t = 2.80, p < 0.008; Fig. 2e). Further, the duration of mixed percepts was strongly negatively correlated with the frequency of perceptual switches across participants (Spearman's ρ(37) = −0.75, p < 0.001), suggesting that the amount of time spent in the mixed perceptual state is related to the speed of perceptual transitions. Longer durations of mixed percepts are unlikely to reflect response conservativeness on the part of participants with ASCs (participants being more hesitant to report dominant percepts), as a reduced duration of dominant percepts was not observed.
Comparable distributions of dominance durations between groups
The distribution of the durations of perceptual episodes around the mean duration is thought to reflect the stochasticity of the neural competition underlying rivalry: some computational models of rivalry propose that switching primarily influenced by neural noise would produce a large variance in dominance durations, while switching primarily influenced by the regular adaptation of neuronal dynamics would produce a narrow distribution (Kang and Blake, 2010). To index the relative contributions of these two factors, Shpiro et al. (2009) proposed the coefficient of variation (CV; SD of dominance durations/mean dominance duration), which approaches 1 if switching is highly stochastic (Shpiro et al., 2009). We computed the CV for each participant and run. No difference between the two groups was observed (ASC group: 0.57 ± 0.13; control group: 0.55 ± 0.09; p < 0.5). To further investigate the distribution of dominance durations, we fit each individual's dominance durations on each run to a gamma distribution. We observed no differences in the shape or scale parameters of these distributions (ASC group: 3.39 (k), 0.68 (θ); control group: 3.19 (k), 0.78 (θ); p > 0.50). These two analyses indicate that dominant percept durations are comparably distributed between the two groups, as is the relative contribution of noise to rivalry dynamics.
Switch-rate and mixed-percept duration correlate with autistic symptomatology
Finally, we investigated how our findings of a reduced switch rate, a higher proportion of reversions, and longer durations of mixed percepts in ASCs relate to higher-order autistic symptomatology. No correlations were found with a self-report measure of autistic traits (the AQ) in either group. However, the rate of switches was highly correlated with clinical measures of autistic symptomatology, as measured by the ADOS (Spearman's ρ(19) = −0.52, p < 0.023; Fig. 3a). Additionally, the proportion of reversions was correlated with autistic symptoms (Spearman's ρ(19) = 0.56, p < 0.013; Fig. 3b). Finally, and as expected from their strong inverse correlation with the rate of switching, longer mixed perceptual episodes strongly predicted higher autistic symptomatology (Spearman's ρ(19) = 0.59, p < 0.007; Fig. 3c). All three of these measures correlated with each other (all ρ < −0.524; all p < 0.001), suggesting that a common mechanism may underlie these three atypicalities in rivalry dynamics in ASCs. Semipartial correlations controlling for IQ did not qualitatively alter these findings (all p < 0.05). These results suggest that these relatively low-level perceptual markers of ASCs are associated with symptomatology defined at much more complex levels of behavior.
Figure 3.

The rate of rivalry predicts the severity of autistic symptoms (individuals with more autistic symptoms, as measured by the ADOS). a–c, ADOS, a clinical measure of symptomatology, demonstrated a lower frequency of perceptual switches (a), a higher proportion of reversions (b), and longer durations of mixed percepts (c).
Typical response latencies and response criteria in ASCs
The results of our control experiments demonstrate that the atypical dynamics of binocular rivalry evidenced in ASCs cannot be attributed to group differences in response latencies or response criteria. Individuals with ASCs reported simulated rivalry alternations with comparable response latencies as control subjects, whether stimulus onset was abrupt or gradual.
In our main experiment, individuals with ASCs demonstrated the following: (1) slower rivalry alternations; (2) higher proportion of perceptual reversions than control subjects; and (3) longer mixed percepts. In the subset of participants (N = 21, 10 ASCs) who also participated in the control experiments, these findings are qualitatively unchanged (longer mixed-percept durations in ASCs: p < 0.05). However, during both control experiments, when there were physical changes in the stimuli, identical analyses revealed that individuals with and without ASCs demonstrated comparable response frequency dynamics in all three of these domains: (1) individuals with ASCs reported a similar proportion of perceptual switches as control subjects (both control experiments, p > 0.98); and there was no difference in (2) the proportion of reported reversions (both conditions, p > 0.68) or (3) the duration of transitions (both control experiments, p > 0.47). These results indicate that the findings of our main experiment are best attributed to group differences in binocular rivalry dynamics, rather than nonperceptual differences in the two populations.
Importantly, individuals with ASCs not only demonstrated response frequency dynamics comparable to those of control subjects during our simulated rivalry experiments, but similar response latencies as well. During the sudden-onset experiment, participants with and without ASCs exhibited comparable response latencies to the sudden onset of single-image (p > 0.47) and mixed-image stimuli (p > 0.11) in both ASC-matched and control-matched playback types (Fig. 4b,c). This result suggests that group differences in response latencies cannot account for the slower rate of perceptual transitions observed in our main experiment. Nevertheless, a weak tendency toward slower overall response times was observed in the ASC group. To investigate this further, we conducted a 2 × 2 ANOVA, with playback type (autism matched or control matched) and image type (single image or mixed image) as within-subject factors and diagnosis as a between-subject factor, but the main effect of diagnosis did not reach significance (F(1,19) = 2.245, p < 0.151), and there were no interactions involving diagnosis (all p > 0.164). Importantly, though, even if this trend were significant, it would be unable to explain the longer mixed precept durations reported in our main experiment since the tendency was the same for both dominant and mixed-stimulus onsets: overall slower response times in ASCs would result in a shift in the report of both the onset and offset of the mixed precepts, but equivalent mixed-percept durations. In sum, group differences in motor response are unlikely to underlie our finding of atypical dynamics of binocular rivalry in ASCs.
During the gradual-onset experiment, participants with and without ASCs again exhibited detection comparable to that of latencies to the onset of smoothly evolving single-image (p > 0.65) and mixed-image stimuli (p > 0.11) in both ASC-matched and control-matched playback types (Fig. 5b,c). This result indicates that individuals with and without ASCs require a comparable amount of perceptual evidence to report a single or mixed image. Therefore, group differences in response criteria are unlikely to explain the slower rate of perceptual transitions observed in our main experiment.
Finally, neither the mean response latencies nor decision criteria correlated with any of the three findings in our main experiment (all p > 0.05), indicating that individual variations in motor response latencies or perceptual decision criteria regarding stimulus transitions are not strong contributors to the dynamics of perceptual competition under conditions of binocular rivalry. In sum, our experiments indicate that individuals with ASCs demonstrate atypical dynamics of binocular rivalry, despite evidencing response latencies and response criteria similar to those of control subjects.
Discussion
We have demonstrated that individuals with ASCs exhibit atypical dynamics of binocular rivalry, but typical response latencies and response criteria to report rivalry playback conditions. Individuals with ASCs evidence fewer perceptual transitions than control subjects. When transitions do occur, the interposing mixed percepts endure for longer and disproportionately resolve into the previous percept. Finally, each of these findings—the frequency of perceptual switches, the duration of mixed percepts, and the proportion of reversions—strongly predict the severity of high-level autistic symptomatology, suggesting that a common neural perturbation may underlie both perceptual and high-level autistic symptoms.
Although social processing deficits have traditionally defined ASCs, atypical perception has been noted since the earliest observations of the condition (Kanner, 1943) and was recently included as a diagnostic criterion of the condition in the DSM-V. The severity of symptomatology across these seemingly disparate levels shows strong covariance, both across the general population (Robertson and Simmons, 2013) and within autistic populations (Atkinson, 2009; Robertson et al., 2012), leading to the notion that a common alteration in neural circuitry may affect both social and perceptual processing in ASCs.
The pattern of findings within the literature on visual processing in ASCs supports such a hypothesis. Myriad studies have reported a lack of difference between ASC and control subjects on measures of basic visual processing, such as contrast sensitivity, visual acuity, and flicker detection (Bertone et al., 2005; Koh et al., 2010; Tavassoli et al., 2011), making it difficult to attribute autistic clinical symptomatology to any singular difference in visual sensitivity. However, an increasing number of studies has reported deficits in domains of visual processing that require integration across neural populations, such as motion perception (Kaiser and Shiffrar, 2009; Robertson et al., 2012), lateral interaction processes (Kéïta et al., 2011), and spatial attention (Robertson et al., 2013). This pattern of findings suggests that differences in autistic perception may arise from alterations in connectivity between neural populations, which could potentially affect various cortical areas, and processes as disparate as perception and social cognition.
The atypical dynamics of binocular rivalry we observed in ASC patients may offer insight into the nature of such a perturbation in cortical circuitry. Binocular rivalry alternations are often hypothesized to be governed by excitatory–inhibitory interactions between pools of neurons that code for the two monocularly presented images at various levels of visual processing (Laing and Chow, 2002; Wilson, 2003; van Loon et al., 2013). Thus, our finding of slower binocular rivalry alternations in ASCs is consistent with the hypothesis that autism may be typified by an imbalance in excitatory–inhibitory interactions, providing further evidence for the importance of this balance in both rivalry and autism. However, due to the reciprocal nature of these excitatory–inhibitory interactions, the direction of such an imbalance in autism is unclear from our data alone.
Computational models of binocular rivalry predict that an imbalance in either direction—driven by either reduced excitation or inhibition—would particularly lengthen the duration of mixed percepts, causing eye-specific inputs to remain partially excited for longer periods of time (Klink et al., 2010; Said et al., 2013). Our results are consistent with this prediction, as longer mixed percepts appear to drive the slower rate of rivalry found in our ASC group. Although a previous exploration of binocular rivalry dynamics in ASC subjects found no difference between ASC and control participants (Said et al., 2013), it is worth noting that the same trend toward longer mixed-percept durations was reported. The difference between our findings and those of Said et al. (2013) may arise from their use of less complex stimuli (gratings rather than objects), which are known to elicit weaker suppression and less coherent rivalry (Nguyen et al., 2001; Alais and Melcher, 2007).
One finding in the computational literature may hint at the direction of the potential imbalance in ASCs. Simulations with two prominent models (Wilson et al., 2001; Noest et al., 2007) predict that the mixed percepts during binocular rivalry with complex stimuli, as opposed to gratings, are particularly lengthened by reducing neural inhibition (Klink et al., 2010). Interestingly, three lines of evidence within the autism literature also largely converge toward the hypothesis that an excitation-dominant synaptic imbalance may characterize the autistic cortex. First, postmortem neuroanatomical analyses of the brains of individuals with ASCs have revealed a narrower columnar architecture in the autistic cortex (Casanova et al., 2006). The balance of excitatory–inhibitory lateral interactions is thought to sculpt columnar architecture during development, where reduced GABA-mediated inhibitory interactions produce narrower columns (Hensch and Stryker, 2004). Second, a reduction in GABA receptors has been observed in the autistic brain (Blatt et al., 2001; Fatemi et al., 2009). Finally, an excitation-dominant synaptic imbalance has computationally reproduced features of autistic eye movements (Vattikuti and Chow, 2010).
Two further markers of autistic cortical dynamics are also potentially manifested in our findings. First, both ASC and control participants evidenced a comparable decrease in the rate of rivalry alternations throughout a run. This decrease has been observed in previous studies and has been proposed to reflect a reduction in the strength of inhibition between neural populations coding for the two competing percepts (Klink et al., 2010). This finding therefore suggests that such long-term adaptation may not differ in individuals with ASCs. Second, individuals with ASCs reported a higher proportion of perceptual reversions than control subjects. A less explored characteristic of binocular rivalry, perceptual reversions may occur when the neural populations coding for each percept are either equally adapted at the point of transition (Pastukhov, 2011) or when neural noise disrupts the otherwise deterministic cycle of perceptual switches (Brascamp et al., 2006). The former interpretation couples well with our finding of longer mixed percepts in individuals with ASCs: if the two neural populations are equally adapted, transitions between the two states will be longer and less deterministic (Pastukhov, 2011). An increased level of neural noise in the autistic cortex is less likely to reproduce our results, as the spread in the distributions of dominance durations, which is thought to reflect the stochasticity of neural competition, is comparable between our ASC and control groups.
In sum, our findings of a reduced rate of binocular rivalry in ASCs are potentially indicative of an imbalance between excitatory and inhibitory cortical interactions in the autistic cortex. Although the direction of this imbalance cannot be inferred from our data alone, other nascent lines of evidence from the autism and computational literatures suggest that an excitation-dominant synaptic imbalance may characterize the autistic cortex. These results at such a fundamental level of visual processing may help to constrain future models of autistic neural circuitry and hold promise for improving our understanding of the fundamental properties of the autistic brain.
Footnotes
This work was supported in part by the Intramural Research Program of the National Institute of Mental Health, and was conducted in association with the National Institute for Health Research Collaboration for Leadership in Applied Health Research and Care for Cambridgeshire and Peterborough NHS Foundation Trust. This work was also supported by the Gates-Cambridge Trust and the National Institutes of Health-Cambridge Fellowship (C.E.R.). S.B.-C. was supported by the Medical Research Council and the Wellcome Trust during the period of this work. We thank John Mollon for the use of his mirror stereoscope; David Leopold, Carson Chow, Shashaank Vattikuti, Alex Martin, and Kate Plaisted-Grant for comments; and Carrie Allison for help with recruitment.
The authors declare no competing financial interests.
References
- Alais D, Melcher D. Strength and coherence of binocular rivalry depends on shared stimulus complexity. Vision Res. 2007;47:269–279. doi: 10.1016/j.visres.2006.09.003. [DOI] [PubMed] [Google Scholar]
- Atkinson AP. Impaired recognition of emotions from body movements is associated with elevated motion coherence thresholds in autism spectrum disorders. Neuropsychologia. 2009;47:3023–3029. doi: 10.1016/j.neuropsychologia.2009.05.019. [DOI] [PubMed] [Google Scholar]
- Baker DH, Graf EW. Natural images dominate in binocular rivalry. Proc Natl Acad Sci U S A. 2009;106:5436–5441. doi: 10.1073/pnas.0812860106. [DOI] [PMC free article] [PubMed] [Google Scholar]
- Baron-Cohen S, Wheelwright S, Skinner R, Martin J, Clubley E. The autism-spectrum quotient (AQ): evidence from Asperger syndrome/high-functioning autism, males and females, scientists and mathematicians. J Autism Dev Disord. 2001;31:5–17. doi: 10.1023/A:1005653411471. [DOI] [PubMed] [Google Scholar]
- Bertone A, Mottron L, Jelenic P, Faubert J. Enhanced and diminished visuo-spatial information processing in autism depends on stimulus complexity. Brain. 2005;128:2430–2441. doi: 10.1093/brain/awh561. [DOI] [PubMed] [Google Scholar]
- Blatt GJ, Fitzgerald CM, Guptill JT, Booker AB, Kemper TL, Bauman ML. Density and distribution of hippocampal neurotransmitter receptors in autism: an autoradiographic study. J Autism Dev Disord. 2001;31:537–543. doi: 10.1023/A:1013238809666. [DOI] [PubMed] [Google Scholar]
- Brascamp JW, Van Ee R, Noest AJ, Jacobs RHAH, van den Berg AV. The time course of binocular rivalry reveals a fundamental role of noise. J Vis. 2006;6(11):8, 1244–1256. doi: 10.1167/6.11.8. [DOI] [PubMed] [Google Scholar]
- Casanova MF, van Kooten IAJ, Switala AE, van Engeland H, Heinsen H, Steinbusch HW, Hof PR, Trippe J, Stone J, Schmitz C. Minicolumnar abnormalities in autism. Acta Neuropathol. 2006;112:287–303. doi: 10.1007/s00401-006-0085-5. [DOI] [PubMed] [Google Scholar]
- Dayan P. A hierarchical model of binocular rivalry. Neural Comput. 1998;10:1119–1135. doi: 10.1162/089976698300017377. [DOI] [PubMed] [Google Scholar]
- Fatemi SH, Reutiman TJ, Folsom TD, Thuras PD. GABAa receptor downregulation in brains of subjects with autism. J Autism Dev Disord. 2009;39:223–230. doi: 10.1007/s10803-008-0646-7. [DOI] [PMC free article] [PubMed] [Google Scholar]
- Foss-Feig JH, Tadin D, Schauder KB, Cascio CJ. A substantial and unexpected enhancement of motion perception in autism. J Neurosci. 2013;33:8243–8249. doi: 10.1523/JNEUROSCI.1608-12.2013. [DOI] [PMC free article] [PubMed] [Google Scholar]
- Hensch TK, Stryker MP. Columnar architecture sculpted by GABA circuits in developing cat visual cortex. Science. 2004;303:1678–1681. doi: 10.1126/science.1091031. [DOI] [PMC free article] [PubMed] [Google Scholar]
- Kaiser MD, Shiffrar M. The visual perception of motion by observers with autism spectrum disorders: a review and synthesis. Psychon Bull Rev. 2009;16:761–777. doi: 10.3758/PBR.16.5.761. [DOI] [PubMed] [Google Scholar]
- Kang MS, Blake R. What causes alternations in dominance during binocular rivalry? Atten Percept Psychophys. 2010;72:179–186. doi: 10.3758/APP.72.1.179. [DOI] [PMC free article] [PubMed] [Google Scholar]
- Kanner L. Autistic disturbances of affective contact. Nerv Child. 1943;2:217–250. [PubMed] [Google Scholar]
- Kéïta L, Mottron L, Dawson M, Bertone A. Atypical lateral connectivity: a neural basis for altered visuospatial processing in autism. Biol Psychiatry. 2011;70:806–811. doi: 10.1016/j.biopsych.2011.07.031. [DOI] [PubMed] [Google Scholar]
- Klink PC, Brascamp JW, Blake R, van Wezel RJ. Experience-driven plasticity in binocular vision. Curr Biol. 2010;20:1464–1469. doi: 10.1016/j.cub.2010.06.057. [DOI] [PMC free article] [PubMed] [Google Scholar]
- Koh HC, Milne E, Dobkins K. Spatial contrast sensitivity in adolescents with autism spectrum disorders. J Autism Dev Disord. 2010;40:978–987. doi: 10.1007/s10803-010-0953-7. [DOI] [PubMed] [Google Scholar]
- Laing CR, Chow CC. A spiking neuron model for binocular rivalry. J Comput Neurosci. 2002;12:39–53. doi: 10.1023/A:1014942129705. [DOI] [PubMed] [Google Scholar]
- Lee SH, Blake R. A fresh look at interocular grouping during binocular rivalry. Vision Res. 2004;44:983–991. doi: 10.1016/j.visres.2003.12.007. [DOI] [PubMed] [Google Scholar]
- Leopold DA, Logothetis NK. Activity changes in early visual cortex reflect monkeys' percepts during binocular rivalry. Nature. 1996;379:549–553. doi: 10.1038/379549a0. [DOI] [PubMed] [Google Scholar]
- Lord C, Risi S, Lambrecht L, Cook EH, Jr, Leventhal BL, DiLavore PC, Pickles A, Rutter M. The autism diagnostic observation schedule-generic: a standard measure of social and communication deficits associated with the spectrum of autism. J Autism Dev Disord. 2000;30:205–223. doi: 10.1023/A:1005592401947. [DOI] [PubMed] [Google Scholar]
- Marín O. Interneuron dysfunction in psychiatric disorders. Nat Rev Neurosci. 2012;13:107–120. doi: 10.1038/nrn3155. [DOI] [PubMed] [Google Scholar]
- Meng M, Tong F. Can attention selectively bias bistable perception? Differences between binocular rivalry and ambiguous figures. J Vis. 2004;4(7):2, 539–551. doi: 10.1167/4.7.2. [DOI] [PMC free article] [PubMed] [Google Scholar]
- Nguyen VA, Freeman AW, Wenderoth P. The depth and selectivity of suppression in binocular rivalry. Percept Psychophys. 2001;63:348–360. doi: 10.3758/BF03194475. [DOI] [PubMed] [Google Scholar]
- Noest AJ, Van Ee R, Nijs MM, Van Wezel RJA. Percept-choice sequences driven by interrupted ambiguous stimuli: a low-level neural model. J Vis. 2007;7(8):10. doi: 10.1167/7.8.10. 10. [DOI] [PubMed] [Google Scholar]
- Pastukhov A. Cumulative history quantifies the role of neural adaptation in multistable perception. J Vis. 2011;11(10):12. doi: 10.1167/11.10.12. 12. [DOI] [PubMed] [Google Scholar]
- Robertson AE, Simmons DR. The relationship between sensory sensitivity and autistic traits in the general population. J Autism Dev Disord. 2013;43:775–784. doi: 10.1007/s10803-012-1608-7. [DOI] [PubMed] [Google Scholar]
- Robertson CE, Martin A, Baker CI, Baron-Cohen S. Atypical integration of motion signals in autism spectrum conditions. PLoS One. 2012;7:e48173. doi: 10.1371/journal.pone.0048173. [DOI] [PMC free article] [PubMed] [Google Scholar]
- Robertson CE, Kravitz DJ, Freyberg J, Baron-Cohen S, Baker CI. Tunnel vision: sharper gradient of spatial attention in autism. J Neurosci. 2013;33:6776–6781. doi: 10.1523/JNEUROSCI.5120-12.2013. [DOI] [PMC free article] [PubMed] [Google Scholar]
- Rubenstein JLR, Merzenich MM. Model of autism: increased ratio of excitation/inhibition in key neural systems. Brain. 2003;2:255–267. doi: 10.1034/j.1601-183x.2003.00037.x. [DOI] [PMC free article] [PubMed] [Google Scholar]
- Said CP, Egan RD, Minshew NJ, Behrmann M, Heeger DJ. Normal binocular rivalry in autism: implications for the excitation/inhibition imbalance hypothesis. Vision Res. 2013;77:59–66. doi: 10.1016/j.visres.2012.11.002. [DOI] [PMC free article] [PubMed] [Google Scholar]
- Sheinberg DL, Logothetis NK. The role of temporal cortical areas in perceptual organization. Proc Natl Acad Sci U S A. 1997;94:3408–3413. doi: 10.1073/pnas.94.7.3408. [DOI] [PMC free article] [PubMed] [Google Scholar]
- Shpiro A, Moreno-Bote R, Rubin N, Rinzel J. Balance between noise and adaptation in competition models of perceptual bistability. J Comput Neurosci. 2009;27:37–54. doi: 10.1007/s10827-008-0125-3. [DOI] [PMC free article] [PubMed] [Google Scholar]
- Tavassoli T, Latham K, Bach M, Dakin SC, Baron-Cohen S. Psychophysical measures of visual acuity in autism spectrum conditions. Vision Res. 2011;51:1778–1780. doi: 10.1016/j.visres.2011.06.004. [DOI] [PMC free article] [PubMed] [Google Scholar]
- Tong F, Engel SA. Interocular rivalry revealed in the human cortical blind-spot representation. Nature. 2001;411:195–199. doi: 10.1038/35075583. [DOI] [PubMed] [Google Scholar]
- van Loon AM, Knapen T, Scholte HS, St John-Saaltink E, Donner TH, Lamme VA. GABA shapes the dynamics of bistable perception. Curr Biol. 2013;23:823–827. doi: 10.1016/j.cub.2013.03.067. [DOI] [PubMed] [Google Scholar]
- Vattikuti S, Chow CC. A computational model for cerebral cortical dysfunction in autism spectrum disorders. Biol Psychiatry. 2010;67:672–678. doi: 10.1016/j.biopsych.2009.09.008. [DOI] [PMC free article] [PubMed] [Google Scholar]
- Wheatstone C. Contributions to the physiology of vision. Part the first. On some remarkable, and hitherto unobserved, phenomena of binocular vision. Philos Trans R Soc London. 1838;128:371–394. [Google Scholar]
- Wilson HR. Computational evidence for a rivalry hierarchy in vision. Proc Natl Acad Sci U S A. 2003;100:14499–14503. doi: 10.1073/pnas.2333622100. [DOI] [PMC free article] [PubMed] [Google Scholar]
- Wilson HR, Blake R, Lee SH. Dynamics of travelling waves in visual perception. Nature. 2001;412:907–910. doi: 10.1038/35091066. [DOI] [PubMed] [Google Scholar]