

Abstract
While accumulation of amyloid-β (Aβ) deposited as senile plaques is a hallmark feature of Alzheimer's disease (AD), the neurotoxicity of these deposits remains controversial. Recent in vitro studies suggested a link between elevated Aβ and mitochondrial dysfunction that might contribute to the pathogenesis of AD. However, the in vivo evidence for mitochondria dysfunction caused by Aβ is still missing. Using intravital multiphoton imaging with a range of fluorescent markers, we systematically surveyed mitochondrial structural and functional changes in AD mouse models. We observed severe impairments to be limited to the vicinity of Aβ plaques, which included reduction of both numbers and membrane potential of mitochondria and the emergence of dystrophic and fragmented mitochondria. Both neuronal soma and neurites with oxidative stress show severe alterations in mitochondrial membrane potential in amyloid precursor protein mice. These results provide in vivo evidence revealing Aβ plaques as focal sources of toxicity that lead to severe structural and functional abnormalities in mitochondria. These alterations may contribute to neuronal network dysfunction and warrant further investigation as possible targets for therapeutic intervention in AD.
Introduction
Mitochondrial dysfunction is an attractive hypothesis for the pathogenesis of Alzheimer's disease (AD) and aging-related senile dementia (Smith et al., 1996; Fukui and Moraes, 2008; Mattson et al., 2008). Accumulated evidence has suggested the failure of mitochondria in AD patients. For example, cerebral metabolism is reduced in affected brain regions (Mosconi, 2005; Gauthier et al., 2006) and altered mitochondrial structure has been observed (Hirai et al., 2001; Moreira et al., 2007). Mitochondrial enzymes important for metabolism, including cytochrome c oxidase (COX), α-ketoglutarate dehydrogenase complex, and pyruvate dehydrogenase complex have been shown to be altered (Parker, et al., 1990; Gibson et al., 1998; Maurer et al., 2000). Mitochondria are the major source of intracellular reactive oxygen species (ROS), overproduction of which damages proteins, lipids, and nucleic acids, and are believed to contribute to the pathogenesis of neurodegeneration. While accumulation of amyloid-β (Aβ) deposited as senile plaques is a hallmark feature of AD, growing evidence suggests that elevated Aβ levels contribute to the mitochondrial abnormalities, which might evolve in the pathogenesis in AD. Though the mechanism is not clearly established, it has been reported that both amyloid precursor protein (APP) and Aβ have been found in mitochondrial membranes and interact with mitochondrial proteins, overproduction of which might affect dynamics of mitochondrial fusion/fission (Wang et al., 2008; Calkins et al., 2011; Manczak et al., 2011), impair mitochondrial transport, disrupt the electron transfer chain, increase ROS production (Keller et al., 1997; Abramov et al., 2004; Manczak et al., 2006), and impair mitochondrial function (Mattson et al., 1998; Lustbader et al., 2004; Reddy, 2009). However, the efforts to associate Aβ toxicity with mitochondrial dysfunction are still limited to in vitro studies. To consolidate the evidence for Aβ-induced mitochondrial dysfunction in AD pathogenesis, the alterations in mitochondrial morphology and function in living animals remains to be elucidated. We used multiphoton microscopy in the brains of living mouse models of AD (APPswe:PSEN1dE9) combined with a range of mitochondria-specific labeling methods, and report here, for the first time, a spectrum of mitochondrial abnormalities. In the immediate vicinity of Aβ plaques, we observed mitochondrial loss, structural abnormalities, and functional distress, suggesting that senile plaques are a focal source of toxicity in the living animals. The mitochondrial alterations would be expected to contribute to neural network disruptions and subsequent behavioral deficits observed in these animals, and by extension, to AD patients.
Materials and Methods
Animals and surgery.
All studies were performed with the approval of the Massachusetts General Hospital Animal Care and Use Committee and in compliance with the National Institutes of Health guidelines for the use of experimental animals. Transgenic mice (7 to 10 months old) of either sex expressing mutant human APPswe/human PS1-ΔE9 were used along with age-matched nontransgenic littermate controls (Borchelt et al., 1997). For surgeries, mice of either sex were anesthetized with ketamine (100 mg/kg) and xylazine (10 mg/kg). Intracortical injections and cranial window implantation have been described previously (Kuchibhotla et al., 2008; Xie et al., 2013).
Labeling procedures.
Methoxy-XO4 was injected (4 mg/kg, i.p.) 1 d before the cranial window surgery to label amyloid plaques. For in vivo labeling of mitochondria, both topical application (60 min) and pressure injection through a micropipette were used. MitoTracker Red CMXRos (MTR), MitoTracker Green (MTG), and tetramethylrhodamine ethyl ester (TMRE) (Invitrogen) were prepared as 0.5–1 mm stocks in dimethylsulfoxide (DMSO) and then diluted to 10–40 μm in PBS plus 2% Pluronic F-127 (Invitrogen) before application or injections. 5,5′,6,6′-Tetrachloro-1,1′,3,3′-tetraethylbenzimidazolylcarbocyanine iodide (JC-1; Invitrogen) was applied as 100 μg/ml in 50% PBS/50% DMSO solution plus 2% Pluronic F-127. Hoechst stain (10 μg/ml; Invitrogen) was used to label nuclei. To collapse the mitochondrial membrane potential, carbonyl cyanide 4-[trifluoromethoxy] phenylhydrazone (FCCP, 10 μm; Sigma) was applied to the left hemisphere before MTR and MTG loading. Mitochondrial-targeting GFP (mtGFP) was used to label mitochondria structurally. mtGFP from plasmid pAcGFP1-Mito (Clontech) was inserted into the lentivirus vector CSCGW2 (a gift from Miguel Sena-Esteves; Sena-Esteves et al., 2004) and AAV vector pAAV-CBA–WPRE (Spires et al., 2005). roGFP was introduced into the construct pAAV-CBA-roGFP1-WPRE and the ratio of the emission fluorescence excited at 800 and 900 nm was used as an index of the redox status of roGFP (Xie et al., 2013). For immunostaining of mitochondria, rabbit anti-COX IV (1:1000; Abcam) was incubated with mouse brain sections at 4°C overnight and Alexa Fluor 555 goat anti-rabbit (1:400; Invitrogen) was used as a secondary antibody and incubated with sections at room temperature for 45 min.
Multiphoton imaging.
Images of amyloid pathology, mitochondrial morphology, and membrane potential were obtained using a Bio-Rad 1024ES multiphoton microscope, mounted on an Olympus BX50WI upright microscope. A wax ring was placed on the edges of the coverslip of the cortical window and filled with distilled water to create a well for an Olympus 20× dipping objective (NA 0.95). A mode-locked titanium/sapphire laser (Tsunami; Spectra-Physics) generated two-photon fluorescence with 700–960 nm excitation, and three photomultiplier tubes (Hamamatsu) collected emitted light in the range of 380–480, 500–540, and 560–650 nm. Mitochondria were typically sampled 0–100 μm below the surface of the brain, and cell soma were sampled 100–500 μm below the surface.
Image analysis.
3D image stacks were processed using ImageJ and IDL software (Research Systems). The boundary of dense-core plaques was determined as the position in which the fluorescence intensity was the half-maximum of methoxy-XO4 fluorescence intensity. Data are reported as mean ± SE. Statistical significance was determined by t test. Images presented in the figures are single stacks for dye-stained mitochondria or 2D maximum intensity image projections of the 3D volumes.
Results
To visualize mitochondrial morphology, we transduced fluorescence with virally delivered genetically encoded mitochondrial markers. We used the signal peptide of COX to target GFP (mtGFP) into the matrix of mitochondria (Methods and Materials). Using lentivirus-mediated mtGFP labeling (Fig. 1A), we transduced mitochondrial fluorescence in layer II–V neurons, and observed mitochondria in both apical tufts in layers I/II and neurons in layer II–IV. We also packaged GFP and mtGFP into AAV vectors (AAV8) for neuron-specific labeling in the brain. Both of the viral approaches allowed longitudinal imaging of mitochondria with no overt signs of toxicity. This allowed the investigation of mitochondrial morphology in discrete brain regions in AD mouse models and their control littermates.
Figure 1.
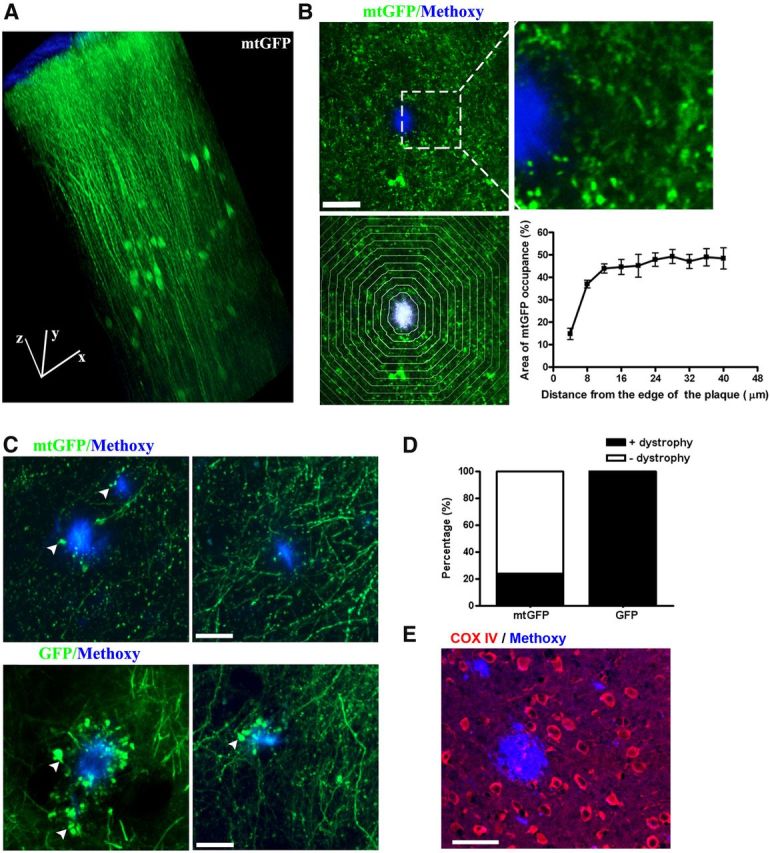
Mitochondrial loss and structural abnormalities in living APP/PS1 transgenic mouse brain. A, B, Representative images of lenti-mtGFP-labeled mitochondria are shown in the living brain. A, 3D reconstruction from an image stack in the somatosensory cortex. Scale bar, 50 μm; block size, 200 × 200 × 500 μm. B, There is a dramatic reduction in mitochondrial signal in the vicinity of dense-core plaques in APP/PS1 transgenic mice. Top, mtGFP (green)-labeled mitochondria and methoxy-XO4-stained plaques (blue) at low and high magnification. Scale bar, 20 μm. Bottom, Demonstrates how quantitative measures were performed. To the left, plaques were outlined and concentric bands at 4 μm intervals were generated. To the right are summary data of the quantitative analysis of mitochondrial density or “burden” in each band (n = 13 plaques from 4 animals). Scale bar, 20 μm. C, Mitochondrial swelling in living APP/PS1 transgenic mouse. Top, Live imaging of AAV-mtGFP (green)-labeled neuronal mitochondria and methoxy-XO4-stained plaques (blue). Arrows show swollen mitochondria. Bottom, Live imaging of AAV-GFP (green)-labeled neurites and methoxy-XO4-stained plaques (blue). Arrows show dystrophic neurites. Scale bar, 20 μm. D, More dystrophic neurites than swollen mitochondria were observed near plaques in Tg mice. E, Immunofluorescence of COX IV (red) showing loss of COX IV surrounding plaques. Scale bar, 40 μm.
In the transgenic (Tg) mice (APPswe:PSEN1dE9), the levels of Aβ increase with age and Aβ plaques are observed at ∼4 months of age, accumulating progressively afterward (Garcia-Alloza et al., 2006). We transduced fluorescence with lentivirus-delivered mtGFP in transgenic mice at an age (7 to 10 months) when numerous Aβ plaques are present. No mtGFP signal was observed in the dense-core of Aβ plaques, consistent with our observations that neurites do not traverse through plaques (Spires et al., 2005). However, a gross reduction of the mtGFP signal was observed around the methoxy-XO4-labeled plaques (Fig. 1B, top), suggesting that dense-core plaques caused a significant loss of mitochondria near the plaque borders. To quantitatively analyze the spatial impact, the percentage of mtGFP signal within areas defined by concentric bands spaced at 4 μm intervals from the border of individual plaques was measured (Fig. 1B, bottom). The mitochondrial “burden” within the range of 16 μm from the boundary of plaques was significantly decreased compared with that in the areas far from the plaques (n = 13 plaques from 4 animals). As lentivirus not only infects neurons but also glial cells, the signal decrease near plaques might reflect the decrease of mitochondria in both neurons and glia.
To investigate mitochondria in neurons specifically, we used AAV-mediated expression of cytosolic GFP and mtGFP. We observed a similar mitochondrial loss near amyloid plaques in Tg mice (data not shown) using this virus. Furthermore, mtGFP expression revealed mitochondrial swelling in neurites (dendrites or axons) that was observed in the immediate vicinity of a fraction of dense-core plaques (Fig. 1C, top). In total, we detected mitochondrial swelling near 26 plaques from six animals, out of a total of 109 plaques that were imaged and analyzed (Fig. 1D). In contrast, cytosolic GFP-labeled neurites showed dramatic swelling/dystrophic morphology near all plaques, which is consistent with previous reports in AD mouse models (Tsai et al., 2004) and AD tissue (Cras et al., 1991; Fig. 1C, bottom, D; 7 animals). These results suggest that few mitochondria are present or, if present, are fragmented in the majority of dystrophic neurites near plaques, and confirm previous ultrastructural determinations in APP/PS1 mice(Kurt et al., 2001; Dikranian et al., 2012). Deficiency of COX has been reported in dystrophic neurites of senile plaques (Pérez-Gracia et al., 2008). We consistently observed a decrease of COX subunit IV staining associated with plaques (Fig. 1E), which suggested the loss of intact mitochondria surrounding plaques. Together, we observed a dramatic decrease in mitochondrial numbers in areas adjacent to Aβ plaques. Remaining mitochondria near plaques were often fragmented and swollen.
In addition to the change in number, mitochondrial morphology was also affected in Tg mouse brain. Mitochondria are dynamic organelles that actively divide, fuse, and form cable-like structures along neuronal projections. Mitochondrial fusion and fission serves as a protective mechanism, disruption of which has been suggested to contribute to neurodegenerative disease (Chan, 2006; Knott et al., 2008; Wang et al., 2009). Similar to the observation in cultured neurons, mtGFP-labeled mitochondria showed cable-like structures in living mouse brain (Fig. 2A, top). In wild-type (Wt) mouse brain, the mitochondrial cable-like structures in neurons were typically 2–30 μm long (Fig. 2B). Surprisingly, in Tg mice, although the morphology of mitochondria in most of the neurons (>97% observed neurons in six Tg mice) appear to be normal, a small number of neurons close to plaques displayed fragmented mitochondria (18 neurons in six Tg mice; Fig. 2A, bottom). The lengths of fragmented mitochondria were distributed from 2 to 4 μm (Fig. 2B). The morphological alterations of mitochondria in those neurons was seldom observed in neurons in age-matched Wt mice 2.1 ± 1.4 neurons per mm3 brain volume, in contrast to 38.4 ± 9.2 neurons per mm3 in Tg mice (Fig. 2C; Wt, n = 6 mice; Tg, n = 6 mice).
Figure 2.

Mitochondrial fragmentation in living APP/PS1 transgenic mouse brain. A, Examples of lenti-mtGFP-labeled mitochondrial structure in neurons in a Wt and APP/PS1transgenic mouse. In the top images, neurons in the brain of a Wt mouse exhibit normal mitochondrial morphology. The bottom images show a neuron near plaques in a Tg mouse brain that shows severe fragmentation of mitochondria as a result of excessive mitochondrial fission. Scale bar, 40 μm. B, Frequency distribution of mitochondrial length from neurons in A. Red, neurons with mitochondrial fragmentation; black, neurons with normal mitochondria. C, Results of counting the number of neurons with mitochondrial fragmentation per volume in Tg versus Wt mice (n = 6 mice per genotype).
Mitochondrial membrane potential (MMP) is the major component of the mitochondrial electrochemical potential gradient, the dissipation of which causes uncoupling of the electron transport chain and phosphorylation for ATP synthesis. Fluorescent probes for monitoring MMP have been frequently used for assessing mitochondrial function (Johnson et al., 1981; Perry et al., 2011; Nicholls, 2012). To further confirm the observation of mitochondrial abnormalities near plaques and, more importantly, examine MMP in Tg mice and their control littermates, we developed functional assays in vivo using a battery of mitochondrial dyes. We screened six dyes by bulk incubation of mouse cortex after removing dura (detailed in Materials and Methods). The dyes included MMP-sensitive dyes: MTR, TMRE, 3,3′-dihexyloxacarbocyanine iodide (DiOC6), and JC-1, as well as MMP-insensitive dyes: MTG and MitoFluo Red 589. When tested in cultured CHO cells, all dyes showed mitochondria-specific staining (data not shown), as previously described (for detailed bibliography see http://www.invitrogen.com/site/us/en/home/References/Molecular-Probes-The-Handbook/Probes-for-Organelles/Probes-for-Mitochondria.html). When applied directly to the neocortex of anesthetized mice, most of the dyes showed mitochondria-like localization (Figs. 3A, MTG, MTR; B, JC-1, Fig. 4B, TMRE). Furthermore, these fluorophores could be detected with multiphoton excitation. Among the six dyes, the MitoFluo Red 589 signal was very weak and photobleached rapidly, and thus was not pursued further. We determined the optimal loading conditions (concentration and time) and two-photon excitation spectra for intravital imaging for the remaining compounds (Table 1). We also examined loading of brain following intravenous injection of the fluorophores via tail vein. None of the tested dyes loaded brain with this approach (data not shown).
Figure 3.

MMP was not altered in areas far from amyloid plaques in the APP/PS1 transgenic mice. A, FCCP reduced the MMP in vivo as indicated with the MTR/MTG signal ratio in Wt mouse cortex. MTR (MMP sensitive), in red; MTG, in green; Hoechst, in blue. FCCP (10 μm) was applied on cortex for 15 min. The inset frames at higher magnification (20 × 20 μm) demonstrate that both MTR and MTG exhibit mitochondrial localization. To the right, the graph shows quantification of the signals in FCCP-treated versus untreated brains (n ≥ 8 imaging sites from 2 animals, p < 0.001). Scale bar, 10 μm. B, FCCP reduced the MMP in vivo as indicated with the JC-1 ratio (red/green) in Wt mouse cortex. FCCP (10 μm) was applied topically to the cortex for 15 min. The ratio of J-aggregate (red) to J-monomer (green) changed in all mitochondria in the affected cortex. Right, The quantification of the JC-1 ratio (n ≥ 11 imaging sites from 2 animals, p < 0.001). Scale bar, 15 μm. C, No differences in the JC-1 ratio were observed in areas distant to Aβ plaques (>50 μm) in Tg mouse, compared with Wt mouse, demonstrating that most mitochondria have a normal resting membrane potential. Left, JC-1 staining in 8- to 10-month-old Wt and Tg mouse. Right, Quantification of JC-1 ratio (n = 12 imaging sites from 3 to 5 animals per genotype). D, No difference in the MTR/MTG ratio confirms the lack of a detectable alteration in MMP in Tg versus Wt brains in areas distant from Aβ plaques (>50 μm; n ≥ 60 imaging sites from 3 to 4 animals per genotype). Scale bar, 15 μm.
Figure 4.

Impairment of MMP near amyloid plaques in living APP/PS1 transgenic mouse. Representative examples of functional alterations in mitochondria near plaques are shown. A, The MMP-sensitive JC-1 ratio was decreased near plaques. Top, J-aggregates (J–a) in red; J-monomers (J-m) in green; methoxy-XO4 in blue. Quantification of JC-1 ratio around the plaques (n = 17 plaques from 5 mice), divided into concentric bands, with 6 μm intervals. Bottom, Magnified JC-1 image and JC-1 ratio map. White line showed the edge of the plaque and white arrowheads showed punctuate mitochondria with low JC-1 ratio. Scale bars: top, 30 μm; bottom, 12 μm. B, A loss in membrane potential is confirmed using the fluorescent dye TMRE that shows a reduced signal near plaques in Tg mice. Top, TMRE, in red; methoxy-XO4 in blue. Top right, quantification of TMRE signals, n = 46 plaques from three mice. Bottom, heatmap of TMRE fluorescence. White line shows the edge of the plaque and white arrowheads show punctuate mitochondria with lower signal. Scale bar, 20 μm. C, Using a third ratiometric approach for monitoring MMP, we demonstrate the loss of MMP using MTR and MTG staining. Left, MTR, in red; MTG, in green; methoxy-XO4, in blue. Right, Quantification of MTR/MTG ratio around the plaques (n = 18 plaques from 4 mice), divided into concentric bands, with 6 μm intervals. Scale bar, 20 μm. D, CAA does not affect mitochondrial function in smooth muscle cells. TMRE (red) and methoxy-XO4 (blue) staining in an 8-month-old APP/PS1 mouse. Vessels are masked with white dash lines. Left, Vessel without CAA; middle, vessel with CAA; right, comparison of TMRE fluorescence in vessels with and without CAA (n ≥ 21 vessels from 5 mice). Scale bar, 30 μm.
Table 1.
Screening of dyes to monitor mitochondria function
| Dye | MMP sensitive | Single-photon Ex (nm) | Em (nm) | Two-Photon Ex (nm) | In vitro staining |
In vivo staining |
|
|---|---|---|---|---|---|---|---|
| Concentration | Depth | ||||||
| TMRE | Yes | 543 (549*) | 574* | 900 | 0.2 μm | 20 μm | 200 μm |
| MTG | No | 488 (490*) | 516* | 900 | 0.4 μm | 40 μm | 100 μm |
| MTR | Yes | 543 (578*) | 599* | 900 | 0.2 μm | 20 μm | 200 μm |
| DiCO6 | Yes | 488 (484*) | 501* | 900 | 40 nm | 20 μm | 200 μm |
| MitoFluo Red 589 | No | 543 (588*) | 622* | None | 0.2 μm | 10 μm | None |
| Aggregate 543 (535*) | 570* | ||||||
| JC-1 | Yes | Monomer 488 (485*) | 505* | 960 | 10 μg/ml | 100 μg/ml | 50 μm |
*Fluorescent excitation and emission maxima (from Molecular Probes/Invitrogen).
Importantly, we characterized the MMP-sensitive dyes for multiphoton imaging in the brain, which allows direct functional analysis of mitochondria in living mice. To verify the sensitivity of the MMP-sensitive dyes, the mitochondrial uncoupler FCCP was used to induce mitochondrial depolarization. After performing a 6 mm diameter craniotomy that spanned the midline of the mouse brain, the dura of the left hemisphere was removed, followed by applying FCCP (10 μm) to the neocortex for 15 min. In the presence of intact dura, topical application of compounds that do not penetrate the blood–brain barrier cannot diffuse into brain, so the right hemisphere was not exposed to FCCP. Following this, the dura of the right hemisphere was removed and the fluorescent dyes were applied to both sides of the brain. By comparing signals from both sides, we were able to assess the MMP sensitivity of the dyes in anesthetized mice.
In the case of MTR (sensitive to MMP), we added MTG, an MMP-insensitive dye, as an internal control. The fluorescence signal of MTR was reduced in the FCCP-treated side compared with the untreated side while the MTG signal was unaffected (Fig. 3A). The ratio of MTR to MTG fluorescence was decreased from 4.05 ± 0.43 to 0.70 ± 0.16 (n ≥ 8 imaging sites from 2 animals, p < 0.001; Fig. 3A). The inset frame in Figure 3A is shown at high magnification, showing the colocalization of MTR and MTG. Thus, consistent with previous reports in cultured cells and isolated mouse lens (Pendergrass et al., 2004), MTR can be used as a functional mitochondrial marker and MTG can be used as a structural mitochondrial marker. Moreover, the ratio of MTR and MTG fluorescence could be used as a ratiometric indicator of mitochondrial function. However, it should be noted that the ratio might also be affected by a differential diffusion/penetration rate of the two dyes in tissues, so caution must be used when imaging deep structures. Using a similar approach, we also verified that both TMRE and DiOC6 exhibited fluorescence changes in response to FCCP treatment (data not shown) in in situ assays.
JC-1 is another vital functional mitochondrial dye used in vitro (Reers et al., 1991; Ankarcrona et al., 1995). This compound undergoes a reversible change in fluorescence emission from green to red as MMP increases. Mitochondria with high MMP promotes the formation of J-aggregates, which fluoresce red; mitochondria with low MMP will contain JC-1 monomers and fluoresce green. Therefore, the red/green ratio of the same dye allows ratiometric determination of mitochondrial function. JC-1 staining in living mouse brain exhibited mitochondrial localization as expected (Fig. 3B). Furthermore, the JC-1 fluorescence ratio (red/green) decreased from 2.48 ± 0.25 in untreated sites to 0.34 ± 0.08 in FCCP-treated sites (n ≥ 11 imaging sites from 2 animals, p < 0.001). Thus, we validated approaches for studying mitochondrial function in vivo via topical application of TMRE, DiOC6, and JC-1, as well as MTR and MTG.
With the fluorescent techniques validated, we examined mitochondrial function in the brains of AD mouse models. First, we compared the brain areas far from Aβ plaques (>50 μm) in 8- to 10-month-old Tg mice to those in age-matched Wt mice (Fig. 3C). The JC-1 red/green ratio was 2.04 ± 0.16 (n = 12 imaging sites from 3 animals) in Wt controls and 2.19 ± 0.15 in Tg mice (n = 12 imaging sites from 3 animals). Thus, no significant difference was observed in mitochondrial function between Wt and Tg mice. Using MTR and MTG costaining, the results were similar. The ratio of MTR/MTG was not changed in Tg mice compared with Wt controls (Fig. 3D; Wt = 4.03 ± 0.16, n = 60 imaging sites from 3 animals; Tg = 4.35 ± 0.19, n = 65 imaging sites from 4 animals). These results are also consistent with the morphological studies with mtGFP virus labeling (Fig. 1) demonstrating that the majority of the mitochondria are not affected in the Tg mice. Together, these results suggest that the soluble aggregates of Aβ in the Tg mice do not lead to appreciable changes in mitochondrial function and morphology in areas far from Aβ plaques.
In close proximity to senile plaques, we observed decreased mitochondrial numbers stained with the functional dyes, consistent with our previous results. We observed a significant reduction of both MTR signal and MTG signal, indicating loss of mitochondria in the immediate vicinity of plaques (Fig. 4C). Furthermore, the ratio of MTR/MTG in remaining mitochondria decreased dramatically near plaques. The MMP decrease extended to ∼20 μm from the border of plaques (Fig. 4C; n = 18 plaques from 4 animals). Similar decreases were observed with TMRE staining, a commonly used dye that results in MMP-sensitive loading of mitochondria (Fig. 4B), confirming a deficit in mitochondria function that is associated with plaques. The range of decreased MMP revealed by TMRE also extended to ∼20 μm from the boundary of plaques (Fig. 4B; n = 46 plaques from 3 animals). These dyes confirmed a reduction in mitochondria number near plaques as well as a functional deficit. We further confirmed these results with the ratiometric mitochondrial probe JC-1. Consistent with the previous data, there was a decrease in ratio that extended to ∼20 μm from the boundary of plaques (Fig. 4A; n = 17 plaques from 5 animals). In this area, the average JC-1 fluorescent ratio (red/green) was significantly decreased to 83% of the value far from plaques (Fig. 4A), indicating a reduction of MMP of individual mitochondria near plaques. Together, these data demonstrate that mitochondrial number was significantly decreased in the areas immediately adjacent to plaques. Moreover, mitochondria within ∼20 μm from plaques exhibited significant reductions in MMP, suggesting that amyloid plaques play a role as a source of toxicity that affects mitochondria function.
Cerebral amyloid angiopathy (CAA) is the accumulation of leptomeningeal and cortical vessel amyloid. In contrast to the toxicity of amyloid deposits in neuronal tissues, we were unable to detect a decrease in mitochondrial function (MMP) in smooth muscle cells of leptomeningeal vessels near amyloid deposits, as indicated by TMRE staining (Fig. 4D). This observation suggests that CAA does not have a direct effect on mitochondrial function in vessels with moderate vascular amyloid deposition.
To further examine mitochondrial function in the neurites surrounding plaques, we combined AAV-mediated GFP labeling of neurites and functional staining of mitochondrial dyes. AAV-mediated GFP expression in cortical neurons did not change the MMP indicated by TMRE staining (0.99 ± 0.02 in GFP-negative neurons, n = 23, vs 0.95 ± 0.02 in GFP-positive neurons, n = 26; 3 animals; values are normalized fluorescent ratios of individual neurites vs average fluorescence intensity within each imaging plane; Fig. 5A). Punctate TMRE staining was present in GFP-labeled dystrophic neurites (Fig. 5B,C) near a subset of plaques, suggesting that there are some functional mitochondria remaining in the dystrophic neurites. Moreover, by quantifying the fluorescence intensity of TMRE we found that the relative signal intensity was much lower in dystrophic neurites than in normal neurites (0.38 ± 0.02 in dystrophic neurites, n = 80, vs 0.97 ± 0.01 in normal neurites, n = 82; 5 animals; values are normalized fluorescent ratios of individual neurites vs average fluorescence intensity within each imaging plane; Fig. 5B). This result demonstrates that the MMP in dystrophic neurites was reduced. More detailed analysis showed that the TMRE intensity in dystrophic neurites was widely distributed, in contrast with those in normal neurites which showed a much tighter distribution. Thus, there is a larger variance in mitochondrial function and numbers in dystrophic neurites near plaques (Fig. 5C). These results demonstrate that mitochondrial function is severely impaired in the dystrophic neurites near amyloid plaques.
Figure 5.

Reduced mitochondrial membrane potential in dystrophic neurites in living APP/PS1 transgenic mouse. Dystrophic neurites show severe alterations in MMP as shown in these representative images. A, A typical image of TMRE staining in AAV-GFP-labeled neurites in a living Tg mouse. Right insert indicates that no significant change of MMP induced by AAV-mediated GFP expression (n = 5 animal, p < 0.001). Scale bar, 13 μm. B,TMRE staining decreased in dystrophic neurites surrounding plaque. The white solid mask indicates dystrophic neurites and white dashed mask indicates normal neurites. Heatmap of TMRE fluorescence with masks, where blues are low MMP and greens to yellow and red are high MMP. C, Summary data that indicate that compared with normal neurites, the TMRE fluorescence in the dystrophic neurites was dramatically decreased and widely distributed (n = 5 animal, p < 0.001). Scale bar, 20 μm.
Redox-sensitive variants of the green fluorescent protein (roGFP) have been developed that allow the monitoring of oxidation/reduction potentials in cells using ratiometric methods (Dooley et al., 2004; Cannon and Remington, 2008). By exploiting this reporter, we have previously determined that oxidative stress was most dramatic in neurites near plaques, propagated to cell bodies, and preceded activation of caspases that led to cell death within 24 h (Xie et al., 2013). Detection of oxidized cell bodies is an extremely rare event. The probe is based on ratiometric imaging of fluorescence excited at 800 nm (oxidized) and 900 nm (reduced) and can be used as an index of the redox status of roGFP. Compared with normal neurons without oxidative stress (Fig. 6A, yellow cells), MMP indicated by TMRE staining was significantly decreased in oxidized neurons (green cell, 0.15 ± 0.03 in oxidized neurons, n = 12, vs 0.97 ± 0.01 in normal neurons, n = 93; 3 animals; values are normalized fluorescent ratios of individual neurites vs average fluorescence intensity within each imaging plane; Fig. 6A,C). Severe alterations in MMP were also observed in oxidized neurites (0.38 ± 0.02 in oxidized neurites, n = 80, vs 0.96 ± 0.01 in normal neurites, n = 82; 3 animals; values are normalized fluorescent ratios of individual neurites vs average fluorescence intensity within each imaging plane; Fig. 6B,C).
Figure 6.

Oxidative stress was accompanied by mitochondrial dysfunction in living APP/PS1 transgenic mouse. Both neuronal soma and neurites with oxidative stress show severe alterations in MMP as shown in these representative images. A, A typical image of TMRE staining in AAV-roGFP-labeled neurons in a living Tg mouse. The emission fluorescence of roGFP excited at 800 (green) and 900 nm (red) was used as an index of redox potential (Xie et al., 2013). The white masks indicates normal neurons without oxidative stress and white mask with * indicates an oxidized neuron. Scale bar, 14 μm. B, A typical image of TMRE staining in AAV-roGFP-labeled neurites in a living Tg mouse. The white dashed mask indicates normal neurites without oxidative stress and white solid masks indicate oxidized neurites. Scale bar, 14 μm. C, MMP significantly decreased in oxidized neurites and neurons (n = 8 oxidized neurites from 3 animals, p < 0.001; n = 12 oxidized cells from 3 animals, p < 0.001).
Discussion
A role for dysfunctional mitochondria in neurodegenerative diseases has long been postulated, in AD in particular. A variety of in vitro investigations have revealed that mitochondria have reduced membrane potential, increased permeability, increased ROS production, altered trafficking, and aberrant fission/fusion regulation when exposed to Aβ (Keller et al., 1997; Mattson et al., 1998; Abramov et al., 2004; Lustbader et al., 2004; Manczak et al., 2006; Wang et al., 2008; Reddy, 2009; Calkins et al., 2011; Manczak et al., 2011). While these results, as well as investigations in postmortem human tissue, have built a strong case for mitochondrial dysfunction in AD, there is limited evidence examining the role of mitochondria in vivo, particularly in the presence of classical AD pathology, e.g., senile plaques. This current work examines, for the first time, the structure and function of mitochondria in the living brain in transgenic animals that develop amyloid deposits. We used multiphoton microscopy for intravital imaging, and evaluated a spectrum of mitochondria-specific labeling techniques compatible with deep tissue imaging and two-photon excitation. We showed that the majority of mitochondria in the brains of mice with amyloid plaques appear structurally and functionally normal. This surprising result is in stark contrast to the numerous reports using in vitro models that demonstrate more global disruption in response to exogenous Aβ. The discrepancy between these studies may be related to the much higher concentrations of synthetic Aβ generally used in in vitro studies, or there exist compensatory mechanisms in the intact brain to accommodate diffuse low level neurotoxic insults.
Severe alterations in mitochondria structure and function were, however, detected, but only in the proximity of dense core plaques. Near plaques, there is a reduced density of mitochondria, abnormal morphology of mitochondria, and a loss of mitochondrial membrane potential in remaining mitochondria. This reduction in MMP is a surrogate to impaired energy production by mitochondria, which would have profound implications for local metabolism and activity. The robust deficits occur within a halo that surrounds individual plaques, resulting in a ∼20 μm radius of toxicity. This halo corresponds well with previous reports demonstrating local alterations in spine density, neuritic curvature, calcium dysregulation, and oxidative stress (Spires et al., 2005; Kuchibhotla et al., 2008; Meyer-Luehmann et al., 2008; Koffie et al., 2009; Xie et al., 2013). Indeed, our previous reports examining calcium dyshomeostasis and the current results that correlate oxidative stress with mitochondrial dysfunction suggest that these pathways may be mechanistically linked. It will be important in future experiments to determine the sequence of events that leads to Aβ-mediated alterations in intracellular calcium levels, oxidative stress, and mitochondrial abnormalities. Our current model suggests that a diffusible toxic molecule, e.g., oligomeric Aβ, may be concentrated locally at dense core plaques, leading to these neurotoxic outcomes (Koffie et al., 2009); however, it is also possible that the outcomes are the result of indirect activity mediated, for example, by activated microglia near plaques. Nonetheless, as the number of senile plaques increases with age, the amount and severity of neuropathological alterations will also increase, leading to progressive neural network dysfunction.
Together, these in vivo observations, for the first time, revealed mitochondrial impairments in AD mouse models. Our results demonstrate a direct connection between mitochondrial dysfunction and amyloid plaques. An effective treatment will likely include a combination of drugs that protect mitochondrial function (Calkins et al., 2012; Eckert et al., 2012; Reddy et al., 2012) and prevent amyloid accumulation. And last, the techniques described here, translating in vitro fluorescence tools for intravital multiphoton imaging, have broad applications to other investigations in normal or diseased brain function.
Footnotes
References
- Abramov AY, Canevari L, Duchen MR. Beta-amyloid peptides induce mitochondrial dysfunction and oxidative stress in astrocytes and death of neurons through activation of NADPH oxidase. J Neurosci. 2004;24:565–575. doi: 10.1523/JNEUROSCI.4042-03.2004. [DOI] [PMC free article] [PubMed] [Google Scholar]
- Ankarcrona M, Dypbukt JM, Bonfoco E, Zhivotovsky B, Orrenius S, Lipton SA, Nicotera P. Glutamate-induced neuronal death: a succession of necrosis or apoptosis depending on mitochondrial function. Neuron. 1995;15:961–973. doi: 10.1016/0896-6273(95)90186-8. [DOI] [PubMed] [Google Scholar]
- Borchelt DR, Ratovitski T, van Lare J, Lee MK, Gonzales V, Jenkins NA, Copeland NG, Price DL, Sisodia SS. Accelerated amyloid deposition in the brains of transgenic mice coexpressing mutant presenilin 1 and amyloid precursor proteins. Neuron. 1997;19:939–945. doi: 10.1016/S0896-6273(00)80974-5. [DOI] [PubMed] [Google Scholar]
- Calkins MJ, Manczak M, Mao P, Shirendeb U, Reddy PH. Impaired mitochondrial biogenesis, defective axonal transport of mitochondria, abnormal mitochondrial dynamics and synaptic degeneration in a mouse model of Alzheimer's disease. Hum Mol Genet. 2011;20:4515–4529. doi: 10.1093/hmg/ddr381. [DOI] [PMC free article] [PubMed] [Google Scholar]
- Calkins MJ, Manczak M, Reddy PH. Mitochondria-targeted antioxidant SS31 prevents amyloid beta-induced mitochondrial abnormalities and synaptic degeneration in Alzheimer's disease. Pharmaceuticals. 2012;5:1103–1119. doi: 10.3390/ph5101103. [DOI] [PMC free article] [PubMed] [Google Scholar]
- Cannon MB, Remington SJ. Redox-sensitive green fluorescent protein: probes for dynamic intracellular redox responses. A review. Methods Mol Biol. 2008;476:51–65. doi: 10.1007/978-1-59745-129-1_4. [DOI] [PubMed] [Google Scholar]
- Chan DC. Mitochondria: dynamic organelles in disease, aging, and development. Cell. 2006;125:1241–1252. doi: 10.1016/j.cell.2006.06.010. [DOI] [PubMed] [Google Scholar]
- Cras P, Kawai M, Lowery D, Gonzalez-DeWhitt P, Greenberg B, Perry G. Senile plaque neurites in Alzheimer disease accumulate amyloid precursor protein. Proc Natl Acad Sci U S A. 1991;88:7552–7556. doi: 10.1073/pnas.88.17.7552. [DOI] [PMC free article] [PubMed] [Google Scholar]
- Dikranian K, Kim J, Stewart FR, Levy MA, Holtzman DM. Ultrastructural studies in APP/PS1 mice expressing human ApoE isoforms: implications for Alzheimer's disease. Int J Clin Exp Pathol. 2012;5:482–495. [PMC free article] [PubMed] [Google Scholar]
- Dooley CT, Dore TM, Hanson GT, Jackson WC, Remington SJ, Tsien RY. Imaging dynamic redox changes in mammalian cells with green fluorescent protein indicators. J Biol Chem. 2004;279:22284–22293. doi: 10.1074/jbc.M312847200. [DOI] [PubMed] [Google Scholar]
- Eckert GP, Renner K, Eckert SH, Eckmann J, Hagl S, Abdel-Kader RM, Kurz C, Leuner K, Muller WE. Mitochondrial dysfunction–a pharmacological target in Alzheimer's disease. Mol Neurobiol. 2012;46:136–150. doi: 10.1007/s12035-012-8271-z. [DOI] [PubMed] [Google Scholar]
- Fukui H, Moraes CT. The mitochondrial impairment, oxidative stress and neurodegeneration connection: reality or just an attractive hypothesis? Trends Neurosci. 2008;31:251–256. doi: 10.1016/j.tins.2008.02.008. [DOI] [PMC free article] [PubMed] [Google Scholar]
- Garcia-Alloza M, Robbins EM, Zhang-Nunes SX, Purcell SM, Betensky RA, Raju S, Prada C, Greenberg SM, Bacskai BJ, Frosch MP. Characterization of amyloid deposition in the APPswe/PS1dE9 mouse model of Alzheimer disease. Neurobiol Dis. 2006;24:516–524. doi: 10.1016/j.nbd.2006.08.017. [DOI] [PubMed] [Google Scholar]
- Gauthier S, Reisberg B, Zaudig M, Petersen RC, Ritchie K, Broich K, Belleville S, Brodaty H, Bennett D, Chertkow H, Cummings JL, de Leon M, Feldman H, Ganguli M, Hampel H, Scheltens P, Tierney MC, Whitehouse P, Winblad B. Mild cognitive impairment. Lancet. 2006;367:1262–1270. doi: 10.1016/S0140-6736(06)68542-5. [DOI] [PubMed] [Google Scholar]
- Gibson GE, Sheu KF, Blass JP. Abnormalities of mitochondrial enzymes in Alzheimer disease. J Neural Transm. 1998;105:855–870. doi: 10.1007/s007020050099. [DOI] [PubMed] [Google Scholar]
- Hirai K, Aliev G, Nunomura A, Fujioka H, Russell RL, Atwood CS, Johnson AB, Kress Y, Vinters HV, Tabaton M, Shimohama S, Cash AD, Siedlak SL, Harris PL, Jones PK, Petersen RB, Perry G, Smith MA. Mitochondrial abnormalities in Alzheimer's disease. J Neurosci. 2001;21:3017–3023. doi: 10.1523/JNEUROSCI.21-09-03017.2001. [DOI] [PMC free article] [PubMed] [Google Scholar]
- Johnson LV, Walsh ML, Bockus BJ, Chen LB. Monitoring of relative mitochondrial membrane potential in living cells by fluorescence microscopy. J Cell Biol. 1981;88:526–535. doi: 10.1083/jcb.88.3.526. [DOI] [PMC free article] [PubMed] [Google Scholar]
- Keller JN, Pang Z, Geddes JW, Begley JG, Germeyer A, Waeg G, Mattson MP. Impairment of glucose and glutamate transport and induction of mitochondrial oxidative stress and dysfunction in synaptosomes by amyloid beta-peptide: role of the lipid peroxidation product 4-hydroxynonenal. J Neurochem. 1997;69:273–284. doi: 10.1046/j.1471-4159.1997.69010273.x. [DOI] [PubMed] [Google Scholar]
- Knott AB, Perkins G, Schwarzenbacher R, Bossy-Wetzel E. Mitochondrial fragmentation in neurodegeneration. Nat Rev Neurosci. 2008;9:505–518. doi: 10.1038/nrn2417. [DOI] [PMC free article] [PubMed] [Google Scholar]
- Koffie RM, Meyer-Luehmann M, Hashimoto T, Adams KW, Mielke ML, Garcia-Alloza M, Micheva KD, Smith SJ, Kim ML, Lee VM, Hyman BT, Spires-Jones TL. Oligomeric amyloid beta associates with postsynaptic densities and correlates with excitatory synapse loss near senile plaques. Proc Natl Acad Sci U S A. 2009;106:4012–4017. doi: 10.1073/pnas.0811698106. [DOI] [PMC free article] [PubMed] [Google Scholar]
- Kuchibhotla KV, Goldman ST, Lattarulo CR, Wu HY, Hyman BT, Bacskai BJ. Abeta plaques lead to aberrant regulation of calcium homeostasis in vivo resulting in structural and functional disruption of neuronal networks. Neuron. 2008;59:214–225. doi: 10.1016/j.neuron.2008.06.008. [DOI] [PMC free article] [PubMed] [Google Scholar]
- Kurt MA, Davies DC, Kidd M, Duff K, Rolph SC, Jennings KH, Howlett DR. Neurodegenerative changes associated with beta-amyloid deposition in the brains of mice carrying mutant amyloid precursor protein and mutant presenilin-1 transgenes. Exp Neurol. 2001;171:59–71. doi: 10.1006/exnr.2001.7717. [DOI] [PubMed] [Google Scholar]
- Lustbader JW, Cirilli M, Lin C, Xu HW, Takuma K, Wang N, Caspersen C, Chen X, Pollak S, Chaney M, Trinchese F, Liu S, Gunn-Moore F, Lue LF, Walker DG, Kuppusamy P, Zewier ZL, Arancio O, Stern D, Yan SS, et al. ABAD directly links Abeta to mitochondrial toxicity in Alzheimer's disease. Science. 2004;304:448–452. doi: 10.1126/science.1091230. [DOI] [PubMed] [Google Scholar]
- Manczak M, Anekonda TS, Henson E, Park BS, Quinn J, Reddy PH. Mitochondria are a direct site of A beta accumulation in Alzheimer's disease neurons: implications for free radical generation and oxidative damage in disease progression. Hum Mol Genet. 2006;15:1437–1449. doi: 10.1093/hmg/ddl066. [DOI] [PubMed] [Google Scholar]
- Manczak M, Calkins MJ, Reddy PH. Impaired mitochondrial dynamics and abnormal interaction of amyloid beta with mitochondrial protein Drp1 in neurons from patients with Alzheimer's disease: implications for neuronal damage. Hum Mol Genet. 2011;20:2495–2509. doi: 10.1093/hmg/ddr139. [DOI] [PMC free article] [PubMed] [Google Scholar]
- Mattson MP, Partin J, Begley JG. Amyloid beta-peptide induces apoptosis-related events in synapses and dendrites. Brain Res. 1998;807:167–176. doi: 10.1016/S0006-8993(98)00763-X. [DOI] [PubMed] [Google Scholar]
- Mattson MP, Gleichmann M, Cheng A. Mitochondria in neuroplasticity and neurological disorders. Neuron. 2008;60:748–766. doi: 10.1016/j.neuron.2008.10.010. [DOI] [PMC free article] [PubMed] [Google Scholar]
- Maurer I, Zierz S, Möller HJ. A selective defect of cytochrome c oxidase is present in brain of Alzheimer disease patients. Neurobiol Aging. 2000;21:455–462. doi: 10.1016/S0197-4580(00)00112-3. [DOI] [PubMed] [Google Scholar]
- Meyer-Luehmann M, Spires-Jones TL, Prada C, Garcia-Alloza M, de Calignon A, Rozkalne A, Koenigsknecht-Talboo J, Holtzman DM, Bacskai BJ, Hyman BT. Rapid appearance and local toxicity of amyloid-beta plaques in a mouse model of Alzheimer's disease. Nature. 2008;451:720–724. doi: 10.1038/nature06616. [DOI] [PMC free article] [PubMed] [Google Scholar]
- Moreira PI, Siedlak SL, Wang X, Santos MS, Oliveira CR, Tabaton M, Nunomura A, Szweda LI, Aliev G, Smith MA, Zhu X, Perry G. Increased autophagic degradation of mitochondria in Alzheimer disease. Autophagy. 2007;3:614–615. doi: 10.4161/auto.4872. [DOI] [PubMed] [Google Scholar]
- Mosconi L. Brain glucose metabolism in the early and specific diagnosis of Alzheimer's disease. FDG-PET studies in MCI and AD. Eur J Nucl Med Mol Imaging. 2005;32:486–510. doi: 10.1007/s00259-005-1762-7. [DOI] [PubMed] [Google Scholar]
- Nicholls DG. Fluorescence measurement of mitochondrial membrane potential changes in cultured cells. Methods Mol Biol. 2012;810:119–133. doi: 10.1007/978-1-61779-382-0_8. [DOI] [PubMed] [Google Scholar]
- Parker WD, Jr, Filley CM, Parks JK. Cytochrome oxidase deficiency in Alzheimer's disease. Neurology. 1990;40:1302–1303. doi: 10.1212/WNL.40.8.1302. [DOI] [PubMed] [Google Scholar]
- Pendergrass W, Wolf N, Poot M. Efficacy of MitoTracker Green and CMXrosamine to measure changes in mitochondrial membrane potentials in living cells and tissues. Cytometry A. 2004;61:162–169. doi: 10.1002/cyto.a.20033. [DOI] [PubMed] [Google Scholar]
- Pérez-Gracia E, Torrejón-Escribano B, Ferrer I. Dystrophic neurites of senile plaques in Alzheimer's disease are deficient in cytochrome c oxidase. Acta Neuropathol. 2008;116:261–268. doi: 10.1007/s00401-008-0370-6. [DOI] [PubMed] [Google Scholar]
- Perry SW, Norman JP, Barbieri J, Brown EB, Gelbard HA. Mitochondrial membrane potential probes and the proton gradient: a practical usage guide. Biotechniques. 2011;50:98–115. doi: 10.2144/000113610. [DOI] [PMC free article] [PubMed] [Google Scholar]
- Reddy PH. Amyloid beta, mitochondrial structural and functional dynamics in Alzheimer's disease. Exp Neurol. 2009;218:286–292. doi: 10.1016/j.expneurol.2009.03.042. [DOI] [PMC free article] [PubMed] [Google Scholar]
- Reddy PH, Tripathi R, Troung Q, Tirumala K, Reddy TP, Anekonda V, Shirendeb UP, Calkins MJ, Reddy AP, Mao P, Manczak M. Abnormal mitochondrial dynamics and synaptic degeneration as early events in Alzheimer's disease: implications to mitochondria-targeted antioxidant therapeutics. Biochim Biophys Acta. 2012;1822:639–649. doi: 10.1016/j.bbadis.2011.10.011. [DOI] [PMC free article] [PubMed] [Google Scholar]
- Reers M, Smith TW, Chen LB. J-aggregate formation of a carbocyanine as a quantitative fluorescent indicator of membrane potential. Biochemistry. 1991;30:4480–4486. doi: 10.1021/bi00232a015. [DOI] [PubMed] [Google Scholar]
- Sena-Esteves M, Tebbets JC, Steffens S, Crombleholme T, Flake AW. Optimized large-scale production of high titer lentivirus vector pseudotypes. J Virol Methods. 2004;122:131–139. doi: 10.1016/j.jviromet.2004.08.017. [DOI] [PubMed] [Google Scholar]
- Smith MA, Perry G, Richey PL, Sayre LM, Anderson VE, Beal MF, Kowall N. Oxidative damage in Alzheimer's. Nature. 1996;382:120–121. doi: 10.1038/382120b0. [DOI] [PubMed] [Google Scholar]
- Spires TL, Meyer-Luehmann M, Stern EA, McLean PJ, Skoch J, Nguyen PT, Bacskai BJ, Hyman BT. Dendritic spine abnormalities in amyloid precursor protein transgenic mice demonstrated by gene transfer and intravital multiphoton microscopy. J Neurosci. 2005;25:7278–7287. doi: 10.1523/JNEUROSCI.1879-05.2005. [DOI] [PMC free article] [PubMed] [Google Scholar]
- Tsai J, Grutzendler J, Duff K, Gan WB. Fibrillar amyloid deposition leads to local synaptic abnormalities and breakage of neuronal branches. Nat Neurosci. 2004;7:1181–1183. doi: 10.1038/nn1335. [DOI] [PubMed] [Google Scholar]
- Wang X, Su B, Siedlak SL, Moreira PI, Fujioka H, Wang Y, Casadesus G, Zhu X. Amyloid-beta overproduction causes abnormal mitochondrial dynamics via differential modulation of mitochondrial fission/fusion proteins. Proc Natl Acad Sci U S A. 2008;105:19318–19323. doi: 10.1073/pnas.0804871105. [DOI] [PMC free article] [PubMed] [Google Scholar]
- Wang X, Su B, Zheng L, Perry G, Smith MA, Zhu X. The role of abnormal mitochondrial dynamics in the pathogenesis of Alzheimer's disease. J Neurochem. 2009;109(Suppl 1):153–159. doi: 10.1111/j.1471-4159.2009.05867.x. [DOI] [PMC free article] [PubMed] [Google Scholar]
- Xie H, Hou S, Jiang J, Sekutowicz M, Kelly J, Bacskai BJ. Rapid cell death is preceded by amyloid plaque-mediated oxidative stress. Proc Natl Acad Sci U S A. 2013;110:7904–7909. doi: 10.1073/pnas.1217938110. [DOI] [PMC free article] [PubMed] [Google Scholar]