Mean ectopic lipid levels, such as intrahepatic lipid and intramyocellular lipid levels, and serum lipid levels are significantly positively associated with bone marrow fat in young obese men and women; because bone marrow fat is known to be inversely related to bone mineral density, these results support the notion that ectopic and serum lipid levels are influenced by the same additional factors as bone marrow or may exert negative effects on bone.
Abstract
Purpose
To investigate the associations between ectopic and serum lipid levels and bone marrow fat, as a marker of stem cell differentiation, in young obese men and women, with the hypothesis that ectopic and serum lipid levels would be positively associated with bone marrow fat.
Materials and Methods
The study was institutional review board approved and complied with HIPAA guidelines. Written informed consent was obtained. The study group comprised 106 healthy young men and women (mean age, 33.7 years ± 6.8 [standard deviation]; range, 19–45 years; mean body mass index (BMI), 33.1 kg/m2 ± 7.1; range, 18.1–48.8 kg/m2) who underwent hydrogen 1(1H) magnetic resonance (MR) spectroscopy by using a point-resolved spatially localized spectroscopy sequence at 3.0 T of L4 for bone marrow fat content, of soleus muscle for intramyocellular lipids (IMCL), and liver for intrahepatic lipids (IHL), serum cholesterol level, serum triglyceride level, and measures of insulin resistance (IR). Exercise status was assessed with the Paffenbarger activity questionnaire.
Results
There was a positive correlation between bone marrow fat and IHL (r = 0.21, P = .048), IMCL (r = 0.27, P = .02), and serum triglyceride level (r = 0.33, P = .001), independent of BMI, age, IR, and exercise status (P < .05). High-density lipoprotein cholesterol levels were inversely associated with bone marrow fat content, independent of BMI, age, IR, and exercise status (r = −0.21, P = .019).
Conclusion
Results of this study suggest that ectopic and serum lipid levels are positively associated with bone marrow fat in obese men and women.
© RSNA, 2013
Introduction
Although obesity is traditionally viewed as protective against osteoporosis, recent studies have linked obesity to osteoporosis and increased fracture risk (1,2). It has been suggested that specific fat compartments have differential effects on bone mineral density (BMD), with visceral fat exerting potential detrimental effects on bone health (3–5). In addition, the metabolic syndrome, which includes abdominal obesity, dyslipidemia, and impaired glucose tolerance, among other cardiovascular risk factors, is associated with osteoporotic fractures (6).
The pathophysiologic basis of obesity-associated bone loss is incompletely understood. Lipids and lipoproteins are emerging as important regulators of skeletal physiologic characteristics and have been shown to inhibit osteoblast and to enhance osteoclast differentiation and survival (7,8). Findings in a recent study (9) in postmenopausal women have revealed decreased BMD in subjects with nonalcoholic fatty liver disease, which is common in patients with the metabolic syndrome and obesity, suggesting an etiologic relationship between liver fat and bone loss. Intramyocellular lipids (IMCL) are ectopic lipids deposited in skeletal muscle that are increased in obesity and type 2 diabetes mellitus, and accumulation of IMCL is implicated as an etiologic factor in the development of muscle insulin resistance (10). However, the relationship between IMCL and bone has not been studied.
Obesity also influences stem cell differentiation into the adipocyte lineage at the expense of osteoblastogenesis (11), and concordant with this factor, we previously demonstrated an inverse association between bone marrow fat and BMD and a positive association between bone marrow fat and visceral fat in obese premenopausal men and women (3,12). However, the associations between intrahepatic lipids (IHL), IMCL, serum lipids, and bone marrow fat have not been studied.
The purpose of our study was to investigate the associations between ectopic lipid levels, serum lipid levels, and bone marrow fat, as a marker of stem cell differentiation, in young, obese but otherwise healthy men and women. We hypothesized that ectopic and serum lipid levels would be positively associated with bone marrow fat.
Materials and Methods
The study was approved by our institutional review board and complied with Health Insurance Portability and Accountability Act guidelines. Written informed consent was obtained from all subjects after the nature of the procedures had been fully explained.
Subjects
The study group comprised 106 healthy premenopausal women and men of similar mean age who were recruited from the community through advertisements. Inclusion criteria were an age that ranged from 18 to 45 years and eumenorrhea in women. Exclusion criteria included hypothalamic or pituitary disorders, diabetes mellitus, or other chronic illnesses; smoking; use of osteoporosis medication or medication that could influence bone metabolism, such as estrogen or glucocorticoids, anticonvulsants, selective serotonin reuptake inhibitors, and proton pump inhibitors; and contraindications to magnetic resonance (MR) imaging, such as the presence of a pacemaker or metallic implant. None of the patients had a history of liver disease.
Each participant underwent proton MR spectroscopy (hydrogen 1 [1H] MR spectroscopy) for quantification of bone marrow fat content, IMCL, and IHL. All subjects underwent a 75-g, 2-hour oral glucose tolerance test; and laboratory tests included fasting triglyceride levels and total, high-density lipoprotein (HDL), and low-density lipoprotein (LDL) cholesterol levels. Level of activity, including exercise, was assessed by using the Paffenbarger questionnaire, a self-administered questionnaire that measures current levels of activity.
Clinical characteristics, ectopic lipid levels, and bone marrow fat data have been previously reported in 50 women (12–17), and bone marrow fat data have been reported in 35 men (3). However, none of these have been reported in the entire cohort, and the associations between ectopic lipids, serum lipid levels, and bone marrow fat have not been described in any of the subjects.
Proton MR Spectroscopy (1H MR Spectroscopy)
All subjects underwent 1H MR spectroscopy of the fourth lumbar vertebral body to determine bone marrow lipid content, of soleus muscle to determine IMCL and total lipid levels, and of the liver to determine IHL. 1H MR spectroscopy studies and analyses were performed with the supervision of two musculoskeletal radiologists with 8 years of experience (M.A.B.) and 16 years of experience (M.T.). Studies were performed after an 8-hour overnight fast. All studies were performed by using a 3.0-T MR imaging system (Siemens Trio; Siemens Medical Systems, Erlangen, Germany). Coefficient of variation for measurements at our institution is 3% for bone marrow fat quantification, 6% for intramuscular fat quantification, and 8% for intrahepatic fat quantification.
1H MR spectroscopy of bone marrow.—For L4 marrow 1H MR spectroscopy, subjects were positioned feet first in the magnet bore in the prone position. A body matrix phased-array coil was positioned over the lumbar region. A triplane gradient-echo localizer pulse sequence of the lumbar spine was performed to localize the L4 vertebral body, with the following parameters: repetition time msec/echo time msec, 15/5; section thickness, 3 mm. A voxel measuring 15 × 15 × 15 mm3 (3.4 cm3) was placed within the L4 vertebral body. Single-voxel 1H MR spectroscopy data were acquired by using a point-resolved spatially localized spectroscopy pulse sequence without water suppression and the following parameters: 3000/30, eight acquisitions, 1024 data points, and receiver bandwidth of 2 KHz. The bandwidth of the 90° excitation pulse was 3.24 KHz, and that of the 180° refocusing pulse was 1.2 KHz. On the basis of reasonable estimates of the pulse durations for the used voxels, the calculated chemical shift was 3.6% per parts per million in the excitation direction and 10.6% per parts per million in the refocusing direction. Careful positioning of the voxel took into account the fact that the shifted fat-water voxels would still contain the same tissue types. For each voxel placement, automated optimization of gradient shimming was performed.
1H MR spectroscopy of the liver.—For 1H MR spectroscopy of the liver, subjects were positioned supine and feet first in the magnet bore. A body matrix phased-array coil was positioned over the abdomen. A triplane gradient-echo localizer pulse sequence was performed in the abdomen to localize the liver, with the following parameters: 15/5; section thickness, 3 mm. Subsequently, a breath-hold true fast imaging with steady-state precession sequence in the liver was performed, with the following parameters: 3.8/1.9; section thickness, 10 mm; and imaging time, 11 seconds. A voxel measuring 20 × 20 × 20 mm3 (8 cm3) was placed within the right hepatic lobe, avoiding vessels or artifacts. For each voxel placement, automated optimization of gradient shimming was performed. Single breath-hold single-voxel 1H MR spectroscopy data were acquired by using a point-resolved spatially localized spectroscopy pulse sequence without water suppression, with the following parameters: 1500/30; number of acquisitions, eight; number of data points, 1024; and receiver bandwidth, 2000 Hz.
1H MR spectroscopy of soleus muscle.—For 1H MR spectroscopy of soleus muscle, subjects were positioned feet first in the magnet bore, and the right calf was placed in a commercially available transmit-receive quadrature extremity coil with an 18-cm diameter (USA Instruments, Aurora, Ohio). A triplane gradient-echo localizer pulse sequence was performed, with the following parameter: 15/5. Axial T1-weighted images of the proximal two-thirds of the calf were obtained, with the following parameters: 400/11; section thickness, 4 mm; intersection gap, 1 mm; matrix, 512; number of signals acquired, one; and field of view, 22 cm. A voxel measuring 15 × 15 × 15 mm3 (3.4 cm3) was placed on the axial T1-weighted section with largest cross-sectional area of soleus muscle, avoiding visible interstitial tissue, fat, or vessels. Single-voxel 1H MR spectroscopy data were acquired by using a point-resolved spatially localized spectroscopy pulse sequence, with the following parameters: 3000/30; number of acquisitions, 64; data points, 1024; and receiver bandwidth, 1000 Hz. Frequency-selective water signal suppression (chemical shift-selective, or CHESS, water suppression) was used for metabolite acquisition (bandwidth for water suppression, 50 Hz), and unsuppressed water spectra of the same voxel were obtained for each image, with the same parameters as were used for the metabolite acquisition, except for the use of eight acquisitions. For each voxel placement, automated optimization of gradient shimming, water suppression, and transmit-receive gain were performed, followed by manual adjustment of gradient shimming, targeting water line widths of 12–14 Hz.
1H MR Spectroscopy Data Analysis
Fitting of all 1H MR spectroscopy data was performed by using LCModel (version 6.3–0 K; Stephen Provencher, Oakville, Ontario, Canada) (18). Data were transferred from the imaging unit to a Linux workstation (Canonical, Lexington, Mass), and metabolite quantification was performed by using eddy current correction and water scaling. Fitting algorithms specific for bone marrow and liver lipid estimates were scaled to unsuppressed water peak (4.7 ppm) and expressed as lipid-to-water ratio. For liver and marrow analysis, the lipid peaks included resonances at 0.9, 1.3, and 2.0 ppm. For soleus muscle, IMCL (1.3 ppm) and extramyocellular lipid (1.5 ppm) methylene estimates and a combined estimate for lipid peaks (total muscle lipid levels) (0.9, 1.1, 1.3, 1.5, 2.1, and 2.3 ppm) were automatically scaled to unsuppressed water peak (4.7 ppm) and expressed as lipid-to-water ratio. The jMRUI software package (A. van den Boogaart, Katholieke Universiteit Leuven, Leuven, Belgium) was used for measurement of line widths (full width at half maximum) and signal to noise ratio of unsuppressed water peaks, analyzing each time domain directly from free induction decays. Full width at half maximum was calculated automatically by using the Hankel-Lanczos single-variable decomposition fitting algorithm. Signal-to-noise ratio was determined by using the ratio between maximal unsuppressed water amplitude at 4.7 ppm measured with Hankel-Lanczos single-variable decomposition and noise root mean square (standard deviation) extracted from the final 10% of free induction decay (102 data points).
Spectra were plotted by using software (iNMR 3.6.2; Nucleomatica/Mestrelab Research, Molfetta, Italy) after postprocessing with a 1-Hz Gaussian filter and automatic baseline correction.
Statistical Analysis
Statistical database software (JMP, version 5.0.1; SAS Institute, Cary, NC) was used for statistical analyses. Variables were tested for normality of distribution by using the Shapiro-Wilk test. Variables that were not normally distributed were log transformed. Linear regression analysis was performed. Because bone marrow fat increases with age and our aim was to study body mass index (BMI)-independent effects of ectopic and serum lipid levels on bone marrow fat, we used multivariate standard least squares regression modeling to control for BMI and age. As IMCL increase with insulin resistance and as IMCL can also be increased in insulin-sensitive athletes, we controlled for insulin resistance by using the 2-hour glucose level from the oral glucose tolerance test and exercise status (number of hours of vigorous exercise per week) by using the Paffenbarger questionnaire. Forward stepwise regression modeling was also performed to determine predictors of bone marrow fat. The normal-weight and obese groups were compared by using the Student t test. P ≤ .05 was used to denote significance, and P ≤ .1 was used to denote a trend. Data are presented as means ± standard deviation.
Results
Clinical Characteristics of Study Subjects
Subject characteristics are shown in Table 1. The study group included 60 women and 46 men. The age of study participants ranged from 19 to 45 years, with a mean age of 33.7 years ± 6.8 (standard deviation). Women ranged in age from 19 to 45 years, with a mean age of 33.9 years ± 7.2. Men ranged in age from 21 to 45 years, with a mean age of 33.7 years ± 6.3. BMI of study participants ranged from 18.1 to 48.8 kg/m2, with a mean BMI of 33.1 kg/m2 ± 7.1. Eighty-eight subjects were overweight or obese (BMI > 25 kg/m2) and 18 subjects were of normal weight (BMI < 25 kg/m2). Average vigorous activity was 4.8 hours per week ± 5.9. None of the subjects were trained athletes.
Table 1.
Clinical Characteristics of All Study Subjects
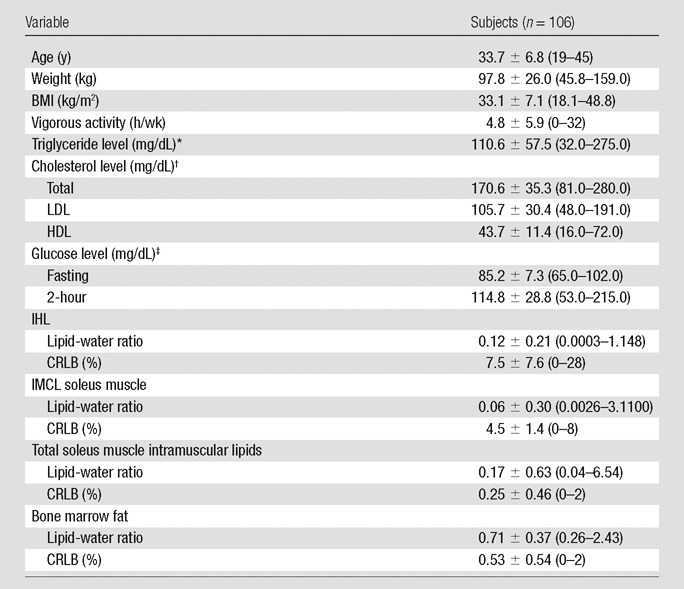
Note.—Data are means ± standard deviations. Numbers in parentheses are ranges. CRLB = Cramer-Rao lower bounds.
To convert to Système International units in millimoles per liter, multiply by 0.0113.
To convert to Système International units in millimoles per liter, multiply by 0.0259.
To convert to Système International units in millimoles per liter, multiply by 0.0555.
Obese subjects had higher serum lipid levels, lower HDL cholesterol, and higher IMCL, total muscle lipid content, IHL, and marrow fat (trend) compared with data in normal-weight control subjects (Table 2).
Table 2.
Body Composition and Serum Lipid Levels in Obese and Normal-weight Control Subjects
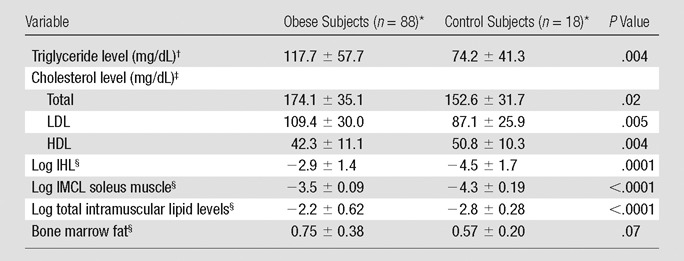
Data are the means ± standard deviations.
To convert to Système International units in millimoles per liter, multiply by 0.0113.
To convert to Système International units in millimoles per liter, multiply by 0.0259.
Values are lipid-water ratio.
Effects of Ectopic and Serum Lipid Levels on Bone Marrow Fat
All spectra of bone marrow fat, liver, and soleus muscle were of diagnostic quality and were used for analyses. Mean signal-to-noise ratio and mean full width at half maximum for marrow spectra were 224 Hz ± 108 and 49 Hz ± 10, respectively and for liver spectra were 201 Hz ± 62 and 30 Hz ± 11, respectively. Mean CRLBs for marrow, liver, and muscle spectra are provided in Table 1.
There was a positive correlation between log IHL and log bone marrow fat (r = 0.21, P = .048) (Fig 1a), which remained significant after controlling for BMI, age, insulin resistance (IR), and exercise status (P = .027). There was a positive correlation between log IMCL and log bone marrow fat (r = 0.24, P = .022) (Fig 1b), which remained significant after controlling for age, BMI, IR, and exercise status (P = .05). There was a positive correlation between log total muscle lipid content and log bone marrow fat (r = 0.25, P = .014) (Fig 1c), which remained significant after controlling for IR (P = .02) but became a trend after controlling for age and BMI (P = .054) and exercise status (P = .066). There were positive associations between IMCL and 2-hour glucose levels (r = 0.21, P = .027). There were no significant associations between fasting or 2-hour glucose levels or exercise status and bone marrow fat (P = .29 to P = .76). Figures 2 and 3 show representative subjects with high and low IHL, respectively, and corresponding vertebral marrow fat spectra. Figures 4 and 5 show representative IMCL spectra of subjects with high (Fig 4) and low (Fig 5) bone marrow fat content. Spectra for Figures 2–5 were plotted by using software (iNMR 3.6.2; Nucleomatica/Mestrelab Research).
Figure 1a:
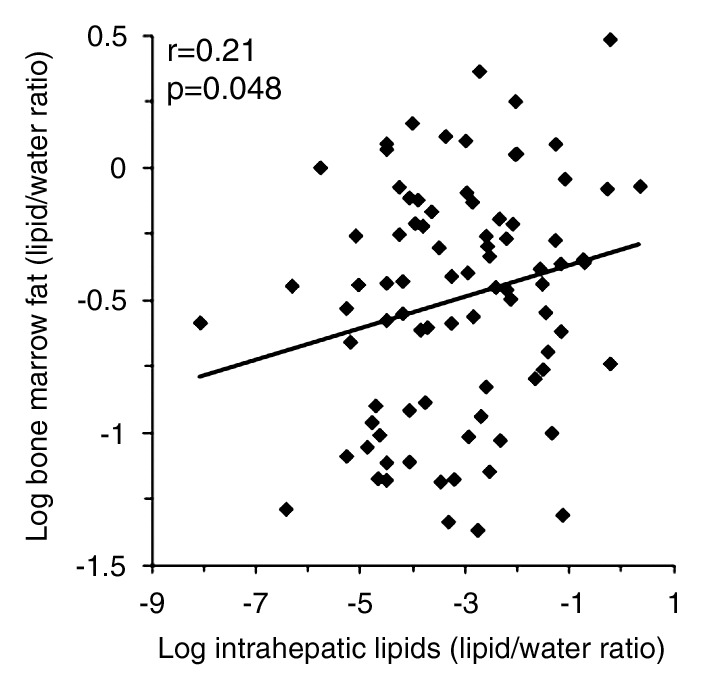
(a–d) Nonadjusted regression analysis between bone marrow fat and ectopic and serum lipid levels. There are positive correlations between bone marrow fat and (a) IHL, (b) IMCL, (c) total muscle lipid levels, and (d) serum triglyceride levels.
Figure 1b:
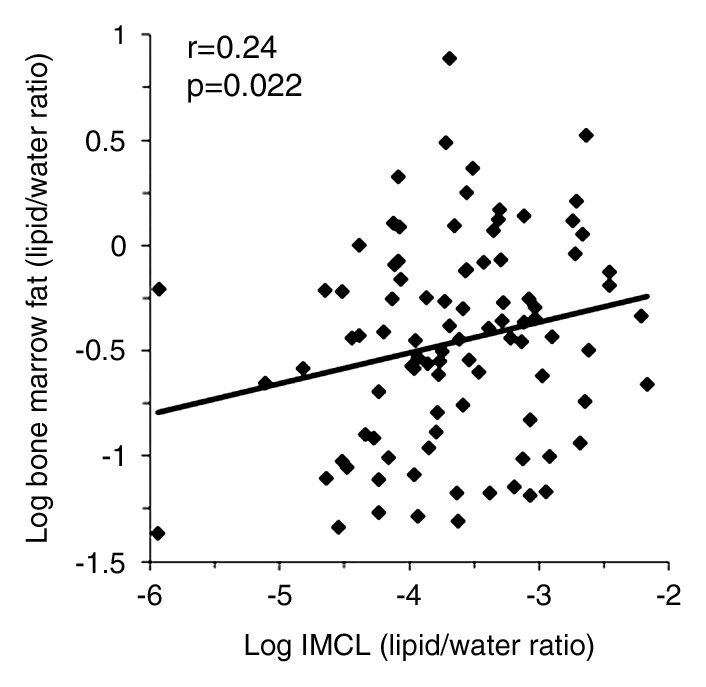
(a–d) Nonadjusted regression analysis between bone marrow fat and ectopic and serum lipid levels. There are positive correlations between bone marrow fat and (a) IHL, (b) IMCL, (c) total muscle lipid levels, and (d) serum triglyceride levels.
Figure 1c:
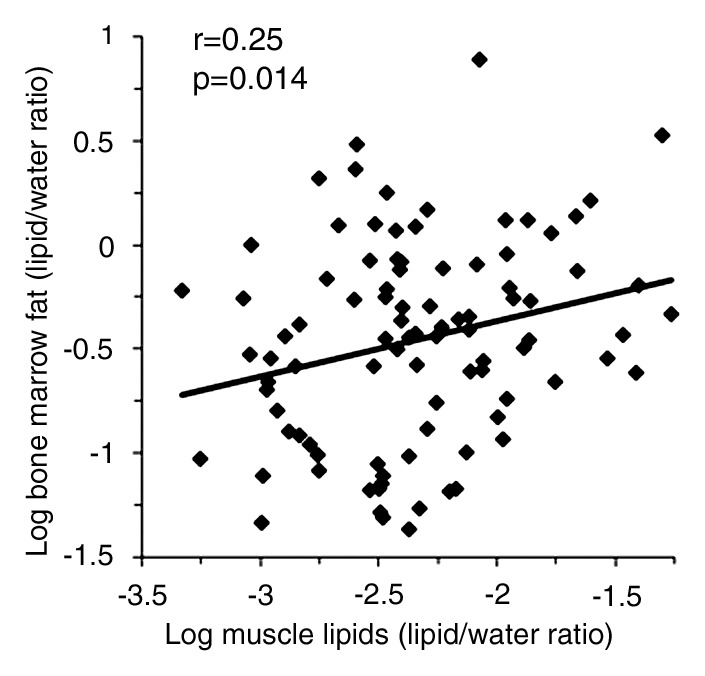
(a–d) Nonadjusted regression analysis between bone marrow fat and ectopic and serum lipid levels. There are positive correlations between bone marrow fat and (a) IHL, (b) IMCL, (c) total muscle lipid levels, and (d) serum triglyceride levels.
Figure 2a:
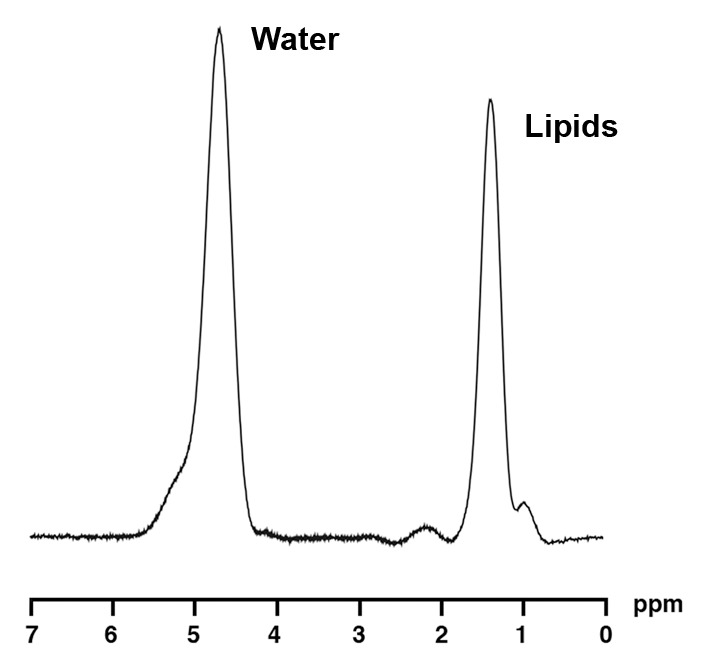
1H MR spectroscopy of liver and bone marrow in a 35-year-old obese man (BMI, 37.4 kg/m2) with high IHL content. For purposes of visual comparison, the amplitude of unsuppressed water in Figures 2 and 3 were scaled identically. (a) 1H MR spectrum of liver shows lipid (1.3 ppm) and unsuppressed water (4.7 ppm) resonances. (b) 1H MR spectrum of bone marrow at L4 shows lipid (1.3 ppm) and unsuppressed water (4.7 ppm) resonances.
Figure 3a:
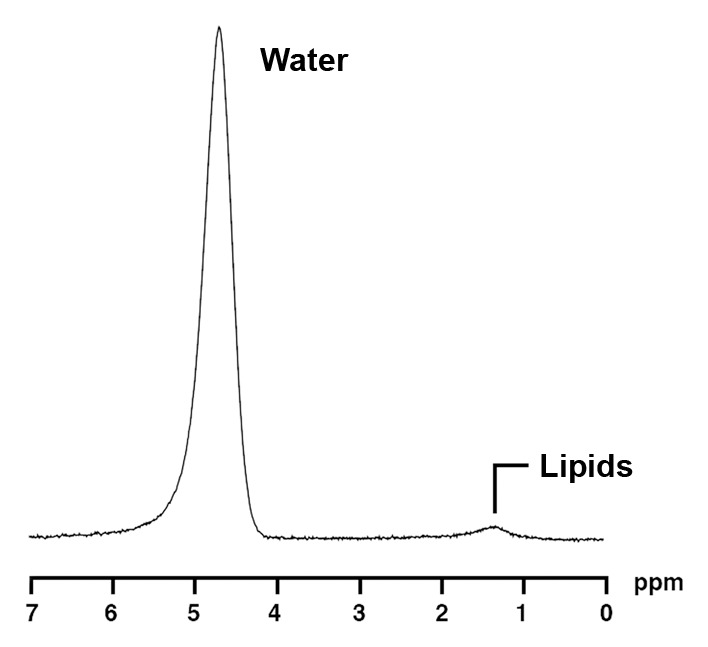
1H MR spectroscopy of liver and bone marrow in a 37-year-old obese man with similar BMI as subject in Figure 2 (BMI, 37.2 kg/m2) but with lower IHL content. Despite similar age and BMI, this obese man has lower bone marrow fat content (0.3 vs 0.93 lipid-water ratio). (a) 1H MR spectrum of liver shows lipid (1.3 ppm) and unsuppressed water (4.7 ppm) resonances. (b) 1H MR spectrum of bone marrow at L4 shows lipid (1.3 ppm) and unsuppressed water (4.7 ppm) resonances.
Figure 4:
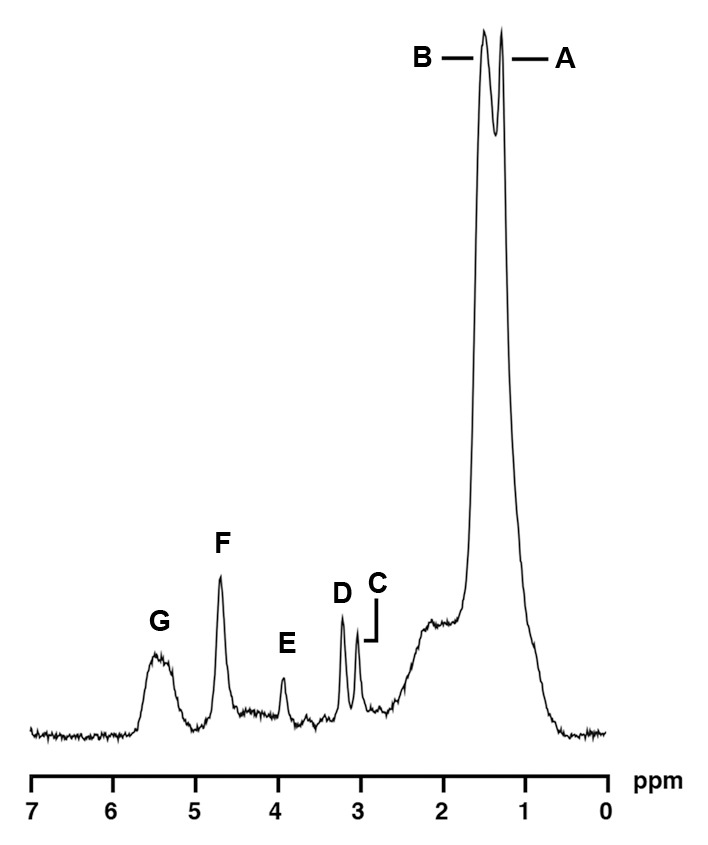
1H MR spectroscopy of soleus muscle in a 35-year-old obese woman (BMI, 41.0 kg/m2) with high IMCL and high bone marrow fat content. For purposes of visual comparison, the amplitude of total creatine peaks in Figures 4 and 5 were scaled identically. 1H MR spectrum of soleus muscle shows the following metabolite peaks: A, IMCL methylene protons (−CH2) at 1.3 ppm; B, extramyocellular lipid methylene protons (−CH2) at 1.5 ppm; C, total creatine (−CH3) resonance at 3.0 ppm; D, trimethylamines peak at 3.2 ppm; E, creatine (−CH2) resonance at 3.96 ppm; F, residual water peak at 4.7 ppm; and G, olefinic proton (HC=CH) resonances at 5.3–5.5 ppm.
Figure 5:
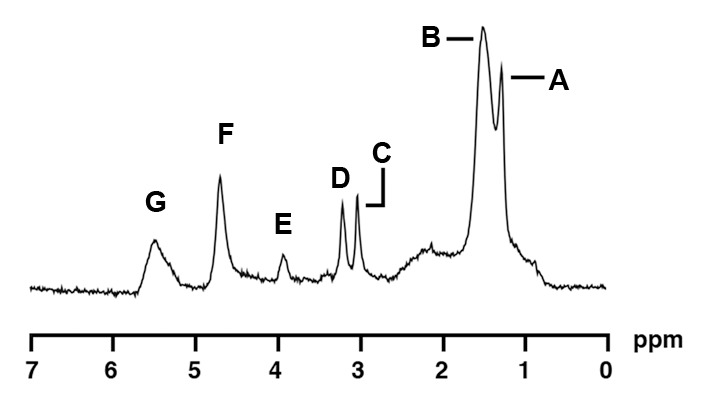
1H MR spectroscopy of soleus muscle in a 34-year-old obese woman (BMI, 38.0 kg/m2) with low IMCL content. Despite similar age and BMI, this obese woman had lower bone marrow fat content (0.33 vs 1.06 lipid-water ratio). 1H MR spectrum of soleus muscle shows the following metabolite peaks: A, IMCL methylene protons (−CH2) at 1.3 ppm; B, extramyocellular lipid methylene protons (−CH2) at 1.5 ppm; C, total creatine (−CH3) resonance at 3.0 ppm; D, trimethylamines peak at 3.2 ppm; E, creatine (−CH2) resonance at 3.96 ppm; F, residual water peak at 4.7 ppm; and G, olefinic proton (HC=CH) resonances at 5.3–5.5 ppm.
Figure 2b:
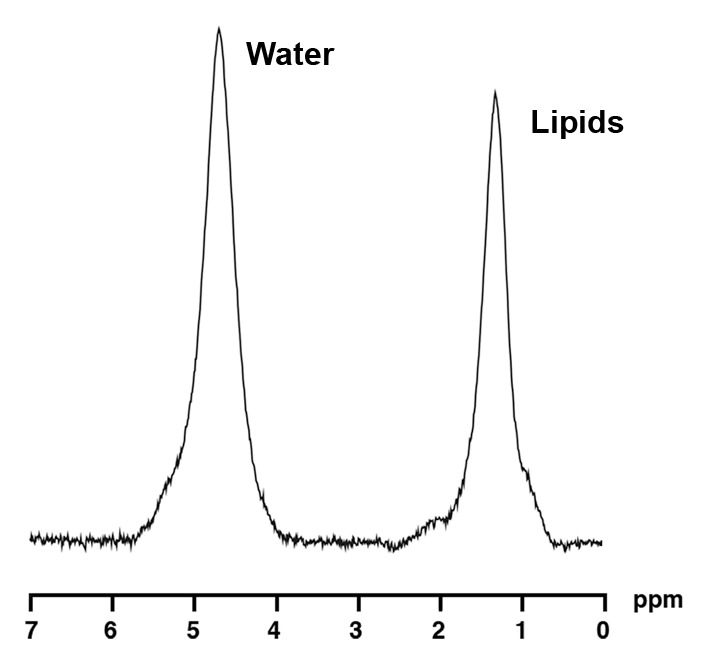
1H MR spectroscopy of liver and bone marrow in a 35-year-old obese man (BMI, 37.4 kg/m2) with high IHL content. For purposes of visual comparison, the amplitude of unsuppressed water in Figures 2 and 3 were scaled identically. (a) 1H MR spectrum of liver shows lipid (1.3 ppm) and unsuppressed water (4.7 ppm) resonances. (b) 1H MR spectrum of bone marrow at L4 shows lipid (1.3 ppm) and unsuppressed water (4.7 ppm) resonances.
Figure 3b:
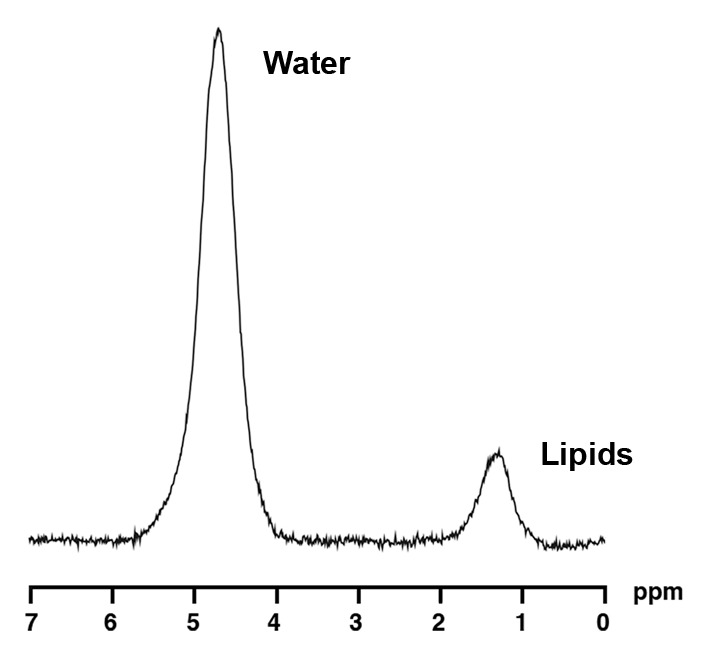
1H MR spectroscopy of liver and bone marrow in a 37-year-old obese man with similar BMI as subject in Figure 2 (BMI, 37.2 kg/m2) but with lower IHL content. Despite similar age and BMI, this obese man has lower bone marrow fat content (0.3 vs 0.93 lipid-water ratio). (a) 1H MR spectrum of liver shows lipid (1.3 ppm) and unsuppressed water (4.7 ppm) resonances. (b) 1H MR spectrum of bone marrow at L4 shows lipid (1.3 ppm) and unsuppressed water (4.7 ppm) resonances.
There was a positive correlation between log serum triglyceride levels and log bone marrow fat (r = 0.33, P = .001) (Fig 1d), which remained significant after controlling for BMI, age, IR, and exercise status (P = .008) and a trend toward an inverse association between HDL cholesterol level and bone marrow fat (r = −0.20, P = .06), which became significant after controlling for BMI, age, IR, and exercise status (P = .019).
Figure 1d:
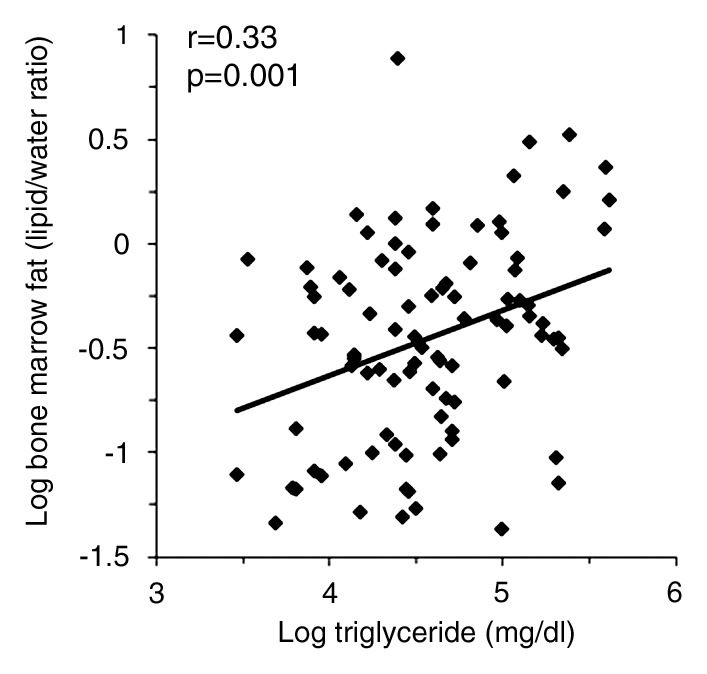
(a–d) Nonadjusted regression analysis between bone marrow fat and ectopic and serum lipid levels. There are positive correlations between bone marrow fat and (a) IHL, (b) IMCL, (c) total muscle lipid levels, and (d) serum triglyceride levels.
There was a positive correlation between bone marrow fat and age (r = 0.27. P = .008) and weight (r = 0.27, P = .009), while there was no association between bone marrow fat and BMI (P = .153), total cholesterol level (P = .447), and LDL cholesterol level (P = .202).
Predictors of Bone Marrow Fat
When bone marrow fat was entered as a dependent variable in a forward stepwise regression model and IHL, IMCL, triglyceride levels, and BMI were entered as independent variables, serum triglyceride levels were significant predictors of bone marrow fat. Triglyceride levels explained 10% (r2 = 0.10, P = .003) of the variability of bone marrow fat.
Discussion
Our study in obese young men and women showed positive associations between IHL, IMCL, serum lipids, and bone marrow fat, a marker of stem cell differentiation, independent of BMI, age, IR, and exercise status. Furthermore, we demonstrated an inverse association between HDL cholesterol level and bone marrow fat.
Accumulation of bone marrow fat has traditionally been thought of as a space filler (19); however, findings in recent studies have suggested an important link between bone and fat (11,20,21). Both bone and fat cells arise from the same mesenchymal stem cell within bone marrow, capable of differentiation into osteoblasts, adipocytes, and marrow fat (11,21), and increased bone marrow fat content has been shown to be an indicator of bone weakening (22). We were able to quantify bone marrow fat content noninvasively in all subjects with use of 1H MR spectroscopy, and 1H MR spectroscopy might be added to routine spinal MR imaging to identify subjects at risk for bone loss.
Stem cell differentiation is under the control of several transcription factors and signaling pathways (23,24), and obesity has been found to cause a shift into the adipocyte lineage (11,20). In our study, obese subjects had higher bone marrow fat content compared with normal-weight subjects, confirming the role of obesity as a regulator of stem cell differentiation.
Obesity is associated with increased IHL and IMCL (13,14,17). We found a positive correlation between bone marrow fat and IHL, independent of BMI, age, and IR. These results are concordant with data in a prior study in which the researchers demonstrated that there was an inverse association between IHL and BMD in postmenopausal women with nonalcoholic fatty liver disease (9). Potential mechanisms for low BMD in patients with chronic liver disease include decreased levels of insulin-like growth factor 1 (25) and detrimental effects of bilirubin level on osteoblast proliferation (26). In our healthy obese subjects without a history of liver disease, IHL were positively associated with bone marrow fat, even after adjusting for BMI, age, and IR, suggesting that IHL may be involved in bone marrow adipogenesis, independent of obesity. Therefore, patients with increased liver fat may be at risk for low BMD, and 1H MR spectroscopy can be used to identify these patients at risk for bone loss.
We observed a positive correlation between vertebral bone marrow fat and IMCL of soleus muscle. IMCL are increased in subjects with obesity and are thought to play an etiologic role in the development of insulin resistance (10). However, IMCL can also be increased in insulin-sensitive athletes (27). We therefore controlled for measures of IR and exercise status in our correlational analyses. We have previously shown significant correlations among IMCL, soleus muscle, different fat depots (visceral adipose tissue, subcutaneous adipose tissue, abdomen, and thigh), serum lipid levels, and markers of insulin resistance (14,17).
Lee et al (28) have suggested that bone may exert an endocrine regulation of glucose homeostasis. In their study, mice lacking the osteoblast-secreted molecule osteocalcin showed decreased beta-cell proliferation, glucose intolerance, and insulin resistance (28). Additionally, a study using cell cultures of mesenchymal stem cells from diabetic and nondiabetic donors found that high glucose concentrations reduce osteoblastogenesis of stem cells while enhancing adipogenesis (29). These results suggest that insulin resistance leads to increased marrow fat formation and concordant inhibition of osteoblast formation. This phenomenon might serve as an explanation for our observed correlation between marrow adiposity and IMCL. However, further studies are necessary to study the effect of bone marrow fat on glucose homeostasis and to use 1H MR spectroscopy to identify patients at risk for bone loss. We also found a positive association between total muscle lipid content and bone marrow fat. This is concordant with results in prior studies in which researchers showed fatty infiltration of skeletal muscle measured by using computed tomography to be a negative predictor of BMD (4) and a risk factor for hip fractures (30). Therefore, patients with insulin resistance and elevated muscle fat content might benefit from evaluation of BMD.
Researchers in prior studies have proposed that serum lipids are damaging to bone. Elevated serum lipid and lipoprotein levels inhibit osteoblast differentiation and enhance osteoclast differentiation and survival in mouse models and in vitro (7,8). Statin therapy to lower hyperlipidemia is associated with increased BMD and decreased fracture risk (31,32), and bisphosphonates have been shown to lower serum LDL cholesterol (33). We found a positive correlation between serum triglyceride levels and bone marrow fat, confirming negative effects of serum lipid levels on bone health. HDL cholesterol levels were inversely associated with bone marrow fat, which is consistent with findings in prior studies in which researchers demonstrated HDL levels to be a positive predictor of BMD in postmenopausal women (34).
Our study had several limitations. First, the cross-sectional study design limited our ability to ascertain causality. Second, we studied only premenopausal women and men of comparable age, and our findings cannot be extrapolated to postmenopausal women or older men. Third, the relationship between bone and fat is complex and is mediated by additional factors. Fourth, we used exercise questionnaires to evaluate exercise status and did not measure aerobic capacity directly. A strength of our study is the large number of subjects and detailed assessment of bone marrow fat, IHL, and IMCL levels by using 1H MR spectroscopy at 3.0 T. Furthermore, this is the first study, to our knowledge, in which the association among IHL and IMCL, serum lipid levels, and bone marrow fat has been examined, providing more insights into the bone-fat connection and the pathophysiologic characteristics of obesity-associated bone loss.
In conclusion, ectopic lipid levels, such as IHL and IMCL, and serum lipid levels are positively associated with bone marrow fat in young obese men and women, independent of IR and exercise status. Because bone marrow fat is known to be inversely related to BMD, these results support the notion that ectopic and serum lipid levels are influenced by the same additional factors as bone marrow or may exert negative effects on bone. 1H MR spectroscopy might be used to identify patients at risk for bone loss. Further studies are needed to investigate this hypothesis and other potential mediators of the effects of obesity on bone.
Advances in Knowledge
■ Mean intrahepatic lipids (IHL) and intramyocellular lipids (IMCL), as well as mean serum triglyceride levels, are on average significantly positively associated with bone marrow fat in obese men and women.
■ Significant positive correlation between mean IHL and IMCL with bone marrow fat is independent of insulin resistance and exercise status.
Implication for Patient Care
■ Increased ectopic and serum lipid levels may be detrimental to bone, and 1H MR spectroscopy can be used to identify patients at risk for bone loss.
Received February 12, 2013; revision requested March 26; final revision received April 9; accepted April 26; final version accepted April 30.
Funding: This research was supported by the National Institutes of Health (grants R01 HL-077674, UL1 RR-025758, and K23 RR-23090).
Disclosures of Conflicts of Interest: M.A.B. No relevant conflicts of interest to disclose. C.M.G. No relevant conflicts of interest to disclose. A.V.G. No relevant conflicts of interest to disclose. M.G.L. No relevant conflicts of interest to disclose. V.K. No relevant conflicts of interest to disclose. S.M.D. No relevant conflicts of interest to disclose. M.T. No relevant conflicts of interest to disclose. K.K.M. No relevant conflicts of interest to disclose.
Abbreviations:
- BMD
- bone mineral density
- BMI
- body mass index
- CRLB
- Cramer-Rao lower bounds
- HDL
- high-density lipoprotein
- IHL
- intrahepatic lipids
- IMCL
- intramyocellular lipids
- IR
- insulin resistance
- LDL
- low-density lipoprotein
References
- 1.Goulding A, Jones IE, Taylor RW, Williams SM, Manning PJ. Bone mineral density and body composition in boys with distal forearm fractures: a dual-energy x-ray absorptiometry study. J Pediatr 2001;139(4):509–515. [DOI] [PubMed] [Google Scholar]
- 2.Nielson CM, Marshall LM, Adams AL, et al. BMI and fracture risk in older men: the osteoporotic fractures in men study (MrOS). J Bone Miner Res 2011;26(3):496–502. [DOI] [PMC free article] [PubMed] [Google Scholar]
- 3.Bredella MA, Lin E, Gerweck AV, et al. Determinants of bone microarchitecture and mechanical properties in obese men. J Clin Endocrinol Metab 2012;97(11):4115–4122. [DOI] [PMC free article] [PubMed] [Google Scholar]
- 4.Bredella MA, Torriani M, Ghomi RH, et al. Determinants of bone mineral density in obese premenopausal women. Bone 2011;48(4):748–754. [DOI] [PMC free article] [PubMed] [Google Scholar]
- 5.Gilsanz V, Chalfant J, Mo AO, Lee DC, Dorey FJ, Mittelman SD. Reciprocal relations of subcutaneous and visceral fat to bone structure and strength. J Clin Endocrinol Metab 2009;94(9):3387–3393. [DOI] [PMC free article] [PubMed] [Google Scholar]
- 6.Kim KC, Shin DH, Lee SY, Im JA, Lee DC. Relation between obesity and bone mineral density and vertebral fractures in Korean postmenopausal women. Yonsei Med J 2010;51(6):857–863. [DOI] [PMC free article] [PubMed] [Google Scholar]
- 7.Parhami F, Tintut Y, Beamer WG, Gharavi N, Goodman W, Demer LL. Atherogenic high-fat diet reduces bone mineralization in mice. J Bone Miner Res 2001;16(1):182–188. [DOI] [PubMed] [Google Scholar]
- 8.Tintut Y, Morony S, Demer LL. Hyperlipidemia promotes osteoclastic potential of bone marrow cells ex vivo. Arterioscler Thromb Vasc Biol 2004;24(2):e6–e10. [DOI] [PubMed] [Google Scholar]
- 9.Moon SS, Lee YS, Kim SW. Association of nonalcoholic fatty liver disease with low bone mass in postmenopausal women. Endocrine 2012;42(2):423–429. [DOI] [PubMed] [Google Scholar]
- 10.Shulman GI. Cellular mechanisms of insulin resistance. J Clin Invest 2000;106(2):171–176. [DOI] [PMC free article] [PubMed] [Google Scholar]
- 11.Rosen CJ, Bouxsein ML. Mechanisms of disease: is osteoporosis the obesity of bone? Nat Clin Pract Rheumatol 2006;2(1):35–43. [DOI] [PubMed] [Google Scholar]
- 12.Bredella MA, Torriani M, Ghomi RH, et al. Vertebral bone marrow fat is positively associated with visceral fat and inversely associated with IGF-1 in obese women. Obesity (Silver Spring) 2011;19(1):49–53. [DOI] [PMC free article] [PubMed] [Google Scholar]
- 13.Bredella MA, Ghomi RH, Thomas BJ, Miller KK, Torriani M. Comparison of 3.0 T proton magnetic resonance spectroscopy short and long echo-time measures of intramyocellular lipids in obese and normal-weight women. J Magn Reson Imaging 2010;32(2):388–393. [DOI] [PMC free article] [PubMed] [Google Scholar]
- 14.Bredella MA, Ghomi RH, Thomas BJ, et al. Breath-hold 1H-magnetic resonance spectroscopy for intrahepatic lipid quantification at 3 Tesla. J Comput Assist Tomogr 2010;34(3):372–376. [DOI] [PMC free article] [PubMed] [Google Scholar]
- 15.Bredella MA, Lin E, Brick DJ, et al. Effects of GH in women with abdominal adiposity: a 6-month randomized, double-blind, placebo-controlled trial. Eur J Endocrinol 2012;166(4):601–611. [DOI] [PMC free article] [PubMed] [Google Scholar]
- 16.Bredella MA, Torriani M, Ghomi RH, et al. Adiponectin is inversely associated with intramyocellular and intrahepatic lipids in obese premenopausal women. Obesity (Silver Spring) 2011;19(5):911–916. [DOI] [PMC free article] [PubMed] [Google Scholar]
- 17.Bredella MA, Torriani M, Thomas BJ, et al. Peak growth hormone-releasing hormone-arginine-stimulated growth hormone is inversely associated with intramyocellular and intrahepatic lipid content in premenopausal women with obesity. J Clin Endocrinol Metab 2009;94(10):3995–4002. [DOI] [PMC free article] [PubMed] [Google Scholar]
- 18.Provencher SW. Estimation of metabolite concentrations from localized in vivo proton NMR spectra. Magn Reson Med 1993;30(6):672–679. [DOI] [PubMed] [Google Scholar]
- 19.Tavassoli M. Marrow adipose cells and hemopoiesis: an interpretative review. Exp Hematol 1984;12(2):139–146. [PubMed] [Google Scholar]
- 20.Rosen CJ, Klibanski A. Bone, fat, and body composition: evolving concepts in the pathogenesis of osteoporosis. Am J Med 2009;122(5):409–414. [DOI] [PubMed] [Google Scholar]
- 21.Takeda S, Elefteriou F, Karsenty G. Common endocrine control of body weight, reproduction, and bone mass. Annu Rev Nutr 2003;23:403–411. [DOI] [PubMed] [Google Scholar]
- 22.Schellinger D, Lin CS, Hatipoglu HG, Fertikh D. Potential value of vertebral proton MR spectroscopy in determining bone weakness. AJNR Am J Neuroradiol 2001;22(8):1620–1627. [PMC free article] [PubMed] [Google Scholar]
- 23.Abdallah BM, Ding M, Jensen CH, et al. Dlk1/FA1 is a novel endocrine regulator of bone and fat mass and its serum level is modulated by growth hormone. Endocrinology 2007;148(7):3111–3121. [DOI] [PubMed] [Google Scholar]
- 24.Takada I, Suzawa M, Matsumoto K, Kato S. Suppression of PPAR transactivation switches cell fate of bone marrow stem cells from adipocytes into osteoblasts. Ann N Y Acad Sci 2007;1116:182–195. [DOI] [PubMed] [Google Scholar]
- 25.Gallego-Rojo FJ, Gonzalez-Calvin JL, Muñoz-Torres M, Mundi JL, Fernandez-Perez R, Rodrigo-Moreno D. Bone mineral density, serum insulin-like growth factor I, and bone turnover markers in viral cirrhosis. Hepatology 1998;28(3):695–699. [DOI] [PubMed] [Google Scholar]
- 26.Janes CH, Dickson ER, Okazaki R, Bonde S, McDonagh AF, Riggs BL. Role of hyperbilirubinemia in the impairment of osteoblast proliferation associated with cholestatic jaundice. J Clin Invest 1995;95(6):2581–2586. [DOI] [PMC free article] [PubMed] [Google Scholar]
- 27.Goodpaster BH, He J, Watkins S, Kelley DE. Skeletal muscle lipid content and insulin resistance: evidence for a paradox in endurance-trained athletes. J Clin Endocrinol Metab 2001;86(12):5755–5761. [DOI] [PubMed] [Google Scholar]
- 28.Lee NK, Sowa H, Hinoi E, et al. Endocrine regulation of energy metabolism by the skeleton. Cell 2007;130(3):456–469. [DOI] [PMC free article] [PubMed] [Google Scholar]
- 29.Cramer C, Freisinger E, Jones RK, et al. Persistent high glucose concentrations alter the regenerative potential of mesenchymal stem cells. Stem Cells Dev 2010;19(12):1875–1884. [DOI] [PubMed] [Google Scholar]
- 30.Lang T, Cauley JA, Tylavsky F, et al. Computed tomographic measurements of thigh muscle cross-sectional area and attenuation coefficient predict hip fracture: the health, aging, and body composition study. J Bone Miner Res 2010;25(3):513–519. [DOI] [PMC free article] [PubMed] [Google Scholar]
- 31.Edwards CJ, Hart DJ, Spector TD. Oral statins and increased bone-mineral density in postmenopausal women. Lancet 2000;355(9222):2218–2219. [DOI] [PubMed] [Google Scholar]
- 32.Wang PS, Solomon DH, Mogun H, Avorn J. HMG-CoA reductase inhibitors and the risk of hip fractures in elderly patients. JAMA 2000;283(24):3211–3216. [DOI] [PubMed] [Google Scholar]
- 33.Adami S, Braga V, Guidi G, Gatti D, Gerardi D, Fracassi E. Chronic intravenous aminobisphosphonate therapy increases high-density lipoprotein cholesterol and decreases low-density lipoprotein cholesterol. J Bone Miner Res 2000;15(3):599–604. [DOI] [PubMed] [Google Scholar]
- 34.Jeong IK, Cho SW, Kim SW, et al. Lipid profiles and bone mineral density in pre- and postmenopausal women in Korea. Calcif Tissue Int 2010;87(6):507–512. [DOI] [PubMed] [Google Scholar]
Associated Data
This section collects any data citations, data availability statements, or supplementary materials included in this article.


