

Abstract
Mov10 and APOBEC3G (A3G) localize to cytoplasmic granules called processing bodies (P bodies), incorporate into human immunodeficiency virus type 1 (HIV-1) virions, and inhibit viral replication. The functional relevance of Mov10/A3G P-body localization to virion incorporation and antiviral activity has not been fully explored. We found that a helicase V mutant of Mov10 exhibits significantly reduced localization to P bodies but still efficiently inhibits viral infectivity via virion incorporation. Disruption of the P bodies by DDX6 knockdown also confirmed Mov10 antiviral activity without P-body localization. In addition, overexpression of SRP19, which binds to 7SL RNA, depleted A3G from P bodies but did not affect its virion incorporation. Sucrose gradient sedimentation assays revealed that the majority of Mov10, A3G, HIV-1 RNA, and Gag formed high-molecular-mass (HMM) complexes that are converted to low-molecular-mass (LMM) complexes after RNase A treatment. In contrast, the P-body markers DCP2, LSM1, eIF4e, DDX6, and AGO1 were in LMM complexes, whereas AGO2, an effector protein of the RNA-induced silencing complex that localizes to P bodies, was present in both LMM and HMM complexes. Depletion of AGO2 indicated that RNA-induced silencing function is required for Mov10's ability to reduce Gag expression upon overexpression, but not its virion incorporation or effect on virus infectivity. We conclude that the majority of Mov10 and A3G are in HMM complexes, whereas most of the P-body markers are in LMM complexes, and that virion incorporation and the antiviral activities of Mov10 and A3G do not require their localization to P bodies.
INTRODUCTION
Human immunodeficiency virus type 1 (HIV-1) requires multiple host proteins for efficient replication and pathogenesis (1–5). Several studies have identified hundreds of host proteins with diverse cellular functions that potentially facilitate or regulate HIV-1 replication (1–4). Recently, several host proteins were identified as restriction factors, including TRIM5α, tetherin/BST-2/CD317, SAMHD1, and the APOBEC3 family of proteins (6–13). Of the APOBEC proteins, APOBEC3G (A3G), APOBEC3F (A3F), APOBEC3DE (A3DE), and some APOBEC3H haplotypes, especially haplotype II (A3H HapII), have been reported to possess anti-HIV activity (6–13). A3F, A3G, A3DE, and A3H HapII are targeted for proteasomal degradation by interaction with the viral infectivity factor (Vif) protein (7, 13–20). In the absence of Vif, the antiviral APOBEC3 proteins expressed in the virus producer cells are incorporated into assembling virions and, after infection of the target cell, mediate deamination of cytidine residues to uridines in nascent minus-strand reverse transcripts. The deamination of cytidines in the minus-strand DNA results in massive G-to-A hypermutation of the plus-strand DNA, causing lethal mutagenesis and inactivation of the virus. A3G and A3F have also been shown to inhibit viral DNA synthesis and integration (21–26).
P bodies are cytoplasmic foci that contain proteins associated with mRNA storage, reversible mRNA repression, and mRNA decay and are thought to accumulate translationally silent mRNAs (27–29). It has been observed that HIV-1 RNA, A3G, and A3F are localized to P bodies (30–32). However, the relationship between HIV-1 replication, A3G/A3F antiviral activities, and P-body localization is not clear. The colocalization of A3G and A3F to P bodies, and some reports of HIV-1 RNA colocalization to P bodies (30–32), suggests that virion incorporation of A3G and A3F involves their interaction with HIV-1 mRNA in P bodies.
MicroRNAs (miRNAs), noncoding RNAs under 22 nucleotides, are also reported to localize to P bodies and assemble into RNA-induced silencing complexes (RISCs) (30, 31). Of these, miRNA-29a represses HIV-1 replication by facilitating the interaction of HIV-1 RNA with the RISC-associated proteins DDX6 and Argonaute 2 (AGO2) (30), indicating that P-body localization is detrimental to HIV-1 replication. Similarly, suppression of various P-body marker proteins by knockdown in virus producer cells, including DDX6, LSM-1, GW182, XRN1, DGCR8, Dicer, and Drosha, has been reported to increase HIV-1 production (30–34).
Localization of A3G/A3F to P bodies prompted us and others to examine whether other P-body-associated proteins are incorporated into virions and exhibit antiviral activity (32, 35, 36). Subsequently, we and others reported that overexpression of the P-body-associated protein Mov10 can inhibit replication of HIV-1 and several other retroviruses, including simian immunodeficiency virus (SIV), murine leukemia virus (MLV), and equine infectious anemia virus (EIAV) (35–37). Mov10 also inhibits the replication of both long terminal repeat (LTR) and non-LTR endogenous retroelements, specifically intracisternal A particles and Alu elements (38–40). Wang et al. demonstrated that other P-body-associated proteins, Drosha, Dicer, AGO1, TRBP, PACT, and eIF6, do not have antiviral activity when overexpressed, while we reported that overexpressed DCP1a and DCP2 are not incorporated into virions and do not inhibit HIV-1 infection (35, 36). Recently, it was reported that AGO2, one of four Argonaute proteins that localizes to P bodies and is a key effector of RISC to control mRNA translation and protein production, incorporates into virions and facilitates viral replication by binding to HIV-1 Gag and unspliced RNA (41). These reports suggested that some specific P-body marker proteins influence HIV-1 infection. Mov10 is a putative RNA helicase and belongs to the DEXD superfamily in the Upf1-like group of helicases (42, 43). Mov10 can inhibit viral replication at multiple stages; it inhibits viral infection by virion incorporation and inhibition of reverse transcription (35–37, 44); in addition, it decreases viral production by reducing Gag expression (35). However, the detailed mechanisms by which Mov10 inhibits Gag expression, incorporates into virions, and inhibits viral replication remain unclear.
In order to elucidate the role of P-body-associated proteins in HIV-1 replication, we focused on Mov10, A3G, A3F, and AGO2 incorporation into HIV-1 virions. We confirmed that Mov10, A3G, and A3F, but not DCP1a, DCP2, and DDX6, are efficiently packaged into virions; however, contrary to a previous report (41), we observed that AGO2 is packaged very inefficiently into HIV-1 particles. In addition, we demonstrated that recruitment of Mov10 and A3G into virions is independent of their P-body localization. Mov10, A3G, and HIV-1 RNAs were present in high-molecular-mass (HMM) complexes in the cytoplasm. However, several other P-body-associated proteins were present only in low-molecular-mass (LMM) complexes, indicating that only a small proportion of these proteins are microscopically colocalized with P-body marker proteins.
MATERIALS AND METHODS
Plasmid construction.
The HIV-1-based vector pHDV-EGFP was previously described and kindly provided by Derya Unutmaz (45). pHCMV-G expresses the vesicular stomatitis virus envelope glycoprotein G (VSV-G) from a human cytomegalovirus promoter (46). pF-Mov10 expresses N-terminally FLAG epitope (DYKDDDDK)-tagged human Mov10 (35); this plasmid is referred to as FLAG-Mov10 below. The N-terminal Venus yellow fluorescent protein (eYFP)-tagged P-body marker expression plasmids eYFP-Mov10, eYFP-DCP1a, eYFP-DCP2, and eYFP-DDX6 were constructed by modification of pYFP-A3G, which was described previously (35, 47). The C-terminally eYFP-tagged P-body marker expression plasmids pA3F-eYFP and pAGO2-eYFP were constructed by modification of pA3G-eYFP, which was described previously (47).
Expression vectors for Mov10 mutants (G527A, S556A, PSNS>4A, DQAG, G681A/D682A, R730A/N731A, V866A, and T911A/R912A) were generated by using a QuikChange XL site-directed mutagenesis kit (Stratagene) to introduce mutations in FLAG-Mov10 and peYFP-Mov10. The N-terminal monomeric red fluorescent protein (mRFP)-tagged DCP2 and DDX6 expression plasmids were constructed by modifying mRFP-A3G, as previously described (35). For visualization of virus particles, the previously described pGagCeFP-BglSL, pGag-BglSL, and pBgl-mCherry were used (48). Briefly, pGagCeFP-BglSL is an HIV-1-based construct that expresses the fusion protein Gag-cerulean fluorescent protein (CeFP) and an RNA that contains sequences recognized by the Escherichia coli BglG protein; pGag-BglSL is similar to pGagCeFP-BglSL, except that it expresses Gag. Plasmid pBgl-mCherry expresses a Bgl-mCherry fusion protein (48).
Cell culture.
Human 293T, HeLa, and TZM-bl cells were maintained in Dulbecco's modified Eagle's medium (DMEM) supplemented with 10% fetal calf serum and penicillin-streptomycin (50 U and 50 μg per ml, respectively). The TZM-bl indicator cell line carries a firefly luciferase reporter gene under the control of the Tat-responsive HIV-1 promoter (49).
Microscopy.
HeLa cells (2.5 × 10⁵ cells per 35-mm glass bottom dish [MatTek]) were cotransfected with the indicated fluorescent fusion plasmids using the FuGeneHD transfection reagent (Roche). Live-cell imaging was performed at 37°C and 5% CO2 at 16 h posttransfection using laser scanning confocal microscopy (Olympus FluoView FV1000 or Carl Zeiss LSM719). For immunostaining assays, HeLa cells (2.0 × 10⁵ cells per 35-mm glass bottom dish [MatTek]) were washed twice with phosphate-buffered saline (PBS) and fixed with 4.0% paraformaldehyde for 15 min. The cells were washed again three times with PBS, permeabilized with 0.25% Triton X-100 for 10 min at room temperature, and blocked for 45 min with PBS containing 0.25% Triton X-100 (PBST) and 3% bovine serum albumin (PBST-BSA). For P-body detection, the cells were first incubated with either an anti-DDX6 (rabbit polyclonal; Bethyl; 1/400) for 1 h. The cells were washed six times with PBST-BSA and incubated with Alexa Fluor 594 anti-rabbit IgG (Molecular Probes; 1/1,000) for 1 h. The cells were washed with PBS, and one drop of Prolong Gold Mounting Medium was added (Invitrogen). Images were acquired using laser scanning confocal microscopy (Carl Zeiss LSM719) and processed using ImageJ software.
Transfection and virus production.
Transfections were carried out with the polyethylenimine (PEI) transfection reagent (Sigma), as previously described (50, 51). Human 293T cells (8 × 10⁵ cells per well in six-well plates) were cotransfected with pHDV-EGFP, pHCMV-G, and FLAG-Mov10 or its mutants. When necessary, the viruses were concentrated up to 100-fold by ultracentrifugation at 100,000 × g for 90 min at 4°C.
Single-virion analysis using fluorescence microscopy.
Single-virion analysis was performed as described previously (48) and used to directly visualize virion incorporation of eYFP-tagged P-body proteins (35). Briefly, 293T cells (4 × 10⁶ cells per 10-cm dish) were cotransfected with pGagCeFP-BglSL (5 μg), pGag-BglSL (5 μg), pBgl-mCherry (5 μg), and the P-body-associated protein expression plasmid pYFP-DCP1a (5 μg), pYFP-DCP2 (5 μg), pYFP-Mov10 (1 μg), pA3G-YFP (1 μg), pA3F-YFP (1 μg), pAGO2-YFP (10 μg), or pYFP-DDX6 (1 μg) using PEI transfection reagent (Sigma). The virus-containing supernatant was harvested at 16 h posttransfection and concentrated up to 20-fold by ultracentrifugation through a 20% sucrose cushion at 25,000 rpm for 90 min at 4°C. The concentrated virus supernatant (0.4 μl) was briefly mixed with 200 μl PBS and then centrifuged onto ibiTreated μ-slides (Ibidi) at 1,200 × g for 1 h. Images of virus-like particles (VLPs) were acquired using epifluorescence microscopy (Nikon). CeFP was used for identification of particles containing CeFP-Gag, mCherry was used to detect HIV-1 RNA, and eYFP was used for detection of P-body proteins. The number, positions, and intensities of the spots were measured for each channel using Localize (52). The positions of the spots were also used to determine colocalization; spots were considered colocalized if the centers of the spots were within 3 pixels of each other. Merged and pseudocolored images were generated using NIS Elements (Nikon). P-body protein incorporation efficiency was calculated by determining the percentage of CeFP+ and mCherry+ particles that contained the eYFP signal by using an in-house MATLAB program (MathWorks). The cells were also collected at 18 h posttransfection and analyzed by immunoblotting.
Virus infectivity.
The virus-containing supernatant was collected 48 h posttransfection and filtered through a 0.45-μm filter, and the amount of p24 capsid (CA) was determined by enzyme-linked immunosorbent assay (ELISA) (XpressBio). Infection of TZM-bl cells (4 × 10³ cells per well in 96-well plates) with virus preparations was performed at multiple dilutions, and luciferase enzyme activity determinations were carried out at 72 h postinfection, as previously described (53). The luciferase activity was normalized by the p24 CA amounts to determine virus titers.
Immunoblotting.
Virus samples and cell lysates were analyzed by sodium dodecyl sulfate-polyacrylamide gel electrophoresis (SDS-PAGE) and immunoblot analysis. Total cell protein concentrations were determined using a Bradford assay (Bio-Rad). The FLAG-tagged proteins were detected using a rabbit anti-FLAG polyclonal antibody (Sigma). p24 CA was detected using a mouse anti-HIV-1 p24 Gag monoclonal antibody (kindly provided by Michael H. Malim, AIDS Research and Reference Reagent Program, Division of AIDS, NIAID, NIH). The Myc-tagged proteins were detected using a mouse anti-c-Myc antibody (Sigma). To verify equivalent input of cell lysates, α-tubulin was also detected using mouse anti-α-tubulin antibody (Sigma). Endogenous Mov10 was detected using a rabbit anti-Mov10 antibody (Novus Biologicals). DCP2, LSM1, eIF4e, DDX6, AGO1, AGO2, and S6 were detected using a goat anti-DCP2 antibody (Santa Cruz), a rabbit anti-LSM1 antibody (Santa Cruz), a mouse anti-eIF4e antibody (Santa Cruz), a rabbit anti-DDX6 antibody (Bethyl), a mouse anti-AGO1 antibody (Sigma), a mouse anti-AGO2 antibody (Wako), and a mouse anti-S6 antibody (Cell signaling), respectively. The primary antibodies were detected using an IRDye 800CW-labeled goat anti-rabbit or IRDye 680-labeled goat anti-mouse secondary antibody (Li-Cor). The signal intensities of the protein bands were calculated using the Odyssey system (Li-Cor).
siRNA-mediated knockdown of DDX6 or AGO2.
For small interfering RNA (siRNA)-mediated knockdown of DDX6 and AGO2, 293T cells (4 × 10⁶ cells per well in 10-cm plates) were transfected with Silencer select DDX6 siRNA (Ambion; S4012) at 25 nM or AGO2 siRNA (Ambion; S25932) at 50 nM using Lipofectamine RNAiMax reagent (Invitrogen). After 24 h, the cells were retransfected with expression plasmids and the siRNAs (25 nM DDX6 or 50 nM AGO2) for single-virion analyses or single-round infection assays by Lipofectamine 2000 reagent (Invitrogen) in order to produce virus and maintain DDX6 or AGO2 knockdown.
Quantitative real-time RT-PCR analysis.
Total RNA was extracted from cells using the RNeasy Minikit (Qiagen), and virus RNA was extracted using the QIAamp Viral RNA Mini Kit (Qiagen) and treated with DNase (Turbo DNA-free kit; Ambion). HIV-1 gag RNA was detected on the Roche LightCycler 480 using the LightCycler 480 RNA master hydrolysis probes reaction mixture (Roche), with forward and reverse primers as previously described (54). Cellular β-actin RNA was detected by using TaqMan Gene Expression Assays (ABI). Briefly, the copy numbers in each sample were adjusted for RNA input by quantification of cellular β-actin RNA copy numbers. 7SL RNA was detected in virions by using forward (GGGCTGTAGTGCGCTATGC) and reverse (CCCGGGAGGTCACCATATT) primers with the specific probe 6-carboxyfluorescein [FAM]-CGGGTGTCCGCACTAAGTTCGGC-6-carboxytetramethylrhodamine [TAMRA], as described previously (55). The copy numbers of incorporated 7SL RNA were adjusted for virus input by quantification of viral gag RNA copy numbers.
Sucrose gradients.
Five layers of 5 to 65% sucrose were prepared in sucrose buffer (20 mM Tris-HCl, pH 7.4, 80 mM NaCl, 5 mM MgCl2, 1 mM dithiothreitol [DTT]) (31) and diffused overnight at 4°C to obtain a linear sucrose gradient. The cytoplasmic extract (2 mg protein), which was made with lysis buffer (50 mM Tris-HCl [pH 7.4] with 150 mM NaCl, 1 mM EDTA, and 1% Triton X-100) containing protease inhibitor cocktail (Roche), was loaded on the top of the gradient and centrifuged for 3 h at 36,000 rpm in a SW41Ti rotor. After ultracentrifugation, 20 fractions were collected from the top of the gradient and subjected to immunoblotting and quantitative real-time reverse transcription (RT)-PCR analysis.
RESULTS
Mov10, A3G, A3F, and AGO2 colocalize with P-body marker proteins.
Mov10, A3G, A3F, and AGO2 have been reported to localize to P bodies and incorporate into HIV-1 virions (32, 35, 41). To confirm the intracellular localization of these proteins to P bodies, we constructed plasmids that expressed each of the proteins with N-terminal or C-terminal fusions to eYFP. We also constructed a plasmid that expressed the P-body marker protein DDX6, which was fused at its N terminus with mRFP (mRFP-DDX6). HeLa cells were cotransfected with mRFP-DDX6 and eYFP-Mov10, A3G-eYFP, A3F-eYFP, or AGO2-eYFP. Confocal microscopy of the transfected live cells at 16 h posttransfection confirmed previous reports indicating that eYFP-Mov10, A3G-eYFP, A3F-eYFP, and AGO2-eYFP colocalized with mRFP-DDX6 in cytoplasmic P bodies (32, 33, 56) (Fig. 1A).
Fig 1.

P-body localization and virion incorporation of Mov10, A3G, A3F, and AGO2. (A) Colocalization of eYFP-Mov10, A3G-eYFP, A3F-eYFP, and AGO2-eYFP with P-body marker protein mRFP-DDX6 was determined in cotransfected HeLa cells. Live cells were visualized at 16 h posttransfection using laser-scanning confocal microscopy. Examples of P bodies showing colocalization of eYFP and mRFP signals are labeled with white arrowheads. Scale bars, 10 μm. (B) Single-virion analysis of eYFP-tagged P-body marker proteins, DCP1a, DCP2, Mov10, A3G, A3F, AGO2, and DDX6. Representative images of virus particles labeled with Gag (CeFP) and HIV-1 RNA (mCherry) are shown. The white arrowheads indicate virus particles containing eYFP signals. The yellow circles and arrowheads indicate virus particles that do not contain eYFP signals. (C) Immunoblotting analysis of cellular expression levels of eYFP-tagged proteins in virus producer cells. Total cell lysates were analyzed using an anti-GFP antibody, and the intensities of bands of the expected size were quantified using the Odyssey system. The amount of protein loaded was normalized using the α-tubulin amounts. (D) Virion incorporation of eYFP-tagged P-body proteins. Packaging efficiency was calculated by determining the percentage of CeFP+ (Gag) plus mCherry+ (HIV-1 RNA) particles that contained the eYFP signal (eYFP-tagged P-body proteins) (top). The average integral intensity per virus particle (CFP+ and mCherry+) was calculated for eYFP (bottom). The number of eYFP+ virus particles and the total particle numbers counted are shown above each sample. The error bars represent the standard deviations for two independent experiments. The asterisks indicate statistically significant decreases compared to A3G-eYFP (white bars; *, P < 0.05; t test).
We next determined the incorporation efficiency of Mov10, A3G, A3F, and AGO2 by using single-virion analysis (35, 48). Viruses were produced from 293T cells that expressed HIV-1 RNAs containing Bgl stem-loops, HIV-1 Gag and Gag-CeFP fusion protein, and Bgl-mCherry, an RNA-binding protein that specifically binds to the Bgl stem-loops, as previously reported (48). The virus particles (VLPs) produced in the presence of expression plasmids for eYFP-tagged P-body markers were analyzed (Fig. 1B). In addition, each of the eYFP-fused P-body marker proteins in the virus producer cells was detected by immunoblotting (Fig. 1C). Although all of the eYFP-fused P-body marker proteins were expressed in the transfected cells, their expression levels varied; eYFP-DCP1a was expressed 33-fold more than A3G-eYFP, and AGO2-eYFP was expressed 42-fold more than eYFP-Mov10. A high proportion of VLPs produced in the presence of eYFP-Mov10, A3G-eYFP, and A3F-eYFP contained the eYFP signal, along with the CeFP and mCherry signals; however, very few VLPs produced in the presence of eYFP-DCP1a, eYFP-DCP2, eYFP-DDX6, and AGO2-eYFP contained the eYFP signal (Fig. 1B). We determined the efficiency with which the P-body proteins were incorporated into VLPs by quantifying the VLPs, defined as the particles that contained all three signals (Fig. 1D, top). The efficiency of eYFP-Mov10, A3G-eYFP, and A3F-eYFP virion incorporation ranged from 71 to 90%, indicating that these proteins were incorporated efficiently. In contrast, the virion incorporation efficiencies of eYFP-DCP1a, eYFP-DCP2, eYFP-DDX6, and AGO2-eYFP were very low, ranging from <1% to 16%. Quantitation of the eYFP intensity of particles that contain both CeFP (HIV-1 Gag) and mCherry (HIV-1 RNA) signals was used to estimate the efficiency of incorporation of P-body marker proteins. Incorporated Mov10, A3G, and A3F resulted in nearly three times higher eYFP intensities than incorporated DCP1a, DCP2, AGO2, and DDX6 (Fig. 1D, bottom), indicating that, in addition to incorporating into a greater proportion of virions, more molecules of Mov10, A3G, and A3F than of the other P-body proteins were incorporated into each viral particle. These results also indicate that, in contrast to a previous report (41), AGO2-eYFP was not efficiently incorporated into virions. AGO2-eYFP was packaged into virions 6.8-fold less efficiently than eYFP-Mov10, even though its cellular expression was 42-fold more than that of eYFP-Mov10, suggesting approximately 285-fold less efficient virion incorporation (Fig. 1C). However, the possibility that this low level of AGO2 packaged into virions is biologically significant cannot be excluded.
Effects of Mov10 and its helicase domain mutants on HIV-1 Gag expression, virus production, and infectivity.
Mov10 is a putative RNA helicase and has seven helicase domains. To determine whether the putative RNA helicase activity of Mov10 is important for its antiviral function, we introduced alanine substitution mutations into all 7 helicase domains (Fig. 2A). Positions that were conserved in an alignment of related UPF1-like helicases were selected for mutagenesis (43). Wild-type FLAG-Mov10 or its mutants were cotransfected into 293T cells with hepatitis D virus-enhanced green fluorescent protein (HDV-EGFP), an HIV-1-based vector. Forty-eight hours after transfection, the cells were lysed and the cellular proteins were analyzed by immunoblotting to detect Mov10, p55 Gag, and α-tubulin, which served as a loading control (Fig. 2B and C). Wild-type Mov10 overexpression decreased p55 Gag expression in virus producer cells, as previously observed (35) (Fig. 2B and C). The reduction in p55 Gag in the presence of exogenous Mov10 was approximately 3.2-fold (31% of the mock transfection control). The decrease in virus production generally correlated with a decrease in p55 Gag expression, suggesting that the decrease in virus production was due to a decrease in the cellular levels of p55 Gag and not due to a defect in virus release (data not shown). Mov10 overexpression also decreased virus infectivity, confirming our previous results (Fig. 2D) (35). The decrease in virus infectivity in the presence of exogenous wild-type Mov10, after normalization for p24 CA levels, was approximately 25-fold (4% of the mock transfection control) (Fig. 2D). Thus, the combined inhibition of Gag expression (3.2-fold) and virus infectivity (25-fold) was approximately 80-fold, confirming that Mov10 is a potent inhibitor of HIV-1 replication.
Fig 2.

Effects of substitution mutations in Mov10 RNA helicase domains on Gag expression, virus production, packaging efficiency, and virus infectivity. (A) Schematic diagram of Mov10 showing seven putative RNA helicase domains labeled I, Ia, II, III, IV, V, and VI. The plus signs indicate the locations of substitution mutations. The amino acid substitutions in each mutant are shown next to each helicase domain. (B) Quantitative immunoblotting analysis of cellular levels of FLAG-Mov10, HIV-1 p55 Gag, and α-tubulin. (C) Relative intensities of the p55 Gag bands normalized using α-tubulin. (D) The effects of helicase domain mutations in Mov10 on viral infectivity were determined by infecting TZM-bl indicator cells with p24 CA-normalized amounts of virus. The infectivity of virus produced from mock-transfected cells was set to 100%, and the relative infectivities of viruses produced in the presence of wild-type or mutant Mov10 are shown. (E) Immunoblotting analysis of virus lysates using anti-FLAG and anti-p24 CA antibodies. Two and 3 μg of FLAG-G527A and S556A mutant plasmids was transfected to generate samples shown in lanes 4 and 5, and 7 and 8, respectively. The packaging efficiency of each Mov10 mutant sample relative to wild-type Mov10 (set to 100%) is shown. (F) Packaging efficiencies of eYFP-tagged Mov10 and its mutants as determined by single-virion analysis. For panels B, E, and F, 1 μg of each Mov10 expression plasmid was used for transfection, except where indicated in panel E. The packaging efficiency was calculated by determining the percentage of CeFP+ (Gag) plus mCherry+ (HIV-1 RNA) particles that contained the eYFP signal (eYFP-tagged P-body proteins) (top). The average integral intensity per virus particle (CeFP+ and mCherry+) was calculated for eYFP (bottom). The number of eYFP+ virus particles and the total particle numbers counted are shown above each sample. For panels C and D, the error bars represent the standard error of the mean (SEM) from three independent experiments. For F, the error bars represent the standard deviation for two independent experiments. The asterisks indicate statistically significant decreases from the control (white bars) (*, P < 0.05; t test).
Overexpression of the helicase domain G527A, S556A, DQAG, V866A, and T911A/R912A mutants reduced the p55 Gag expression in virus producer cells, whereas overexpression of the G681A/D682A and R730A/N731A mutants did not (Fig. 2B and C). A comparison of the infectivity of viruses after normalization for p24 CA levels indicated that the S556A, DQAG, and V866A mutants inhibited virus infectivity almost as well as wild-type Mov10, the G527A mutant inhibited virus infectivity less efficiently than wild-type Mov10, and the G681A/D682A, R730A/N731A, and T911A/R912A mutants did not inhibit virus infectivity (Fig. 2D). Analysis of another mutant in helicase domain Ia, PSNS>4A, indicated that these four substitution mutations had no effect on Mov10's antiviral activity (data not shown). We also compared the effects of FLAG-Mov10 and eYFP-Mov10 overexpression on virus infectivity using the same amounts of plasmid DNA. The results showed that eYFP-Mov10 overexpression inhibited virus infectivity to 5.4% of the control (data not shown), which was very similar to the inhibition observed for the FLAG-Mov10 plasmid (4% of control) (Fig. 2D), indicating that the N-terminal eYFP fusion did not affect Mov10's ability to inhibit virus infectivity.
We next addressed the incorporation efficiency of the Mov10 mutants by immunoblotting and single-virion analysis (Fig. 2E and F). Immunoblotting of virus lysates after normalization for p24 CA indicated that the S556A, DQAG, and V866A mutants were incorporated efficiently (50 to 100%), but the G681A/D682A, R730A/R731A, and T911A/R912A mutants were not (<1 to 16%). The G527A mutant was incorporated less efficiently than wild-type Mov10, but this defect could be overcome by increasing the amount of mutant expression plasmid during transfection. These results were in agreement with the incorporation efficiencies determined by single-virion analysis (Fig. 2F, top). Similar to wild-type Mov10, a high proportion of virions contained eYFP-tagged S556A, DQAG, and V866A mutants and a lower proportion of virions contained G527A, while very few virions contained G681A/D682A, R730A/N731A, and T911A/R912A mutants. The eYFP intensity of particles containing the G527A mutant was significantly lower than that of wild-type Mov10 (Fig. 2F, bottom); thus, even though 40% of the virions contained the G527A mutant, the amount of mutant incorporated per virion was 3-fold lower than wild-type Mov10, which is consistent with the 15% virion incorporation efficiency observed by immunoblotting. Overall, the results indicated that the mutants that had lower efficiencies of virion incorporation were also defective in their ability to inhibit virus infectivity (compare Fig. 2D and F). In addition, these data suggested that the ability of Mov10 or its mutants to reduce p55 Gag expression is independent of their ability to incorporate into virions and inhibit infectivity.
P-body localization of eYFP-Mov10 and its mutants.
To address the relationship between Mov10 localization to P bodies and its incorporation into virions, HeLa cells were cotransfected with plasmids that expressed the P-body marker protein mRFP-DCP2 and eYFP-Mov10 or its mutants. eYFP-Mov10 and most of its mutants were clearly colocalized with mRFP-DCP2; however, R730A/N731A was not colocalized with mRFP-DCP2, and colocalization of V866A with mRFP-DCP2 was substantially reduced (Fig. 3A). Quantification of the P-body localization efficiency of eYFP-Mov10 and its mutants (the proportion of mRFP-DCP2 spots that also contained eYFP signal) showed that less than 1% of the mRFP-DCP2 signals were colocalized with eYFP-R730A/N731A and approximately 20% of the mRFP-DCP2 signals were colocalized with eYFP-V866A (Fig. 3B). Even though the localization of the V886A mutant to P bodies was reduced by more than 4-fold, it maintained the ability to reduce cellular p55 Gag expression, incorporate into virions, and inhibit virus infection (Fig. 2), indicating that the antiviral activity of Mov10 is not dependent on its localization to P bodies. Furthermore, overexpression of eYFP-Mov10 mutants did not affect P-body formation, since the total numbers of mRFP-DCP2-positive cytoplasmic granules per cell remained similar to that for wild-type eYFP-Mov10 (4 ± 1) (Fig. 3B). The R730A/R731A mutant was not localized to P bodies, did not reduce Gag expression (Fig. 2C), and did not inhibit viral replication (Fig. 2D); these results suggest that the mutant is expressed as a misfolded, nonfunctional protein.
Fig 3.

P-body localization of Mov10 and its mutants. The localization of wild-type and mutant eYFP-Mov10 with the P-body marker protein mRFP-DCP2 was determined in cotransfected HeLa cells. Live cells were visualized 16 h posttransfection using laser scanning confocal microscopy. The white arrowheads indicate examples of P bodies showing colocalization of eYFP and mRFP signals; the yellow circles and arrowheads indicate mRFP spots that do not contain eYFP. Scale bar, 10 μm. (B) The percentage of P bodies that contain eYFP-Mov10. The total numbers of P bodies (mRFP-DCP2 spots) and the total number of cells counted in this experiment are shown above each sample. The error bars indicate the SEM from two independent experiments. The asterisks indicate statistically significant differences in P-body localization (*, P < 0.05; t test) compared to wild-type eYFP-Mov10 (white bar).
Role of P bodies in virion incorporation and antiviral activity of Mov10.
We further investigated the role of P bodies in Mov10 virion incorporation and antiviral activity by siRNA knockdown of DDX6, which has been shown to deplete microscopically visible P bodies (57–59). Transfection of HeLa cells with the DDX6 siRNA, but not control siRNA, resulted in substantial reduction in the number of P bodies, as determined by the detection of cytoplasmic granules containing eYFP-Mov10 or eYFP-V866A (Fig. 4A, I). We determined the number of P bodies containing eYFP-Mov10 or eYFP-V866A after control siRNA treatment or after DDX6 knockdown (Fig. 4A, II). As expected from the results in Fig. 3, after treatment with control siRNA, the number of P bodies containing eYFP-V886A was about 20% of those containing wild-type eYFP-Mov10. After DDX6 knockdown, the P bodies containing wild-type eYFP-Mov10 were reduced to 20% compared to treatment with control siRNA, whereas the P bodies containing eYFP-V866A were reduced to 1.4% of the eYFP-Mov10 after control siRNA treatment. We determined that knockdown with DDX6 siRNA was efficient and reduced steady-state levels of DDX6 in cells to ∼9% of the level observed after control siRNA treatment (Fig. 4B).
Fig 4.

Effect of DDX6 knockdown on P-body formation and Mov10 antiviral activity. (A, I) Colocalization of eYFP-Mov10 or eYFP-V866A with endogenous DDX6 after treatment with control siRNA (Ctrl siRNA) or DDX6 siRNA (DDX6 KD). HeLa cells were immunostained with anti-DDX6 antibody (Alexa Fluor 594; red) to detect endogenous DDX6 48 h after transfection with DDX6 siRNA and analyzed by confocal microscopy. Scale bars, 10 μm. Untransfected cells, which did not contain any eYFP signal, are marked by white dotted lines. (A, II) Quantitation of P bodies, as determined by the number of eYFP-Mov10- or eYFP-V866A-containing cytoplasmic puncta. The numbers of eYFP-Mov10-containing or eYFP-V866A-containing puncta per cell are shown after transfection with either control siRNA or DDX6 siRNA. (B) Immunoblotting analysis of 293T cells transfected with a control siRNA or DDX6 siRNA. (C) The packaging efficiency of eYFP-Mov10 and eYFP-V866A mutants produced from cells treated with control siRNA or DDX6 siRNA was determined by single-virion analysis. The packaging efficiency was calculated by determining the percentage of CeFP+ (Gag) plus mCherry+ (HIV-1 RNA) particles that contained the eYFP signal. (D) The effect of DDX6 knockdown on Mov10's ability to inhibit virus infectivity was determined by infecting TZM-bl indicator cells with p24 CA-normalized amounts of virus. The infectivity of virus produced from cells transfected with control siRNA in the absence of any Mov10 expression plasmid (Mock) was set to 100%. Relative infectivities of viruses produced in the presence of eYFP-Mov10 or eYFP-V866A after control siRNA or DDX6 siRNA are shown. For panels A and D, the error bars represent the SEM for two and three independent experiments, respectively. For panel C, the error bars represent the standard deviations from two independent experiments. The asterisks indicate statistically significant differences (*, P < 0.05; t test) compared to control siRNA-treated samples.
We determined the efficiency of virion incorporation of eYFP-Mov10 and eYFP-V866A after control siRNA treatment and after DDX6 knockdown (Fig. 4C). The results showed that even though the localization of the eYFP-V866A mutant to P bodies was reduced to 1.4% of the control after DDX6 knockdown, its virion incorporation was not significantly different from that observed after control siRNA treatment. This result further confirmed that P-body localization of Mov10 is not required for its efficient virion incorporation. We observed that DDX6 knockdown had a slight detrimental effect on virus infectivity compared to control siRNA treatment in the absence of Mov10, as well as in the presence of wild-type eYFP-Mov10 or eYFP-V866A (Fig. 4D). These results suggest either that DDX6 knockdown itself has a slight inhibitory effect on virus infectivity or that DDX6 knockdown slightly increases the antiviral activity of eYFP-Mov10 or eYFP-V866A. Regardless, the results clearly indicate that localization to P bodies is not required for virion incorporation or antiviral activity of wild-type or V866A mutant Mov10.
A3G virion incorporation and localization to P bodies.
We sought to extend our Mov10 studies to A3G and to determine whether P-body localization of A3G is required for its virion incorporation and antiviral activity. A3G incorporation into HIV-1 virions was reported to require the host signal recognition particle (SRP) 7SL RNA (60), although this observation has been controversial (61). We hypothesized that association of A3G with 7SL RNA might influence its P-body localization and virion incorporation. To address these questions, we overexpressed SRP19, which binds to 7SL RNA and was reported to deplete 7SL RNA incorporation into virions (60); SRP19Δ6 is a mutant of SRP19 that is defective in its interaction with 7SL RNA and does not prevent 7SL RNA incorporation into virions. We confirmed that overexpression of SRP19, but not SRP19Δ6, in virion-producing 293T cells depleted 7SL RNA incorporation into virions (Fig. 5A). Next, we determined whether SRP19 and SRP19Δ6 overexpression affected the localization of A3G-eYFP, A3F-eYFP, and eYFP-Mov10 to P bodies; mRFP-DDX6 was coexpressed and used as a P-body marker (Fig. 5B). The proportion of P bodies that contain A3G-eYFP decreased nearly 3-fold when SRP19 was overexpressed (∼12%) compared to when SRP19Δ6 was overexpressed (∼41%) (Fig. 5B and C). Overexpression of SRP19 had no effect on P-body localization of A3F-eYFP or eYFP-Mov10 compared to overexpression of SRP19Δ6 (Fig. 5B and C). These results indicated that depletion of 7SL RNA by overexpression of SRP19 reduced P-body localization of A3G, but not that of A3F or Mov10.
Fig 5.

Effect of A3G localization to P bodies on virion incorporation. (A) Overexpression of SRP19, but not SRP19Δ6, impairs 7SL RNA packaging into HIV-1 virions. Virion-associated 7SL RNA was analyzed by quantitative real-time RT-PCR. The amount of 7SL RNA packaged in HIV-1 virions in the mock-transfected sample, which was adjusted for virus input by determination of the HIV-1 gag RNA copy number, was set to 100%. (B) Effect of SRP19 overexpression on the P-body localization of A3F, A3G, and Mov10. Colocalization of eYFP-tagged A3F, A3G, or Mov10 with the P-body marker protein mRFP-DDX6 was determined in cotransfected HeLa cells. Live cells were visualized 16 h posttransfection using laser scanning confocal microscopy. The white arrowheads indicate examples of P bodies showing colocalization of eYFP and mRFP signals; the yellow circles and arrowheads indicate mRFP spots that do not colocalize with eYFP signals. Scale bar, 10 μm. (C) Effect of SRP19 overexpression on P-body localization of A3F-eYFP, A3G-eYFP, and eYFP-Mov10. P-body localization was determined by calculating the percentage of mRFP-DDX6 spots (P bodies) that contain eYFP signal. The total numbers of P bodies (mRFP-DDX6 spots) and the total number of cells counted in this experiment are shown above each sample. (D) Effects of SRP19 and SRP19Δ6 overexpression on the packaging efficiency of A3F-eYFP, A3G-eYFP, and eYFP-Mov10 as determined by single-virion analysis. The packaging efficiency was calculated by determining the percentage of CeFP+ (Gag) plus mCherry+ (HIV-1 RNA) particles that contained the eYFP signal (eYFP-tagged P-body proteins) (top). The average integral intensity per virus particle (CFP+ and mCherry+) was calculated for eYFP (bottom). For panels A and C, the error bars represent the SEM from three independent experiments. For panel D, the error bars represent the standard deviation for two independent experiments. The asterisks indicate statistically significant differences (*, P < 0.05; t test) in comparison to the SRP19Δ6 controls (C, gray bars) or the mock samples (A and D, white bars).
We also determined the influence of SRP19 and SRP19Δ6 overexpression on virion incorporation of A3F-eYFP, A3G-eYFP, and eYFP-Mov10 by single-virion analysis (Fig. 5D). A high proportion of VLPs produced in the presence A3F-eYFP, A3G-eYFP, and eYFP-Mov10 contained the eYFP signal, along with CeFP (HIV-1 Gag) and mCherry (HIV-1 RNA) signals, regardless of whether SRP19 or SRP19Δ6 was overexpressed (Fig. 5D, top). For example, ∼58% of the VLPs contained A3G-eYFP regardless of whether SRP19 or SRP19Δ6 was overexpressed. In agreement with previous studies (61), these results indicate that 7SL RNA depletion had little or no effect on virion incorporation of A3G-eYFP, A3F-eYFP, or eYFP-Mov10. In addition, overexpression of SRP19 or SRP19Δ6 had little effect on the average eYFP intensity per particle (Fig. 5D, bottom). Since depletion of 7SL RNA reduced A3G localization to P bodies but not its virion incorporation, P-body localization of A3G is not required for its virion incorporation.
Mov10 and A3G are in different cytoplasmic complexes than P-body marker proteins.
A3G has been shown to be predominantly located in cytoplasmic HMM complexes (33, 62, 63). We sought to determine whether Mov10 and A3G are in complexes with other P-body marker proteins and analyzed their distribution by fractionating cytoplasmic cell lysates on sucrose density gradients (Fig. 6A). Cell lysates were prepared from 293T cells that were transfected with HDV-EGFP, HDV-EGFP plus FLAG-Mov10, or FLAG-Mov10 alone. Cell lysates were layered onto sucrose density gradients and fractionated by ultracentrifugation. Twenty fractions were collected, and the contents of each fraction were analyzed by immunoblotting for P-body-associated proteins and other cytoplasmic components. Immunoblotting detection of S6, a ribosomal protein, showed that the polysomes were primarily present in fractions 13 to 17 and peaked in fraction 15 (Fig. 6A, I). The P-body-associated proteins DCP2, LSM1, eIF4e, DDX6, and AGO1 were present in LMM complexes that peaked around fractions 2 to 4; in contrast, AGO2 was present in both LMM and HMM complexes, peaking in fractions 2 to 4 and fractions 13 and 14, respectively (Fig. 6A, II). Interestingly, coexpression of HIV-1 HDV-EGFP increased the proportion of AGO2 in HMM. HIV-1 p55 Gag was also present in LMM and HMM complexes, peaking in fractions 3 and 4 and 15 to 17, respectively (Fig. 6A, III). The distribution of p55 Gag was unaffected by Mov10 overexpression. Overall, these results showed that, with the exception of AGO2, most P-body-associated proteins were absent from HMM complexes and were predominantly present in LMM complexes.
Fig 6.

Analysis of cellular complexes containing P-body proteins by sucrose density gradient fractionation. Sucrose density gradients were generated by using 5% to 65% sucrose. Cytoplasmic extracts from 293T cells transfected with HDV-EGFP, HDV-EGFP plus FLAG-Mov10, or FLAG-Mov10 alone were separated over the gradients by ultracentrifugation and collected in 20 fractions. The proteins in each fraction were analyzed by immunoblotting. The intensities of the protein bands were calculated for each fraction, and the sum of the intensities of all fractions was set to 100%. The percentage of the protein present in each fraction was determined and plotted. (A) (I) Distribution of polysomes by immunoblotting for S6, a ribosomal protein. (II) Distribution of P-body marker proteins DCP2, LSM1 eIF4e, DDX6, AGO1, and AGO2. (III) Distribution of p55 Gag in the absence (blue line) or presence (black line) of FLAG-Mov10. (IV) Distribution of endogenous Mov10 (blue line) or the exogenous FLAG-Mov10 alone (red line) or in the presence of HDV-EGFP (black line). (V) Distribution of p55 Gag in the absence (blue line) or presence of exogenous FLAG-Mov10 after treatment with RNase A. (VI) Distribution of A3G in the presence of HDV-EGFP (blue line) or in the presence of both HDV-EGFP and FLAG-Mov10 (black line). (B) Distribution of FLAG-Mov10 DQAG, V866A, R730A/N731A, and T911A/R912A (I) and G527A, S556A, and G681A/D682A (II) mutants. (C) Distribution of HIV-1 gag RNA in the absence or presence of FLAG-Mov10 or its mutant DQAG or R730A/N731A. (A and B) Total RNAs were extracted from each fraction and quantified by quantitative real-time RT-PCR. The error bars indicate SEM from two independent experiments.
In contrast to most of the other P-body-associated proteins, both endogenous Mov10 and exogenous FLAG-Mov10 were present in HMM complexes; however, endogenous Mov10 was present in slightly smaller complexes, peaking in fractions 13 and 14, whereas exogenous FLAG-Mov10 was present in larger complexes, peaking in fractions 16 and 17 (Fig. 6A, IV). The HMM complexes containing p55 Gag with or without exogenous Mov10 were RNase A sensitive and were converted to LMM complexes upon RNase A treatment (Fig. 6A, V). As previously reported, A3G was also present in HMM complexes in the presence of HDV-EGFP and/or FLAG-Mov10 (Fig. 6A, VI). These results indicated that most of the endogenous or exogenous Mov10 and A3G is present in HMM complexes, whereas most of the P-body-associated proteins are in LMM complexes.
In addition, we determined the distribution of all of the Mov10 mutants described in Fig. 2A by sucrose density gradient centrifugation (Fig. 6B). As shown in Fig. 2F, S556A, DQAG, and V866A mutants were incorporated into virions with nearly wild-type efficiency, whereas the G681A/D682A, R730A/N731A, and T911A/R912A mutants were incorporated with lower efficiency (2.7%, 1.6%, and 32.8% of wild-type Mov10 efficiency, respectively). The sucrose gradient analysis showed that mutants that were efficiently packaged (S556A, DQAG, and V866A) sedimented faster in the gradient, peaking in fraction 17, whereas mutants that were not efficiently packaged (G681A/D682A, R730A/N731A, and T911A/R912A) sedimented more slowly and peaked in fractions 13 and 14. These results suggested differences in the composition of HMM complexes that may contribute to their virion incorporation efficiency.
Finally, we also analyzed the distribution of HIV-1 gag RNA and found that it was distributed throughout the gradient, including in LMM and HMM complexes (Fig. 6C). Interestingly, overexpression of FLAG-Mov10 or the DQAG mutant, which are efficiently packaged, reduced the amount of HIV-1 gag RNA in LMM complexes and increased its amount in the HMM complexes. However, overexpression of the R730A/N731A mutant, which was not efficiently packaged and did not decrease p55 Gag protein levels, did not increase the amount of HIV-1 RNA in HMM complexes. This observation is consistent with the hypothesis that the R730A/N731A mutant is defective in its interaction with HIV-1 RNA and that, as a result, it does not shift HIV-1 RNA to HMM complexes, resulting in its reduced virion incorporation.
Virion incorporation efficiencies of endogenous and exogenous Mov10.
Our sucrose density gradient analysis indicated that endogenous Mov10 peaks in the same fractions as Mov10 mutants (fractions 13 and 14) that exhibit a defect in virion incorporation (Fig. 6). We therefore compared the packaging efficiency of endogenous Mov10 to that of exogenous eYFP-Mov10. eYFP-Mov10 plasmid amounts ranging from 0 to 1,000 ng were transfected into 293T cells, along with HDV-EGFP. Transfection with 50 ng of eYFP-Mov10 plasmid resulted in an expression level that was similar to that of endogenous Mov10 (Fig. 7A, top). In virions produced from these transfected cells, the amounts of eYFP-Mov10 and endogenous Mov10 packaged were similar (Fig. 7A, bottom). Quantitation of the amounts of endogenous Mov10 and exogenous eYFP-Mov10 in cells and virions showed no significant difference in virion incorporation, indicating that the endogenous and exogenous Mov10 are packaged with similar efficiencies (Fig. 7B). Thus, endogenous Mov10 and exogenous Mov10 were packaged with similar efficiencies, even though they exhibited differences in their sedimentation in sucrose density gradients (Fig. 7B).
Fig 7.
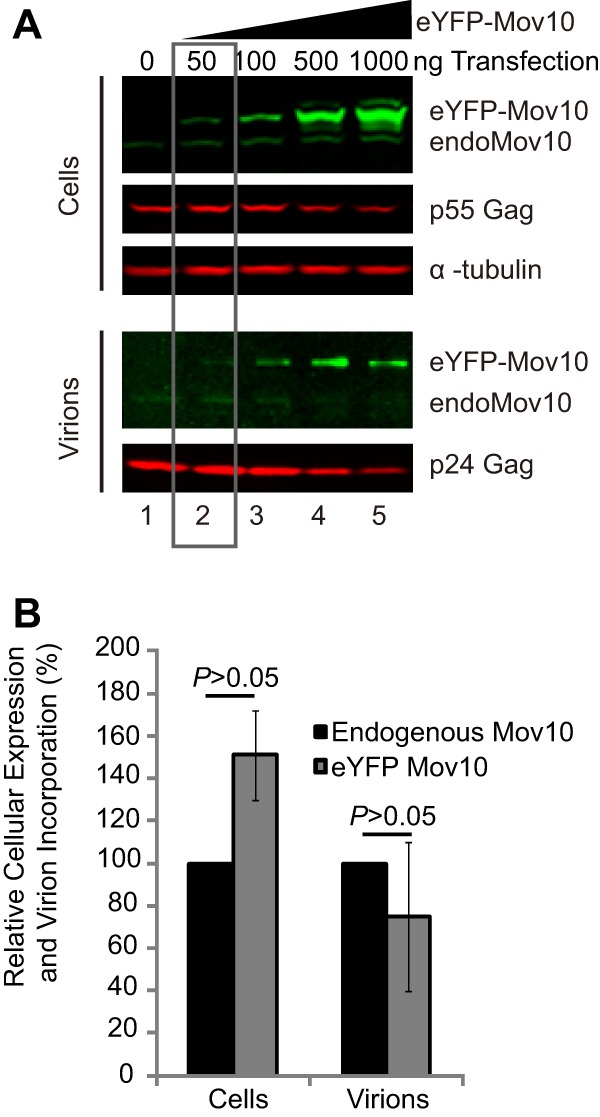
Virion incorporation efficiency of endogenous or exogenous Mov10. Different amounts of eYFP-Mov10 were transfected into 293T cells (0, 50, 100, 500, and 1,000 ng), along with HDV-EGFP. (A) Quantitative immunoblotting analysis of endogenous or exogenous Mov10, p55 Gag in cells or virions, and α-tubulin in cells. (B) Relative intensities of endogenous or exogenous eYFP-Mov10 bands in cells transfected with 50 ng of eYFP-Mov10. The error bars represent the SEM from five independent experiments. There was no statistical difference in the amounts of endogenous and exogenous Mov10 expressed in cells or packaged in virions (P > 0.05; t test).
RISC function is required for Mov10-mediated reduction of Gag expression but not for virion incorporation or inhibition of virus infectivity.
The RISC proteins are associated with P bodies, and Mov10 has been reported to be associated with the RISC (33, 42, 43). In addition, a functional link between P bodies and the ability of miRNAs to repress expression of target mRNAs has been suggested (64). We therefore sought to determine whether a functional RISC is required for overexpression of Mov10 to inhibit Gag expression. To address this question, we used siRNA to knock down endogenous AGO2 expression, an essential element for RISC function, in virus-producing 293T cells (Fig. 8A). The knockdown of AGO2 was efficient; immunoblotting analysis showed that steady-state levels of AGO2 were reduced to 9% of those of the unrelated control siRNA. RISC activity was assessed by determining the ability of an siRNA that targets the luciferase reporter mRNA to reduce luciferase activity (Fig. 8B). In the absence of AGO2 knockdown, the luciferase siRNA efficiently knocked down luciferase activity to 5.7% of that of the control. However, when AGO2 was knocked down, the luciferase siRNA had no significant effect on luciferase activity, indicating that AGO2 knockdown efficiently suppressed RISC function. We then determined whether knockdown of AGO2 affected inhibition of Gag expression by overexpression of Mov10. Compared to the control siRNA, AGO2 siRNA expression diminished Mov10-mediated reduction in Gag expression (Fig. 8C, I, lanes 2 and 5). As expected from a previous study (65), expression of A3G-eYFP also decreased p55 Gag expression; however, A3G-mediated reduction in Gag expression was not affected by AGO2 knockdown (Fig. 8C, I, lanes 3 and 5). The effect of AGO2 knockdown on Gag expression was statistically significant in eYFP-Mov10-expressing cells, but not in mock-transfected or in A3G-eYFP-expressing cells (Fig. 8C, II).
Fig 8.

Effect of AGO2 knockdown on RISC function and Mov10/A3G antiviral activities. (A) Immunoblotting analysis of 293T cells transfected with a control siRNA or an AGO2 siRNA (AGO2 KD). (B) Effect of AGO2 knockdown on RISC function. 293T cells were transfected with either a control siRNA or AGO2 siRNAs; 24 h later, the cells were transfected with luciferase expression plasmid without (−) or with (+) luciferase (Luc) siRNA. Luciferase enzyme activity was measured 24 h after transfection of the luciferase expression plasmid. RLU, relative light units. (C) (I) Quantitative immunoblotting analysis of cellular levels of eYFP-Mov10, A3G-eYFP, AGO2, p55 Gag, and α-tubulin in AGO2 knockdown cells. (II) The relative intensities of the p55 Gag bands were normalized using α-tubulin in cells transfected with control siRNA or AGO2 siRNA. A mock-transfected control with control siRNA treatment was set to 100%. (D) The effect of overexpression of FLAG-Mov10 on the steady-state levels and the rate of degradation of HIV-1 gag RNA was determined 48 h after transfection of 293T cells. (I) The copy numbers of HIV-1 gag RNA in the presence or absence of FLAG-Mov10 were adjusted for RNA input by determination of cellular β-actin RNA copy numbers. (II) Degradation rates of HIV-1 gag RNA in cells that were either mock transfected or transfected with FLAG-Mov10 expression plasmid. The transfected cells were treated with ACT D to inhibit transcription of HIV-1 gag RNA. One set of mock-transfected cells was not treated with ACT D. Total cellular RNA was obtained from treated cells 2, 6, 9, and 12 h after ACT D treatment. The amount of HIV-1 gag RNA present at the time of ACT D treatment (t = 0), adjusted for RNA input by quantification of cellular β-actin RNA copy numbers, was set to 100%. Overexpression of FLAG-Mov10 did not significantly affect the stability of HIV-1 gag RNA compared to the mock-transfected control. (E) The packaging efficiency of eYFP-Mov10 and A3G-eYFP produced from AGO2 knockdown cells was determined by single-virion analysis. Twenty-four hours after transfection with control siRNA or AGO2 siRNA, the cells were transfected with Gag-CeFP, Bgl-mCherry, eYFP-Mov10, or A3G-eYFP; in addition, control or AGO2 siRNAs were included to maintain AGO2 knockdown. The packaging efficiency was calculated by determining the percentage of CeFP+ (Gag) plus mCherry+ (HIV-1 RNA) particles that contained the eYFP signal. (F) The effect of AGO2 knockdown on Mov10's ability to inhibit virus infectivity was determined by infecting TZM-bl indicator cells with p24 CA-normalized amounts of virus. The infectivity of virus produced from mock-transfected cells was set to 100%, and the relative infectivity of viruses produced in the presence of eYFP-Mov10 or A3G-eYFP is shown. For panel F, the error bars represent the standard deviations for two independent experiments. For panels B to E, the error bars represent the SEM from three independent experiments. The asterisks indicate statistically significant differences (*, P < 0.05; t test) compared to control siRNA-treated samples.
To address whether Mov10 reduces Gag expression by inducing degradation of HIV-1 Gag RNA via RISC function, we transfected FLAG-Mov10 and HDV-EGFP into 293T cells in the presence or absence of the transcription inhibitor actinomycin D (ACT D). We then monitored HIV-1 gag RNA using real-time qRT-PCR from 0 to 12 h after treatment with ACT D. The results showed that gag RNA steady-state levels (Fig. 8D, I) or gag RNA stability (Fig. 8D, II) was not altered by expression of FLAG-Mov10 or the DQAG mutant of Mov10. Overall, these results suggest that Mov10 overexpression results in translational repression of HIV-1 Gag and that AGO2 and/or RISC function is required to induce this translational repression. Alternatively, Mov10 overexpression may also increase the rate of degradation of p55 Gag, resulting in reduced steady-state levels.
We also determined the effect of AGO2 knockdown on virion incorporation of eYFP-Mov10 by single-virion analysis (Fig. 8E) and on the ability of Mov10 overexpression to reduce virus infectivity (Fig. 8F). The results indicated that inhibiting RISC function had no effect on Mov10 virion incorporation. As expected from previous studies (30, 59), AGO2 knockdown alone increased virus infectivity approximately 2.5-fold; however, AGO2 knockdown did not significantly influence the ability of Mov10 or A3G to inhibit virus infectivity (Fig. 8F).
DISCUSSION
The antiviral activities of Mov10, A3G, and A3F have been well documented; however, many questions remain regarding their cellular functions and potential cellular cofactors and the mechanisms that may regulate their virion incorporation and antiviral activity. Mov10, A3G, and A3F are all microscopically localized to P bodies, which contain proteins associated with mRNA-processing events, such as decapping, 5′ exonucleolytic degradation, and RNA-induced silencing. In these studies, we explored the relationship of Mov10, A3G, and A3F with P bodies to gain insights into the antiviral activities, as well as the potential cellular functions, of these proteins. The results of our studies show that there are significant differences in the cytoplasmic complexes and behavior of Mov10, A3G, A3F, and other P-body-associated proteins. First, the other P-body-associated proteins are either not incorporated into virions or are incorporated with very low efficiency compared to these antiviral proteins (Fig. 1). Second, Mov10, A3G, and A3F are in HMM complexes, whereas most of the P-body-associated proteins are present in LMM complexes (Fig. 6). Thus, Mov10, A3G, and A3F are in different RNA-protein complexes than most of the other P-body-associated proteins, even though they are colocalized with P bodies in microscopy studies.
Our analysis of Mov10 mutants indicated that the mutations in helicase domains I, Ia, II, and V had no effect on Mov10's ability to inhibit virus infectivity, whereas mutations in helicase domains III, IV, and VI failed to inhibit virus infectivity. The helicase V mutant V866A did not efficiently localize to P bodies but reduced Gag expression in the virus producer cells, incorporated efficiently into virions, and inhibited virus infectivity, indicating that P-body localization is not essential for Mov10 virion incorporation and antiviral activity (Fig. 2 and 3). Furthermore, when combined with knockdown of DDX6, the P-body localization of V866A was reduced to 1.4% of that of the control eYFP-Mov10 in the absence of DDX6 knockdown (Fig. 4); despite this severely reduced localization to P bodies, the mutant was efficiently incorporated into virions and potently inhibited viral replication, indicating that P-body localization of Mov10 is not required for its virion incorporation and antiviral activity.
These observations were extended to A3G in experiments in which we depleted 7SL RNA from virions by overexpression of SRP19, which resulted in depletion of A3G, but not A3F or Mov10, from P bodies. This depletion of A3G from P bodies had no effect on A3G virion incorporation, indicating that A3G localization to P bodies is also not essential for its virion incorporation (Fig. 5). It is intriguing that overexpression of SRP19 results in depletion of A3G (but not Mov10 or A3F) from P bodies, suggesting that the association of A3G with P bodies may be dependent on the presence of 7SL RNA. Additional studies are needed to investigate the interactions between 7SL RNA and A3G and why this association seems to be critical for the localization of A3G to P bodies. These observations are consistent with a recent report in which the authors depleted the P-body components DDX6 and LSM1, which are essential for P-body formation, and found that virion incorporation and the antiviral activity of A3G were independent of P-body localization (59).
Wang et al. previously analyzed Mov10 helicase domain mutants and reported that a helicase V mutant retained Mov10's antiviral activity (36), which is consistent with our results showing that the V866A mutant was incorporated into virions and inhibited viral infectivity. However, they concluded that mutations in all other helicase domains abrogated Mov10's antiviral activity, whereas our results indicated that only mutations in helicase domains III, IV, and VI diminished Mov10's antiviral activity. Goodier et al. (40) recently examined the same helicase domain mutants analyzed by Wang et al. and determined their effects on retrotransposition, which are in general agreement with our results. However, some differences in Mov10's antiviral and antiretrotransposition activities were noted; for example, a helicase domain II mutant lost antiretrotransposition activity but retained antiviral activity. These differences in our observations may also be due to differences in the specific amino acids that were mutated and analyzed.
We observed that knockdown of AGO2, which almost completely abolished RISC function, diminished Mov10's ability to reduce HIV-1 Gag expression. Mov10 did not reduce HIV-1 gag RNA levels or the turnover rate of HIV-1 gag RNA, suggesting that it reduces Gag expression through translational suppression. Since AGO2 knockdown diminished Mov10-mediated suppression of HIV-1 Gag, the results suggest that a complex containing AGO2 and Mov10 may be involved in Gag translational suppression. Mov10 is thought to be a component of RISCs and to participate in gene silencing during assembly and maturation of RISCs containing AGO2 (42, 66). In addition, A3G significantly inhibits miRNA-mediated repression of translation (66), suggesting an association with RISCs. Thus, our results and conclusions are consistent with previous reports indicating that Mov10 is a component of the RISC and has been reported to be involved in translational suppression (66). However, we cannot exclude the possibility that Mov10 overexpression reduces p55 Gag levels by increasing its rate of degradation.
We also observed that AGO2 knockdown had no effect on virion incorporation of Mov10 and A3G or their ability to inhibit virus infectivity. These observations are consistent with our finding that AGO2 was not efficiently packaged into virions (Fig. 1) and suggest that RISC function does not play a role in Mov10's ability to inhibit virus infectivity after virion incorporation.
The results of our studies showed that Mov10 and A3G are primarily in HMM complexes. A3G was previously shown to be present in HMM complexes, and Mov10 was previously shown to be an RNA-binding protein that can coimmunoprecipitate with A3G in an RNA-dependent manner (33, 63, 67). We therefore expected Mov10 and A3G to be in HMM complexes; however, we were surprised that five of six P-body-associated proteins analyzed were almost exclusively present in LMM complexes. The only exception was AGO2, which was present in both LMM and HMM complexes. Consistent with these observations, Chiu et al. previously reported that DDX6 and AGO2 were not detected in the purified NTAP-A3G complexes and the majority of DDX6 was present in LMM complexes (62). On the other hand, Reed et al. indicated that HIV-1 Gag-containing protein complexes, referred to as assembly intermediates containing the cellular ATPase ABCE1, also contain AGO2 and DDX6 (68). However, they were unable to detect significant amounts of DDX6 and AGO2 in virions and suggested that AGO2 and DDX6 are released upon formation of completed capsids. Our observations with single-virion analysis (Fig. 1) confirm that DDX6 and AGO2 are not efficiently packaged into virions, and our sucrose gradient sedimentation assays (Fig. 6) confirm that AGO2 is detected in HMM fractions that contain HIV-1 Gag; however, we did not detect significant amounts of DDX6 in HMM complexes containing HIV-1 Gag. Liu et al. also reported that in the absence of A3G, Mov10 can interact with AGO2, but A3G interferes with the interaction between Mov10 and AGO2 (66). These findings suggested that HMM containing A3G or AGO2 is different and Mov10 might exist in HMMs containing A3G or AGO2. These observations suggested that despite their colocalization using fluorescence microscopy, most of the Mov10 and A3G proteins might reside in different protein-RNA complexes than P-body-associated proteins, and perhaps only a small proportion of the Mov10-A3G complexes are associated with P bodies in cells.
As expected from previous studies, Mov10 and A3G HMM complexes were converted to LMM complexes upon treatment with RNase A (62), indicating that these complexes are dependent on intact RNA. Our analysis indicated that HIV-1 Gag was also present in RNase A-sensitive HMM complexes. Interestingly, HIV-1 gag RNA was broadly distributed throughout the sucrose gradient, and the proportion of HIV-1 gag RNA present in HMM complexes increased upon overexpression of Mov10. We previously showed that HIV-1 RNA could be coimmunoprecipitated with FLAG-Mov10 (35). These results are consistent with the hypothesis that Mov10, HIV-1 RNA, and p55 Gag are in the same HMM complexes; however, it is possible that Mov10 indirectly affects the migration of HIV-1 RNA from LMM to HMM complexes.
We noted that HMM complexes containing the Mov10 S556A, DQAG, and V866A mutants, which are incorporated as efficiently as wild-type Mov10, sedimented faster in the sucrose gradient than the HMM complexes containing endogenous Mov10, AGO2, and packaging-defective Mov10 G681A/D682A, R730A/N731A, and T911A/R912A mutants (Fig. 6B). This suggests differences in the compositions of proteins and/or RNA in these different HMM complexes, which may be responsible for the inefficient virion incorporation of the R730A/N731A and T911A/R912A mutants. Because endogenous Mov10 is in the same fractions as the packaging-defective Mov10 mutants, we compared the packaging efficiencies of endogenous and exogenous Mov10 and found that they were packaged with nearly equal efficiency (Fig. 7B). These data are consistent with the idea that the HMM complexes containing endogenous and exogenous Mov10, although distinct in their sedimentation in sucrose gradients, contain the proteins and/or RNA that mediate their efficient incorporation into virions. Additional studies are needed to identify the protein and RNA contents of these HMM complexes that are responsible for the virion incorporation of Mov10 and A3G. Interestingly, expression of wild-type Mov10 or the DQAG mutant, which are packaged efficiently, shifted some of the HIV-1 RNA from LMM complexes to HMM complexes; however, the R730A/N731A mutant, which is defective in virion incorporation, did not alter the migration of HIV-1 RNA to HMM complexes, consistent with the hypothesis that a defect in interaction with HIV-1 RNA may contribute to its packaging defect (Fig. 6C).
In summary, Mov10 and A3G are primarily in HMM ribonucleoprotein complexes, whereas most of the other P-body-associated proteins are in LMM complexes, suggesting that microscopic colocalization of Mov10 and A3G to P bodies may represent a small proportion of these proteins in cells. In addition, analysis of Mov10 mutants and siRNA knockdown of DDX6 or AGO2 indicates that P-body localization and RISC function are not required for Mov10 virion incorporation and the inhibition of virus infectivity but RISC function is required for Mov10-mediated repression of HIV-1 Gag expression. Future studies that identify the composition of the HMM complexes containing Mov10 and A3G may provide valuable insights into their efficient virion incorporation, antiviral activities, and potential cellular functions.
ACKNOWLEDGMENTS
We thank Luca Sardo, Kari A. Dilley, Jessica L. Smith, and Narasimhan J. Venkatachari for their generous help with these studies. We also thank Belete A. Desimmie and Eric O. Freed for valuable input during manuscript preparation.
This research was supported in part by the Intramural Research Program of the NIH, National Cancer Institute, Center for Cancer Research. T.I. was supported by a JSPS Research Fellowship for Japanese Biomedical and Behavioral Researchers at NIH.
The content of this publication does not necessarily reflect the views or policies of the Department of Health and Human Services nor does mention of trade names, commercial products, or organizations imply endorsement by the U.S. government.
Footnotes
Published ahead of print 7 August 2013
REFERENCES
- 1.Brass AL, Dykxhoorn DM, Benita Y, Yan N, Engelman A, Xavier RJ, Lieberman J, Elledge SJ. 2008. Identification of host proteins required for HIV infection through a functional genomic screen. Science 319:921–926. [DOI] [PubMed] [Google Scholar]
- 2.Yeung ML, Houzet L, Yedavalli VS, Jeang KT. 2009. A genome-wide short hairpin RNA screening of Jurkat T-cells for human proteins contributing to productive HIV-1 replication. J. Biol. Chem. 284:19463–19473. [DOI] [PMC free article] [PubMed] [Google Scholar]
- 3.Zhou H, Xu M, Huang Q, Gates AT, Zhang XD, Castle JC, Stec E, Ferrer M, Strulovici B, Hazuda DJ, Espeseth AS. 2008. Genome-scale RNAi screen for host factors required for HIV replication. Cell Host Microbe 4:495–504. [DOI] [PubMed] [Google Scholar]
- 4.König R, Zhou Y, Elleder D, Diamond TL, Bonamy GM, Irelan JT, Chiang CY, Tu BP, De Jesus PD, Lilley CE, Seidel S, Opaluch AM, Caldwell JS, Weitzman MD, Kuhen KL, Bandyopadhyay S, Ideker T, Orth AP, Miraglia LJ, Bushman FD, Young JA, Chanda SK. 2008. Global analysis of host-pathogen interactions that regulate early-stage HIV-1 replication. Cell 135:49–60. [DOI] [PMC free article] [PubMed] [Google Scholar]
- 5.Frankel AD, Young JA. 1998. HIV-1: fifteen proteins and an RNA. Annu. Rev. Biochem. 67:1–25. [DOI] [PubMed] [Google Scholar]
- 6.Sayah DM, Sokolskaja E, Berthoux L, Luban J. 2004. Cyclophilin A retrotransposition into TRIM5 explains owl monkey resistance to HIV-1. Nature 430:569–573. [DOI] [PubMed] [Google Scholar]
- 7.Sheehy AM, Gaddis NC, Choi JD, Malim MH. 2002. Isolation of a human gene that inhibits HIV-1 infection and is suppressed by the viral Vif protein. Nature 418:646–650. [DOI] [PubMed] [Google Scholar]
- 8.Stremlau M, Owens CM, Perron MJ, Kiessling M, Autissier P, Sodroski J. 2004. The cytoplasmic body component TRIM5alpha restricts HIV-1 infection in Old World monkeys. Nature 427:848–853. [DOI] [PubMed] [Google Scholar]
- 9.Van Damme N, Goff D, Katsura C, Jorgenson RL, Mitchell R, Johnson MC, Stephens EB, Guatelli J. 2008. The interferon-induced protein BST-2 restricts HIV-1 release and is downregulated from the cell surface by the viral Vpu protein. Cell Host Microbe 3:245–252. [DOI] [PMC free article] [PubMed] [Google Scholar]
- 10.Zheng YH, Irwin D, Kurosu T, Tokunaga K, Sata T, Peterlin BM. 2004. Human APOBEC3F is another host factor that blocks human immunodeficiency virus type 1 replication. J. Virol. 78:6073–6076. [DOI] [PMC free article] [PubMed] [Google Scholar]
- 11.Dang Y, Wang X, Esselman WJ, Zheng YH. 2006. Identification of APOBEC3DE as another antiretroviral factor from the human APOBEC family. J. Virol. 80:10522–10533. [DOI] [PMC free article] [PubMed] [Google Scholar]
- 12.OhAinle M, Kerns JA, Malik HS, Emerman M. 2006. Adaptive evolution and antiviral activity of the conserved mammalian cytidine deaminase APOBEC3H. J. Virol. 80:3853–3862. [DOI] [PMC free article] [PubMed] [Google Scholar]
- 13.Laguette N, Sobhian B, Casartelli N, Ringeard M, Chable-Bessia C, Ségéral E, Yatim A, Emiliani S, Schwartz O, Benkirane M. 2011. SAMHD1 is the dendritic- and myeloid-cell-specific HIV-1 restriction factor counteracted by Vpx. Nature 474:654–657. [DOI] [PMC free article] [PubMed] [Google Scholar]
- 14.Bishop KN, Holmes RK, Sheehy AM, Davidson NO, Cho SJ, Malim MH. 2004. Cytidine deamination of retroviral DNA by diverse APOBEC proteins. Curr. Biol. 14:1392–1396. [DOI] [PubMed] [Google Scholar]
- 15.Hultquist JF, Lengyel JA, Refsland EW, LaRue RS, Lackey L, Brown WL, Harris RS. 2011. Human and rhesus APOBEC3D, APOBEC3F, APOBEC3G, and APOBEC3H demonstrate a conserved capacity to restrict Vif-deficient HIV-1. J. Virol. 85:11220–11234. [DOI] [PMC free article] [PubMed] [Google Scholar]
- 16.OhAinle M, Kerns JA, Li MM, Malik HS, Emerman M. 2008. Antiretroelement activity of APOBEC3H was lost twice in recent human evolution. Cell Host Microbe 4:249–259. [DOI] [PMC free article] [PubMed] [Google Scholar]
- 17.Wiegand HL, Doehle BP, Bogerd HP, Cullen BR. 2004. A second human antiretroviral factor, APOBEC3F, is suppressed by the HIV-1 and HIV-2 Vif proteins. EMBO J. 23:2451–2458. [DOI] [PMC free article] [PubMed] [Google Scholar]
- 18.Shirakawa K, Takaori-Kondo A, Yokoyama M, Izumi T, Matsui M, Io K, Sato T, Sato H, Uchiyama T. 2008. Phosphorylation of APOBEC3G by protein kinase A regulates its interaction with HIV-1 Vif. Nat. Struct. Mol. Biol. 15:1184–1191. [DOI] [PubMed] [Google Scholar]
- 19.Izumi T, Io K, Matsui M, Shirakawa K, Shinohara M, Nagai Y, Kawahara M, Kobayashi M, Kondoh H, Misawa N, Koyanagi Y, Uchiyama T, Takaori-Kondo A. 2010. HIV-1 viral infectivity factor interacts with TP53 to induce G2 cell cycle arrest and positively regulate viral replication. Proc. Natl. Acad. Sci. U. S. A. 107:20798–20803. [DOI] [PMC free article] [PubMed] [Google Scholar]
- 20.Yu X, Yu Y, Liu B, Luo K, Kong W, Mao P, Yu XF. 2003. Induction of APOBEC3G ubiquitination and degradation by an HIV-1 Vif-Cul5-SCF complex. Science 302:1056–1060. [DOI] [PubMed] [Google Scholar]
- 21.Mbisa JL, Bu W, Pathak VK. 2010. APOBEC3F and APOBEC3G inhibit HIV-1 DNA integration by different mechanisms. J. Virol. 84:5250–5259. [DOI] [PMC free article] [PubMed] [Google Scholar]
- 22.Bishop KN, Verma M, Kim EY, Wolinsky SM, Malim MH. 2008. APOBEC3G inhibits elongation of HIV-1 reverse transcripts. PLoS Pathog. 4:e1000231. 10.1371/journal.ppat.1000231. [DOI] [PMC free article] [PubMed] [Google Scholar]
- 23.Iwatani Y, Chan DS, Wang F, Maynard KS, Sugiura W, Gronenborn AM, Rouzina I, Williams MC, Musier-Forsyth K, Levin JG. 2007. Deaminase-independent inhibition of HIV-1 reverse transcription by APOBEC3G. Nucleic Acids Res. 35:7096–7108. [DOI] [PMC free article] [PubMed] [Google Scholar]
- 24.Izumi T, Shirakawa K, Takaori-Kondo A. 2008. Cytidine deaminases as a weapon against retroviruses and a new target for antiviral therapy. Mini Rev. Med. Chem. 8:231–238. [DOI] [PubMed] [Google Scholar]
- 25.Mbisa JL, Barr R, Thomas JA, Vandegraaff N, Dorweiler IJ, Svarovskaia ES, Brown WL, Mansky LM, Gorelick RJ, Harris RS, Engelman A, Pathak VK. 2007. Human immunodeficiency virus type 1 cDNAs produced in the presence of APOBEC3G exhibit defects in plus-strand DNA transfer and integration. J. Virol. 81:7099–7110. [DOI] [PMC free article] [PubMed] [Google Scholar]
- 26.Luo K, Wang T, Liu B, Tian C, Xiao Z, Kappes J, Yu XF. 2007. Cytidine deaminases APOBEC3G and APOBEC3F interact with human immunodeficiency virus type 1 integrase and inhibit proviral DNA formation. J. Virol. 81:7238–7248. [DOI] [PMC free article] [PubMed] [Google Scholar]
- 27.Chan SP, Slack FJ. 2006. microRNA-mediated silencing inside P-bodies. RNA Biol. 3:97–100. [DOI] [PubMed] [Google Scholar]
- 28.Fillman C, Lykke-Andersen J. 2005. RNA decapping inside and outside of processing bodies. Curr. Opin. Cell Biol. 17:326–331. [DOI] [PubMed] [Google Scholar]
- 29.Liu J, Rivas FV, Wohlschlegel J, Yates JR, Parker R, Hannon GJ. 2005. A role for the P-body component GW182 in microRNA function. Nat. Cell Biol. 7:1261–1266. [DOI] [PMC free article] [PubMed] [Google Scholar]
- 30.Nathans R, Chu CY, Serquina AK, Lu CC, Cao H, Rana TM. 2009. Cellular microRNA and P bodies modulate host-HIV-1 interactions. Mol. Cell 34:696–709. [DOI] [PMC free article] [PubMed] [Google Scholar]
- 31.Chable-Bessia C, Meziane O, Latreille D, Triboulet R, Zamborlini A, Wagschal A, Jacquet JM, Reynes J, Levy Y, Saib A, Bennasser Y, Benkirane M. 2009. Suppression of HIV-1 replication by microRNA effectors. Retrovirology 6:26. [DOI] [PMC free article] [PubMed] [Google Scholar]
- 32.Wichroski MJ, Robb GB, Rana TM. 2006. Human retroviral host restriction factors APOBEC3G and APOBEC3F localize to mRNA processing bodies. PLoS Pathog. 2:e41. 10.1371/journal.ppat.0020041. [DOI] [PMC free article] [PubMed] [Google Scholar]
- 33.Gallois-Montbrun S, Kramer B, Swanson CM, Byers H, Lynham S, Ward M, Malim MH. 2007. Antiviral protein APOBEC3G localizes to ribonucleoprotein complexes found in P bodies and stress granules. J. Virol. 81:2165–2178. [DOI] [PMC free article] [PubMed] [Google Scholar]
- 34.Wang T, Tian C, Zhang W, Sarkis PT, Yu XF. 2008. Interaction with 7SL RNA but not with HIV-1 genomic RNA or P bodies is required for APOBEC3F virion packaging. J. Mol. Biol. 375:1098–1112. [DOI] [PubMed] [Google Scholar]
- 35.Burdick R, Smith JL, Chaipan C, Friew Y, Chen J, Venkatachari NJ, Delviks-Frankenberry KA, Hu WS, Pathak VK. 2010. P body-associated protein Mov10 inhibits HIV-1 replication at multiple stages. J. Virol. 84:10241–10253. [DOI] [PMC free article] [PubMed] [Google Scholar]
- 36.Wang X, Han Y, Dang Y, Fu W, Zhou T, Ptak RG, Zheng YH. 2010. Moloney leukemia virus 10 (MOV10) protein inhibits retrovirus replication. J. Biol. Chem. 285:14346–14355. [DOI] [PMC free article] [PubMed] [Google Scholar]
- 37.Furtak V, Mulky A, Rawlings SA, Kozhaya L, Lee K, Kewalramani VN, Unutmaz D. 2010. Perturbation of the P-body component Mov10 inhibits HIV-1 infectivity. PLoS One 5:e9081. 10.1371/journal.pone.0009081. [DOI] [PMC free article] [PubMed] [Google Scholar]
- 38.Arjan-Odedra S, Swanson CM, Sherer NM, Wolinsky SM, Malim MH. 2012. Endogenous MOV10 inhibits the retrotransposition of endogenous retroelements but not the replication of exogenous retroviruses. Retrovirology 9:53. [DOI] [PMC free article] [PubMed] [Google Scholar]
- 39.Lu C, Luo Z, Jäger S, Krogan NJ, Peterlin BM. 2012. Moloney leukemia virus type 10 inhibits reverse transcription and retrotransposition of intracisternal a particles. J. Virol. 86:10517–10523. [DOI] [PMC free article] [PubMed] [Google Scholar]
- 40.Goodier JL, Cheung LE, Kazazian HH. 2012. MOV10 RNA helicase is a potent inhibitor of retrotransposition in cells. PLoS Genet. 8:e1002941. 10.1371/journal.pgen.1002941. [DOI] [PMC free article] [PubMed] [Google Scholar]
- 41.Bouttier M, Saumet A, Peter M, Courgnaud V, Schmidt U, Cazevieille C, Bertrand E, Lecellier CH. 2012. Retroviral GAG proteins recruit AGO2 on viral RNAs without affecting RNA accumulation and translation. Nucleic Acids Res. 40:775–786. [DOI] [PMC free article] [PubMed] [Google Scholar]
- 42.Meister G, Landthaler M, Peters L, Chen PY, Urlaub H, Lührmann R, Tuschl T. 2005. Identification of novel argonaute-associated proteins. Curr. Biol. 15:2149–2155. [DOI] [PubMed] [Google Scholar]
- 43.Fairman-Williams ME, Guenther UP, Jankowsky E. 2010. SF1 and SF2 helicases: family matters. Curr. Opin. Struct. Biol. 20:313–324. [DOI] [PMC free article] [PubMed] [Google Scholar]
- 44.Abudu A, Wang X, Dang Y, Zhou T, Xiang SH, Zheng YH. 2012. Identification of molecular determinants from Moloney Leukemia virus 10 homolog (MOV10) protein for virion packaging and anti-human immunodeficiency virus type 1 (HIV-1) activity. J. Biol. Chem. 287:1220–1228. [DOI] [PMC free article] [PubMed] [Google Scholar]
- 45.Unutmaz D, KewalRamani VN, Marmon S, Littman DR. 1999. Cytokine signals are sufficient for HIV-1 infection of resting human T lymphocytes. J. Exp. Med. 189:1735–1746. [DOI] [PMC free article] [PubMed] [Google Scholar]
- 46.Yee JK, Friedmann T, Burns JC. 1994. Generation of high-titer pseudotyped retroviral vectors with very broad host range. Methods Cell Biol. 43:99–112. [DOI] [PubMed] [Google Scholar]
- 47.Friew YN, Boyko V, Hu WS, Pathak VK. 2009. Intracellular interactions between APOBEC3G, RNA, and HIV-1 Gag: APOBEC3G multimerization is dependent on its association with RNA. Retrovirology 6:56. [DOI] [PMC free article] [PubMed] [Google Scholar]
- 48.Chen J, Nikolaitchik O, Singh J, Wright A, Bencsics CE, Coffin JM, Ni N, Lockett S, Pathak VK, Hu WS. 2009. High efficiency of HIV-1 genomic RNA packaging and heterozygote formation revealed by single virion analysis. Proc. Natl. Acad. Sci. U. S. A. 106:13535–13540. [DOI] [PMC free article] [PubMed] [Google Scholar]
- 49.Wei X, Decker JM, Liu H, Zhang Z, Arani RB, Kilby JM, Saag MS, Wu X, Shaw GM, Kappes JC. 2002. Emergence of resistant human immunodeficiency virus type 1 in patients receiving fusion inhibitor (T-20) monotherapy. Antimicrob. Agents Chemother. 46:1896–1905. [DOI] [PMC free article] [PubMed] [Google Scholar]
- 50.Boussif O, Lezoualc'h F, Zanta MA, Mergny MD, Scherman D, Demeneix B, Behr JP. 1995. A versatile vector for gene and oligonucleotide transfer into cells in culture and in vivo: polyethylenimine. Proc. Natl. Acad. Sci. U. S. A. 92:7297–7301. [DOI] [PMC free article] [PubMed] [Google Scholar]
- 51.Russell RA, Moore MD, Hu WS, Pathak VK. 2009. APOBEC3G induces a hypermutation gradient: purifying selection at multiple steps during HIV-1 replication results in levels of G-to-A mutations that are high in DNA, intermediate in cellular viral RNA, and low in virion RNA. Retrovirology 6:16. [DOI] [PMC free article] [PubMed] [Google Scholar]
- 52.Zenklusen D, Larson DR, Singer RH. 2008. Single-RNA counting reveals alternative modes of gene expression in yeast. Nat. Struct. Mol. Biol. 15:1263–1271. [DOI] [PMC free article] [PubMed] [Google Scholar]
- 53.Russell RA, Pathak VK. 2007. Identification of two distinct human immunodeficiency virus type 1 Vif determinants critical for interactions with human APOBEC3G and APOBEC3F. J. Virol. 81:8201–8210. [DOI] [PMC free article] [PubMed] [Google Scholar]
- 54.Mbisa JL, Delviks-Frankenberry KA, Thomas JA, Gorelick RJ, Pathak VK. 2009. Real-time PCR analysis of HIV-1 replication post-entry events. Methods Mol. Biol. 485:55–72. [DOI] [PMC free article] [PubMed] [Google Scholar]
- 55.Onafuwa-Nuga AA, Telesnitsky A, King SR. 2006. 7SL RNA, but not the 54-kd signal recognition particle protein, is an abundant component of both infectious HIV-1 and minimal virus-like particles. RNA 12:542–546. [DOI] [PMC free article] [PubMed] [Google Scholar]
- 56.Höck J, Meister G. 2008. The Argonaute protein family. Genome Biol. 9:210. [DOI] [PMC free article] [PubMed] [Google Scholar]
- 57.Cougot N, Babajko S, Seraphin B. 2004. Cytoplasmic foci are sites of mRNA decay in human cells. J. Cell Biol. 165:31–40. [DOI] [PMC free article] [PubMed] [Google Scholar]
- 58.Chu CY, Rana TM. 2006. Translation repression in human cells by microRNA-induced gene silencing requires RCK/p54. PLoS Biol. 4:e210. 10.1371/journal.pbio.0040210. [DOI] [PMC free article] [PubMed] [Google Scholar]
- 59.Phalora PK, Sherer NM, Wolinsky SM, Swanson CM, Malim MH. 2012. HIV-1 replication and APOBEC3 antiviral activity are not regulated by P-bodies. J. Virol. 86:11712–11724. [DOI] [PMC free article] [PubMed] [Google Scholar]
- 60.Wang T, Tian C, Zhang W, Luo K, Sarkis PT, Yu L, Liu B, Yu Y, Yu XF. 2007. 7SL RNA mediates virion packaging of the antiviral cytidine deaminase APOBEC3G. J. Virol. 81:13112–13124. [DOI] [PMC free article] [PubMed] [Google Scholar]
- 61.Bach D, Peddi S, Mangeat B, Lakkaraju A, Strub K, Trono D. 2008. Characterization of APOBEC3G binding to 7SL RNA. Retrovirology 5:54. [DOI] [PMC free article] [PubMed] [Google Scholar]
- 62.Chiu YL, Witkowska HE, Hall SC, Santiago M, Soros VB, Esnault C, Heidmann T, Greene WC. 2006. High-molecular-mass APOBEC3G complexes restrict Alu retrotransposition. Proc. Natl. Acad. Sci. U. S. A. 103:15588–15593. [DOI] [PMC free article] [PubMed] [Google Scholar]
- 63.Kozak SL, Marin M, Rose KM, Bystrom C, Kabat D. 2006. The anti-HIV-1 editing enzyme APOBEC3G binds HIV-1 RNA and messenger RNAs that shuttle between polysomes and stress granules. J. Biol. Chem. 281:29105–29119. [DOI] [PubMed] [Google Scholar]
- 64.Liu J, Valencia-Sanchez MA, Hannon GJ, Parker R. 2005. MicroRNA-dependent localization of targeted mRNAs to mammalian P-bodies. Nat. Cell Biol. 7:719–723. [DOI] [PMC free article] [PubMed] [Google Scholar]
- 65.Martin KL, Johnson M, D'Aquila RT. 2011. APOBEC3G complexes decrease human immunodeficiency virus type 1 production. J. Virol. 85:9314–9326. [DOI] [PMC free article] [PubMed] [Google Scholar]
- 66.Liu C, Zhang X, Huang F, Yang B, Li J, Liu BF, Luo HH, Zhang P, Zhang H. 2012. APOBEC3G inhibits MicroRNA-mediated repression of translation by interfering with the interaction between Argonaute-2 and MOV10. J. Biol. Chem. 287:29373–29383. [DOI] [PMC free article] [PubMed] [Google Scholar]
- 67.Gallois-Montbrun S, Holmes RK, Swanson CM, Fernández-Ocaña M, Byers HL, Ward MA, Malim MH. 2008. Comparison of cellular ribonucleoprotein complexes associated with the APOBEC3F and APOBEC3G antiviral proteins. J. Virol. 82:5636–5642. [DOI] [PMC free article] [PubMed] [Google Scholar]
- 68.Reed JC, Molter B, Geary CD, McNevin J, McElrath J, Giri S, Klein KC, Lingappa JR. 2012. HIV-1 Gag co-opts a cellular complex containing DDX6, a helicase that facilitates capsid assembly. J. Cell Biol. 198:439–456. [DOI] [PMC free article] [PubMed] [Google Scholar]