

Abstract
The ability of the pathogen Mycobacterium tuberculosis to metabolize steroids like cholesterol and the roles that these compounds play in the virulence and pathogenesis of this organism are increasingly evident. Here, we demonstrate through experiments and bioinformatic analysis the existence of an architecturally distinct subfamily of acyl coenzyme A (acyl-CoA) dehydrogenase (ACAD) enzymes that are α2β2 heterotetramers with two active sites. These enzymes are encoded by two adjacent ACAD (fadE) genes that are regulated by cholesterol. FadE26-FadE27 catalyzes the dehydrogenation of 3β-hydroxy-chol-5-en-24-oyl-CoA, an analog of the 5-carbon side chain cholesterol degradation intermediate. Genes encoding the α2β2 heterotetrameric ACAD structures are present in multiple regions of the M. tuberculosis genome, and subsets of these genes are regulated by four different transcriptional repressors or activators: KstR1 (also known as KstR), KstR2, Mce3R, and SigE. Homologous ACAD gene pairs are found in other Actinobacteria, as well as Proteobacteria. Their structures and genomic locations suggest that the α2β2 heterotetrameric structural motif has evolved to enable catalysis of dehydrogenation of steroid- or polycyclic-CoA substrates and that they function in four subpathways of cholesterol metabolism.
Mycobacterium tuberculosis, the pathogenic bacillus responsible for tuberculosis disease, has successfully infected at least one third of the world's population, and tuberculosis is easily one of the most deadly human infectious diseases worldwide (1, 2). M. tuberculosis belongs to the phylum Actinobacteria, the members of which are known for the diverse array of natural products they produce and the many diseases they cause. The environmental competition of these bacteria for nutritional resources has resulted in their unique and intricate ability to metabolize complex carbon compounds. Interestingly, the human host provides M. tuberculosis, a pathogenic relative of these bacteria, an environment within the granuloma that is rich in the steroid cholesterol (3, 4).
The ability of Actinobacteria to metabolize sterols has been of interest for the better part of the last century, and several catabolite intermediates have been characterized. However, the relationship between gene products and metabolites remains poorly understood. The increase in availability of genome sequences (5) and the application of transcriptional profiling experiments (6, 7) has led to the tentative assignment of genes encoding cholesterol-degrading enzymes. Recombinant expression of cholesterol-regulated genes in combination with biochemical activity assays has provided successful mapping of validated enzymatic activities to specific substrates (Fig. 1). Phenotypic profiling of genes required for M. tuberculosis growth on cholesterol has also been used to establish which genes are involved in sterol metabolism (8).
Fig 1.

M. tuberculosis cholesterol degradation pathway. Not all individual steps are shown.
Two M. tuberculosis H37Rv enzymes involved in the dearomatization and cleavage of the cholesterol A and B rings, HsaC (9) and HsaD (10), respectively, show preferential activity toward steroids over biphenyl compounds, validating steroids as their in vivo substrates (7). Other examples of cholesterol degradation enzymes include 3β-hydroxysteroid dehydrogenase (3β-HSD) (Rv1106c) (11), KstD (12), KshA/B (13), FadA5 (6), Cyp125 (14), and FadD3 (15). Many (but not all) of the genes encoding cholesterol metabolism enzymes are regulated by cholesterol. Upon mutation of these genes, phenotypes in intracellular growth and/or persistence in the chronic phase of infection are observed.
More problematic are assignments of cholesterol-regulated β-oxidation enzymes to specific functions (Fig. 1). The genome of M. tuberculosis encodes multiple copies of the genes classically involved in β-oxidation, a case of apparent functional redundancy. In the case of the acyl coenzyme A (acyl-CoA) dehydrogenases (ACADs) (encoded by fadE genes), flavoproteins that catalyze the α,β-unsaturation of acyl-CoA thioesters in β-oxidation, there are 35 genes computationally annotated as encoding this activity in the M. tuberculosis genome. Acyl-CoA dehydrogenase substrates are generally short-, medium-, and long-chain fatty acids as well as aliphatic amino acids.
The cholesterol-regulated intracellular growth (igr) operon contains six genes in total, two of which are annotated as acyl-CoA dehydrogenases, and reside in adjacent open reading frames. Interestingly, recent work from our laboratory has demonstrated that fadE28 and fadE29 code for two separate proteins that form a functional α2β2 heterotetrameric enzyme complex (16). ACAD FadE28-FadE29 (now renamed ChsE1-ChsE2) catalyzes the unsaturation of 3-oxo-23,24-bisnorchol-4-en-22-oyl-CoA, an intermediate in the cholesterol metabolism pathway (Fig. 1) (16). This work represents the first definitive assignment of catalytic function to FadE enzymes in the cholesterol pathway. Previous studies were unable to resolve the ambiguities in potential function through sequence homology studies (8). The enzyme activity data of ChsE1-ChsE2 in combination with metabolic knockout studies of the igr operon defined the activity encoded by five of the six genes in the igr operon to be removal of the C-20 to C-22 propionate moiety of the cholesterol side chain (16, 17) (Fig. 1). The sixth gene encodes Cyp125 that catalyzes oxidation of C-26 of cholest-4-en-3-one (18).
ChsE1 and ChsE2 form an obligate α2β2 heterotetramer, and either protein expressed individually does not bind flavin adenine dinucleotide (FAD) cofactor (16). All of the human ACADs and bacterial fatty acid ACADs structurally characterized thus far form α4 homotetramers or α2 homodimers (19). To our knowledge, this was the first example of a heteromeric ACAD in any kingdom of life.
On the basis of insights gained from this unusual quaternary structure of ChsE1-ChsE2, we searched the M. tuberculosis genome for additional clusters of fadE genes that might form protein complexes. Of the 35 annotated fadE genes, we identified five additional groups of fadE genes encoded in operons, all of which are regulated by cholesterol, as well as a sixth not regulated by cholesterol (Fig. 2). Here, we establish that the α2β2 heterotetrameric ACAD motif is repeated within the cholesterol-regulated ACAD proteome. We conclude that fadE genes that are regulated by cholesterol, are proximal to another fadE gene, and retain only half of the expected cofactor binding residues form heteromeric α2β2 tetramers with two active sites. Furthermore, we identify additional bacteria that utilize this genetic architecture. Some of these bacteria are distantly related to M. tuberculosis, but all contain additional genes associated with steroid metabolism. These findings suggest that this structural motif has evolved to accommodate polycyclic CoA substrates such as steroid-CoA thioesters.
Fig 2.
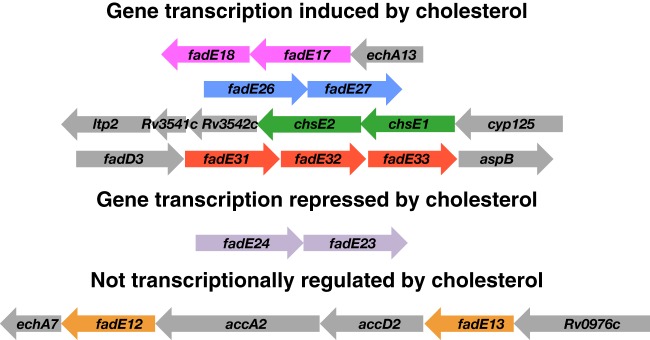
Operonic organization of M. tuberculosis fadE genes studied in this work. In the M. tuberculosis genome, there are six operons containing multiple genes annotated as fadE genes, all of which are regulated by cholesterol (6) except in the operon containing fadE12 and fadE13.
MATERIALS AND METHODS
Materials and general methods.
Total genomic DNA from M. tuberculosis H37Rv was obtained from the Tuberculosis Research Materials Facility at Colorado State University (Fort Collins, CO). DNA primers were ordered from Eurofins (Huntsville, AL). iProof high-fidelity DNA polymerase, used for gene amplification from genomic M. tuberculosis H37Rv DNA, was purchased from Bio-Rad Laboratories (Melville, NY). The pET vector system from Novagen was used for cloning (Madison, WI). Restriction endonucleases and T4 DNA ligase were purchased from New England BioLabs (Beverly, MA). Escherichia coli BL21(DE3) cells were obtained from Bio-Rad. The chaperone plasmid set, pG-KJE8, was from TaKaRa Bio Inc. (Japan). Tryptone and ampicillin were purchased from Fisher Scientific (Pittsburgh, PA). Yeast extract was purchased from Research Products International Co. (Mount Prospect, IL). DNA sequencing was performed at the Stony Brook Sequencing Facility using an Applied Biosystems ABI 3730 DNA analyzer (48-cm capillary array) to confirm recombinant gene sequences. Cell disruption was performed using a Constant Systems, Inc. TS series benchtop instrument (Kennesaw, GA). The following buffers were used: buffer A (binding), 20 mM Tris-HCl, 0.5 M NaCl, 20 mM imidazole (pH 7.4); buffer B (wash), 20 mM Tris-HCl, 0.5 M NaCl, 50 mM imidazole; buffer C (elution), 20 mM Tris-HCl, 0.5 M NaCl, 0.5 M imidazole (pH 7.4); buffer D, 50 mM Tris-HCl, 200 mM NaCl, 1 mM tris(2-carboxyethyl)phosphine (TCEP) (pH 7.4). Electroporation was performed using a BTX electroporation system (Holliston, MA). Isolation of hexahistidine-tagged recombinant proteins was achieved via immobilized-metal affinity chromatography (IMAC) using nickel-nitrilotriacetic acid (Ni-NTA) His•Bind resin (Novagen). Proteins were identified by trypsin digest peptide mass fingerprinting using a Bruker Autoflex II tandem time of flight (TOF/TOF) instrument operating in positive-ion mode (Bruker Daltonics Inc., Billerica, MA). Fast performance liquid chromatography (FPLC) gel filtration chromatography was performed on a dextran Superdex 200 16/60 column from GE Biosciences (GE Healthcare, Piscataway, NJ). Analytical ultracentrifugation (AUC) was performed on a Beckman Coulter L-90k AUC instrument (Brea, CA). Ultraperformance liquid chromatography (UPLC) mass spectrometry (LC-MS) was performed on an Acquity ultraperformance LC instrument equipped with a diode array and single-quadrupole (SQ) detectors from Waters (Milford, MA). The column used was an XBridge BEH C4 column, 300 Å, 3.5 μm, and 2.1 mm by 100 mm. The following solvents were used: solvent E, 95:5 H2O:2-propanol, 0.1% (vol/vol) trifluoroacetic acid (TFA); solvent F, 5:95 H2O:2-propanol, 0.1% (vol/vol) TFA.
Gene cloning and plasmid construction.
All genes were initially amplified from M. tuberculosis H37Rv total genomic DNA by PCR. PCR products were doubly digested with NdeI and HindIII restriction enzymes and ligated into a similarly digested pET vector for E. coli or digested with EcoRV and ligated into shuttle vector pSD31 for Mycobacterium smegmatis. Ligated plasmids containing the gene of interest were transformed into competent E. coli XL1-Blue cells for amplification and isolation of plasmid DNA. DNA sequencing with T7 promoter and terminator primers confirmed that the full gene was present without mutations. For each fadE operonic set, individual gene constructs for in trans expression, as well as polycistronic operonic constructs were prepared for protein expression (Table 1).
Table 1.
Gene constructs used in this study
| Constructa | Locus tag | Gene name | Vectorb | His6 tag |
|---|---|---|---|---|
| p17N | Rv1934c | fadE17 | pET28b(+) | N-terminal |
| p18 | Rv1933c | fadE18 | pET20b(+) | None |
| p17N/18 | Rv1934c/1933c | fadE17-fadE18 | pET28b(+) | N-terminal |
| pechA13N/17/18 | Rv1935c/1934c/1933c | echA13-fadE17-fadE18 | pET28b(+) | N-terminal |
| pechA13/17/18C | Rv1935c/1934c/1933c | echA13-fadE17-fadE18 | pET29b(+) | C-terminal |
| p17N/18-smeg | Rv1934c/1935c | fadE17-fadE18 | pSD31c | N-terminal |
| p24N/23 | Rv3139/3140 | fadE24-fadE23 | pET28b(+) | N-terminal |
| p24N | Rv3139 | fadE24 | pET28b(+) | N-terminal |
| p23 | Rv3140 | fadE23 | pET20b(+) | None |
| p23N | Rv3140 | fadE23 | pET28b(+) | N-terminal |
| p26N/27 | Rv3504/3505 | fadE26-fadE27 | pET-28b(+) | N-terminal |
| p26N | Rv3504 | fadE26 | pET-28b(+) | N-terminal |
| p27 | Rv3505 | fadE27 | pET-20b(+) | None |
| p27N | Rv3505 | fadE27 | pET-28b(+) | N-terminal |
| pigr5d | Rv3544c-Rv3540c | fadE28-fadE29 | pET-28b(+) | N-terminal |
| p31N/32/33 | Rv3562/3563/3564 | fadE31-fadE32-fadE33 | pET-28b(+) | N-terminal |
| p31/32/33C | Rv3562/3563/3564 | fadE31-fadE32-fadE33 | pET-29b(+) | C-terminal |
| p31N | Rv3562 | fadE31 | pET-28b(+) | N-terminal |
| p32N | Rv3563 | fadE32 | pET-28b(+) | N-terminal |
| p33C | Rv3564 | fadE33 | pET-29b(+) | C-terminal |
| p31 | Rv3562 | fadE31 | pET-20b(+) | None |
| p32 | Rv3563 | fadE32 | pET-20b(+) | None |
| p33 | Rv3564 | fadE33 | pET-20b(+) | None |
| p12N | Rv0972c | fadE12 | pET-28b(+) | N-terminal |
| p13N | Rv0975c | fadE13 | pET-28b(+) | N-terminal |
| p12 | Rv0972c | fadE12 | pET-20b(+) | None |
| p13 | Rv0975c | fadE13 | pET-20b(+) | None |
Vector names were assigned N or C following the FadE number that contained either an N- or C-terminal His6 tag, respectively. The 5′-terminal and 3′-terminal cloning sites were NdeI and HindIII, respectively, except where noted.
Antibiotic resistance markers in the vectors were as follows: pET20b(+), ampR; pET28b(+) and pET29b(+), kanR, and pSD31, hygR.
EcoRv was used to clone at the 5′ and 3′ ends of the gene.
This construct is described in reference 17.
Protein expression in E. coli.
Constructs were transformed into competent E. coli BL21(DE3) cells with or without chaperone plasmid pG-KJE8. Single colonies were selected on LB/agar plates supplemented with the appropriate antibiotics(s); 30 μg/ml kanamycin for pET28b(+) and pET29(+), 100 μg/ml ampicillin for pET20b(+), and 20 μg/ml chloramphenicol for pG-KJE8. E. coli was cultured at 37°C in 2× YT medium (16 g/liter tryptone, 10 g/liter yeast extract, 5 g/liter NaCl), and when necessary, chaperone expression was induced at inoculation with l-arabinose (2 mg/ml) and tetracycline (10 ng/ml). Cultures were grown until the optical density at 600 nm (OD600) reached 0.6 to 0.8, the temperature was lowered to either 25°C or 18°C, cellular cultures were allowed to equilibrate, and isopropyl-β-d-thiogalactoside (IPTG) was added to a final concentration of 0.4 to 1 mM to induce protein expression. Cultures were grown for about 12 h at 25°C or 20 h at 18°C.
Protein expression in M. smegmatis.
The fadE17N/18-smeg construct was electroporated into electrocompetent M. smegmatis mc2155 with an exponentially decaying pulse (2.5 kV resistance; 129 Ω resistance timing; time constant of capacitance timing, 25 μF). Transformants were grown for 4 h at 35.5°C in 7H9 medium and then plated onto 7H10 agar plates containing 50 μg/ml hygromycin, 10 μg/ml cycloheximide, and 100 μg/ml ampicillin. Cultures were grown in 1 liter of 7H9 medium supplemented with the appropriate antibiotics until the OD600 reached ∼1, then protein expression was induced with 0.2% acetamide, and cultures were grown for about 24 h at 35.5°C.
IMAC protein purification.
Cells were harvested by centrifugation at 5,000 × g for 15 min at 4°C, and all subsequent steps were conducted at 4°C. The cells were suspended in buffer A and lysed either by sonication (5 times, 1 min), French press (3 times at 10,000 lb/in2), or cell disruption (2 times, 27,000 lb/in2). The method of cell lysis did not affect protein complex formation or solubility. Cell disruption was used for large-scale experiments. Cellular debris was removed by centrifugation at 125,000 × g for 1 h. The supernatant was loaded onto IMAC His•Bind resin, washed with 10 column volumes of buffer B, and eluted with buffer C. Protein solutions were immediately desalted by dialysis with buffer D or with a G25 desalting column equilibrated and developed in buffer D.
SEC purification of soluble ACAD proteins.
Isolated ACAD proteins in buffer D were concentrated by ultrafiltration (molecular weight cutoff [MWCO] 10 kDa) to less than 3 ml and purified by size exclusion chromatography (SEC) on a Superdex 200 column equilibrated in buffer D. The column was developed in buffer D at a flow rate of 1.0 ml/min and monitored at 220 nm, 280 nm, and 440 nm. Fractions with absorbance at 440 nm were collected, concentrated, and stored at 4°C.
Analysis of recombinant proteins.
Purified proteins were analyzed by reducing SDS-PAGE, and protein band identities were confirmed by in-gel tryptic digestion and subsequent matrix-assisted laser desorption ionization–time of flight (MALDI-TOF) mass spectrometry. Protein bands from SDS-polyacrylamide gels were excised, washed with H2O, and dried with CH3CN. The protein cysteine residues were reduced using 45 mM dithiothreitol (DTT) in 100 mM ammonium bicarbonate (NH4HCO3) for 45 min at 56°C and then alkylated using 55 mM iodoacetamide in 100 mM NH4HCO3 for 30 min in the dark. Samples were dried completely by lyophilization and rehydrated with trypsin solution (200 ng/μl) in 50 mM NH4HCO3 for about 45 min on ice. Excess trypsin was washed away, the gel pieces were redissolved in 50 mM NH4HCO3, and digestion was allowed to continue for at least 12 h at 37°C. This solution was combined with peptide fragments, which were extracted thrice using 50 μl of 60% (vol/vol) CH3CN in aqueous 0.1% (wt/vol) TFA. The combined extracts were dried completely and dissolved in 10 to 15 μl of aqueous 0.1% TFA. This solution was mixed with an equal amount (vol/vol) of α-cyano-4-hydroxycinnamic acid matrix, and MALDI-TOF data were acquired and analyzed using Flex-Analysis software (Bruker).
Protein complex molecular weight determination.
Samples were subjected to analytical ultracentrifugation with a Beckman Optima XL-A centrifuge equipped with an absorption optical scanner set to detect at 280 nm. Sedimentation equilibrium (SE) experiments were performed at 20°C for all ACAD complexes except FadE23-FadE24, which was performed at 4°C. Following SEC purification, protein samples were analyzed at three concentrations (ranging from absorbances at 280 nm of ∼0.2 to 1) and three rotor speeds (20,000, 25,000, and 30,000). After centrifugation for 18 h and 20 h at each speed, a concentration distribution curve was acquired, monitoring at 280 nm. Approximately 80 curves generated from replicate scans were fit globally in Heteroanalysis (University of Connecticut, Storrs, CT) to the ideal single-species model. The sample buffer density (ρ) and partial specific volume (v̄) of each protein were calculated using SEDNTERP (University of New Hampshire, Durham, NH).
Oligomer stoichiometry determination.
Heteromeric ACAD complexes were analyzed on a Waters LC/UV/MS to determine the complex stoichiometry. Proteins were separated on an XBridge BEH 300 C4 3.5-μm column (2.1 by 100 mm) at 40°C with a linear gradient from 100% solvent E to 100% solvent F over 15 min at a flow rate of 0.5 ml/min. MS data were collected in electrospray ionization (ESI) positive mode with a cone voltage of 40 V, capillary voltage of 4.5 kV, and source temperature of 150°C. Peaks in the LC/UV chromatogram were assigned by the deconvolution of the multicharged states in the corresponding mass spectra. The integrated peak areas at 280 nm of each protein were divided by the corresponding molar extinction coefficient for the protein to yield the molar concentrations. Protein stoichiometry was determined from the ratio of the molar concentrations.
Determination of the protein complex-to-FAD ratio.
An ∼5 μM (∼0.8-mg/ml) solution of protein in buffer D was denatured by boiling for 10 min. The sample was chilled on ice and centrifuged to pellet precipitated protein. The quantity of FAD obtained in the supernatant was determined using the absorbance and extinction coefficient of FAD at 260 nm, ε260 = 37,000 M−1cm−1 (16). The protein pellet was dissolved in 6 M guanidine-HCl, and the concentration was determined using the calculated extinction coefficients at 280 nm based on the primary amino acid sequence (determined using ExPASy) (20). The experiments were performed in triplicate for each protein complex, and the averaged concentration for protein and concentration for FAD were obtained for each ACAD.
Dehydrogenase assay.
Dehydrogenase activity was assayed using 3β-hydroxy-chol-5-en-24-oyl-CoA. The identity of the CoA thioester was confirmed by LC-MS. Each ACAD (100 nM) was assayed using ferrocenium hexafluorophosphate (250 μM) as an artificial electron acceptor and 1 mM substrate in 100 mM HEPES, pH 7.4 (21, 22). The formation of product was followed spectrophotometrically at 300 nm and 25°C with the extinction coefficient of ferrocenium hexafluorophosphate, 3.4 mM−1 cm−1. Product formation was confirmed by MALDI-TOF MS. Negative controls without substrate or without enzyme were conducted to check for background reduction of ferrocenium hexafluorophosphate.
Identification of homologous bacterial gene sequences.
BLAST searches were conducted using the 11 cholesterol-regulated M. tuberculosis fadE gene sequences against all kingdoms of life. To identify closely related sequences, blastn and blastp were used, and to identify more distant relatives, PHI-BLAST and tblastx were used. The 11 M. tuberculosis fadE gene sequences were used independently of BLAST for orthologs; gene pairs were not used in the search.
Construction of a phylogenetic tree and pairwise alignment scores for network analysis.
To construct a phylogenetic tree, around 150 of the most closely related nucleotide sequences (E value < 10−30) of homologs of the M. tuberculosis fadE gene sequences were compiled. These homologs were all of bacterial origin. In order to evaluate both synonymous and nonsynonymous mutations, these nucleotide sequences were first translated into protein, then aligned by ClustalW, and finally retranslated back to the nucleotide sequences (23). This multiple alignment was used to test 24 separate nucleotide substitution models, and the model with the lowest Bayesian information criterion (BIC) score was chosen for computing the pairwise evolutionary distances between each sequence—the general time reversible (GTR) model with a gamma distributed substitution rate (Γ) and an allowance for a proportion of invariant sites (I). The pairwise alignment values were then used to construct a network where nodes represent individual gene sequences, and edges represent the relative evolutionary distance between each node. For clarity, only edge attributes of operonic ACADs were highlighted in the network.
RESULTS
Bioinformatic analysis of the annotated FadE proteome of M. tuberculosis.
On the basis of the discovery of a novel heteromeric acyl-CoA dehydrogenase encoded in the igr operon, we undertook a full bioinformatic analysis of the M. tuberculosis acyl-CoA dehydrogenase proteome. Analysis of the genomic context of the 35 M. tuberculosis fadE genes found that six operons contain more than one fadE gene and that in five of the six cases, these genes were adjacent and regulated by cholesterol (6, 7). In one case, three fadE genes were adjacent (fadE31, fadE32, and fadE33). The fadE12 and fadE13 genes are not adjacent in their operon and are not regulated by cholesterol (Fig. 2).
We further analyzed the alignments of these fadE sequences with structurally characterized ACADs (Fig. 3; see Fig. S1 in the supplemental material). Typically, ACADs are homotetramers that contain four active sites and four FAD cofactors. The homotetramer assembles as a dimer of dimers with an S2 axis of symmetry. Within a dimer, there are two FAD cofactor-binding sites, which are related by a C2 axis at the monomer-monomer interface, and each binding site contains residues from both the A and B chains.
Fig 3.

Analysis of FAD binding sites in M. tuberculosis ACAD complexes. (A) Homology model of the heterotetrameric FadE26-FadE27 complex based on the crystal structure of human i3VD (shown with the S2 rotational axis). The FAD in a complete and conserved binding site is shown in yellow, and the FAD in a nonconserved binding site is shown in gray. The catalytic glutamate is shown in red. (B) Active site and FAD binding sites in M. tuberculosis homotetrameric and heterotetrameric ACADs compared to human i3VD (24) and MCAD (40). Conserved residues for riboflavin binding and adenosine binding are shown in green and blue, respectively, and nonconserved residues are shown in gray (also see Fig. S1 in the supplemental material).
We found that for the adjacent M. tuberculosis fadE gene pairs, many key FAD binding site residues are not conserved in each of the polypeptides (Fig. 3; see Fig. S1 in the supplemental material). Moreover, if a single polypeptide sequence is threaded onto a homotetramer structure, only half of each of the four FAD binding sites contains conserved amino acids required to form hydrogen bonds with the cofactor. In contrast, when two polypeptides encoded by adjacent genes are threaded onto chains A and B, conserved amino acids from both polypeptides comprise an intact FAD binding site; the residues that align with the second binding site are not suitable for binding FAD. In contrast, for FadE12 and FadE13, which are encoded by nonadjacent genes, the FAD binding residues are fully conserved.
In addition to a redox cofactor, a catalytic base to deprotonate the acyl-CoA substrate is required for dehydrogenation. This catalytic base is typically a glutamate, and sometimes an aspartate. Glutamate is found at one of two positions within the tertiary structures of ACADs: either in helix G, exemplified by iso-valeryl-CoA dehydrogenase (i3VD) (24), or at the junction of helices J and K, for example as found in long-chain acyl-CoA dehydrogenase (LCAD) (25). We found that only one gene from each adjacent fadE gene pair contained a glutamate in the sequence alignments. The other partner did not have a potential general base residue, and frequently gaps were present in the alignments. One exception was the case of FadE23 and FadE24, for which a glutamate residue from both proteins aligned with the medium-chain acyl-CoA dehydrogenase (MCAD) glutamate despite the missing FAD binding site. Moreover, both the FadE12 and FadE13 sequences contain a glutamate residue that aligns with i3VD.
In the case of ChsE1-ChsE2, only two FAD cofactors are bound per α2β2 heterotetramer. Furthermore, site-directed mutagenesis experiments demonstrated that the conserved Glu241 in ChsE2 is required for catalytic activity. These observations are consistent with the hypothesis that only two active sites are formed in the ChsE1-ChsE2 α2β2 heterotetramer (16). By analogy, we hypothesized that the adjacent or proximal fadE gene pairs fadE17-fadE18, fadE26-fadE27, fadE31-fadE32, fadE31-fadE33, and fadE23-fadE24 encode heterotetrameric ACADs with two active sites and that fadE12 and fadE13 each encode homotetrameric ACADs with four active sites.
Protein expression of individual fadE genes.
In order to test our hypothesis, we first examined the ability of each FadE protein to form a soluble, holoprotein independently. Each fadE gene was expressed individually with a His6 tag without its operonic partner and subsequently purified by IMAC. Expression of individual fadE genes was determined with coexpression of chaperones DnaK, DnaJ, GrpE, GroES, and GroEL. All FadE proteins, with the exception of FadE17, FadE27, and ChsE1 (FadE28), were expressed in soluble form. However, analysis by UV-visible spectroscopy revealed that only FadE12 and FadE13 were isolated as the holoprotein with flavin cofactor bound. FadE18, FadE23, FadE24, FadE26, ChsE2 (FadE29), FadE31, FaE32, and FadE33 were obtained as the apoprotein without FAD bound as indicated by UV-visible spectroscopy (Table 2).
Table 2.
Individual gene expression of operonic M. tuberculosis FadE proteinsa
| Feature | Characteristic for the following protein: |
|||||||||||
|---|---|---|---|---|---|---|---|---|---|---|---|---|
| FadE18 | FadE23 | FadE24 | FadE26 | FadE27 | FadE28b | FadE29c | FadE31 | FadE32 | FadE33 | FadE12 | FadE13 | |
| Observed expressiond | S | S | S | US | UF | UF | S | S | S | S | S | S |
| Isolated with FAD cofactore | No | No | No | No | No | No | No | No | No | No | Yes | Yes |
| His6 tag locationf | C | N | N | N | N | N | N | N | N | C | N | N |
Proteins were isolated by immobilized metal ion affinity chromatography (IMAC).
ChsE1.
ChsE2.
Abbreviations: S, soluble and stable at 4°C; US, soluble but precipitated after IMAC; UF, located in inclusion bodies and unfolded.
Flavin adenine dinucleotide (FAD) binding was determined by UV-visible spectroscopy.
The His6 tag was placed on either the N or C terminus as indicated.
Protein expression of operonic fadE partners.
Next we evaluated complex formation of operonic fadE gene products. We prepared expression constructs in which only one fadE gene of each proposed pair contained a His6 tag for purification. For all fadE genes, we prepared constructs for expression in cis on a single plasmid and constructs for expression in trans, in which each gene was cloned into a separate expression vector. For the genes expressed in cis, adjacent genes were cloned into pET28b with an N-terminal His6 tag. For the genes expressed in trans, one gene was cloned into pET28b with an N-terminal His6 tag and the adjacent gene was cloned into pET20b without any tag. For the fadE31-fadE32-fadE33 gene triplet and for the echA13-fadE17-fadE18 operon, a second in cis construct was prepared in pET-29b with a C-terminal His6 tag.
After expression in cis, soluble protein complexes with bound FAD cofactor were isolated by IMAC purification for FadE23-FadE24 and FadE26-FadE27 (Table 3). Using the expression constructs expressed in cis, p31N/32/33, in which FadE31 contained an N-terminal His6 tag, and p31/32/33C, for which FadE33 contained a C-terminal His6 tag, we isolated FadE31-FadE32 and FadE31-FadE33, respectively (Table 3). In the case of FadE17 and FadE18, soluble protein was not obtained. We further tested expression of the entire echA13-fadE17-fadE18 operon in cis with either an N-terminal or C-terminal His6 tag. Upon IMAC purification, only soluble EchA13 or apo-FadE18 was obtained, respectively.
Table 3.
Biophysical characterization of ACAD protein complexes from M. tuberculosis
| Feature | Characteristic or value of the following ACAD complexa: |
|||||||
|---|---|---|---|---|---|---|---|---|
| H-ChsE2-ChsE1 (16) | H-FadE26-FadE27 | H-FadE24-FadE23 | H-FadE31-FadE32 | H-FadE33-FadE31- | H-FadE18-FadE17- | H-FadE12 | H-FadE13 | |
| Predicted structure | α2β2 | α2β2 | α2β2 | α2β2 | α2β2 | α2β2 | α4 | α4 |
| Observed structure | α2β2 | α2β2 | α2β2 | α2β2 | α2β2 | NS | α4 | α4 |
| Molecular mass (kDa) | ||||||||
| Expected | 161 | 168 | 188 | 151 | 152 | 166 | 166 | 163 |
| AUC (mean ± SEM) | 156 ± 1 | 158 ± 1 | 211 ± 2 | 163 ± 0.5 | 164 ± 0.5 | NS | 139b | 179 ± 2 |
| FAD/complex ratio | 2:1 | 2:1 | 2:1 | 2:1 | 2:1 | ND | ND | 4:1 |
| Cholesterol regulationc | Up | Up | Down | Up | Up | Up | NR | NR |
| Transcriptional repressor | KstR1d | KstR1 | SigEe | KstR2f | KstR2 | Mce3Rg | SenXh | SenX |
H-ChsE2-ChsE1, His-tagged ChsE2-ChsE1; NS, not soluble; ND, not determined.
FadE12 was not stable for the duration of the AUC experiment. Therefore, the molecular mass of FadE12 was obtained using analytical size exclusion.
Based on the transcriptional profiling experiments of Nesbitt et al. (6). Abbreviations: Up, upregulated; Down, downregulated; NR, not regulated by cholesterol.
Regulated by KstR1 (30).
Regulated by SigE (32).
Regulated by KstR2 (31).
Regulated by Mce3R (38).
Regulated by SenX (39).
We tested further to determine whether pairs of fadE genes could be expressed in trans. FadE23-FadE24 and FadE26-FadE27 again formed soluble complexes. For the fadE gene triplet fadE31-fadE32-fadE33, we coexpressed every combination of pairs of these three genes in trans. However, fadE31 expressed with either fadE32 or fadE33 did not yield soluble protein. Likewise, expression of fadE32 and fadE33 in trans did not provide soluble, cofactor-bound protein.
Although individual expression of fadE12 or fadE13 resulted in soluble, holo-FadE enzymes (holo-FadEs), we tested to see whether FadE12 and FadE13 might form a complex. The genes were expressed in trans; one construct encoded a His6 tag, whereas the second construct did not. Regardless of His6 tag location, FadE12 and FadE13 were each isolated as homomeric complexes with bound flavin.
With the exception of FadE17-FadE18, we were able to demonstrate that all cholesterol-regulated fadE genes that share an operon form heteromeric complexes with FAD cofactor bound (see Fig. S2 and S3 in the supplemental material). The fadE genes that are not regulated by cholesterol, not adjacent in their operon, and contain fully conserved FAD binding sites, i.e., fadE12 and fadE13, form the usual homomeric complexes.
Protein expression of nonoperonic fadE genes: FadE crossover experiments.
In order to test the promiscuity of protein complex formation, we coexpressed the fadE26 and chsE1 genes and fadE27 and chsE2 genes. FadE26 and ChsE2 share 46% amino acid identity, the highest identity between any of the cholesterol-regulated fadE genes. Therefore, they are most likely to substitute for one another. Likewise, FadE27 and ChsE1 share 30% amino acid identity. Coexpression of fadE26 and chsE1 resulted in purification of apo-His6-tagged FadE26. Similarly, coexpression of fadE27 and chsE2 resulted in purification of apo-His6-tagged ChsE2. No heteromeric ACAD complexes were isolated.
Characterization of isolated FadE oligomeric complexes.
After expression, proteins were purified by IMAC. Soluble complexes were characteristically yellow by eye, and after further purification by size exclusion chromatography, UV-visible spectra were obtained. The spectra of all the complexes contained typical absorbance maxima around 370 nm and 440 nm, consistent with bound FAD (see Fig. S3 in the supplemental material).
For each ACAD complex isolated, we performed in-gel tryptic digestion, followed by MALDI-TOF mass spectrometry to confirm the identities of the polypeptides in the complexes. In all cases, the peptide fingerprint obtained in experiments matched the expected theoretical fingerprint with greater than 40% sequence coverage.
To determine the quaternary structure of the purified heteromeric ACAD complexes, we performed AUC sedimentation equilibrium and LC/UV/MS analysis, as well as gel filtration chromatography. The molecular weights determined by AUC were consistent with each ACAD complex forming a tetramer (Table 3). To confirm the stoichiometry of the complexes, they were subjected to denaturing HPLC separation with a C18 column. For each heteromeric complex, equimolar concentrations of each polypeptide were present, confirming the formation of an α2β2 quaternary structure.
The FAD stoichiometry for each holoprotein complex was determined. Protein complexes were denatured, and protein was separated from FAD by centrifugation. The concentrations of protein and FAD were determined spectroscopically at 280 nm and 260 nm, respectively (Table 3). The results indicate that for all of the heteromeric M. tuberculosis cholesterol-regulated ACAD enzyme complexes, there are two FAD cofactors bound per α2β2 tetramer.
Purified FadE23-FadE24, FadE26-FadE27, ChsE1-ChsE2, FadE31-FadE32, FadE31-FadE33, and FadE13 complexes were assayed for acyl-CoA dehydrogenase activity with 3β-hydroxy-chol-5-en-24-oyl-CoA. This substrate was used as an analog of the 5-carbon side chain degradation intermediate. FadE26-FadE27 catalyzed the dehydrogenation of 3β-hydroxy-chol-5-en-24-oyl-CoA, whereas FadE23-FadE24, FadE31-FadE32, FadE31-FadE33, FadE13, and ChsE1-ChsE2 did not (see Fig. S4 in the supplemental material).
Heterotetrameric ACAD structures are present in other Actinobacteria and Proteobacteria.
We used BLAST to individually identify homologs of each of the 11 cholesterol-regulated M. tuberculosis fadE genes from this work. We found that several phyla in the bacterial kingdom contain homologs of acyl-CoA dehydrogenases that also are paired with a second fadE gene in the same operon, most notably Actinobacteria, Proteobacteria, and several members of the Firmicutes phylum. Two consecutive acyl-CoA dehydrogenase genes were not identified in plants, fungi, or animals consistent with the different genomic structures present in bacteria versus other kingdoms.
A representative taxonomy of bacteria was chosen, and the homologs of M. tuberculosis ACAD genes from these organisms were used to generate a similarity network. About 150 gene sequences were compiled, translated into protein sequences, globally aligned, and then retranslated back to DNA. The pairwise distance scores were calculated from a GTR plus Γ plus I evolutionary model, and these were used to construct the phylogenetic network. In order to visualize the operon relationships of these genes, a network analysis was performed (Fig. 4; see Fig. S5 in the supplemental material), in addition to a traditional evolutionary tree (Fig. S6). Each node of the network represents a single ACAD gene. The distances between nodes represent the relative evolutionary distances between each gene. The lines (edges) between nodes represent operon pairings.
Fig 4.

Phylogenetic network for bacterial ACAD genes homologous to cholesterol-regulated and proximal operonic M. tuberculosis fadE genes. Each node (circle) represents a gene. Distances between nodes represent relative evolutionary distance between two genes. For illustrative purposes, only edges that represent distances between two genes in the same operon are shown. The pink nodes are the 11 M. tuberculosis fadE genes that are regulated by cholesterol. The green nodes are non-M. tuberculosis Actinobacteria. The yellow nodes are Proteobacteria. Gene clusters I to IV referenced in the text are indicated as I to IV, respectively, in the figure. (A) Full phylogenetic network. (B) The 11 M. tuberculosis fadE genes present in operons are highlighted. The edges are colored according to the operon coloring in Fig. 2. (C) Magnification of the fadE31-fadE32-fadE33 gene triplet. This network was generated in Cytoscape 2.8.2 using an edge-weighted, spring embedded layout (41). A high-resolution version with labeled nodes is available as Fig. S4 in the supplemental material.
The fadE genes cluster into four sets of similar genes (Fig. 4A and B, groups I to IV). Groups I to III are all upregulated by cholesterol, and group IV is downregulated by cholesterol in M. tuberculosis. The proteins encoded by group I genes (Fig. 4A and B, group I, fadE17, fadE26, chsE2, and fadE31) all contain the active site base, glutamate, in the sequence alignments. The polypeptides that pair with group I form two distinct clusters, group II (fadE27 and chsE1) and group III (fadE18, fadE32, and fadE33). The fadE23 and fadE24 genes and their homologs cluster independently (Fig. 4A and B, group IV). In Fig. 4, only edges between adjacent fadE genes are shown. From this representation, it is clear that each set of the operonic pairs is conserved and that pairs do not swap between operons in different species.
In order to determine whether the species containing the α2β2 homologs also metabolize steroids, we searched for homologs of cholesterol oxidase-encoding genes (choA, choE, and choD), 3β-hsd, and kshA, which encodes a component of 3-ketosteroid 9α-hydroxylase, in their genomes. Both cholesterol oxidase and 3β-HSD catalyze the conversion of cholesterol to cholest-4-en-3-one, the first step in bacterial cholesterol catabolism (Fig. 1). KshA is required for oxidation and aromatization of the A ring of a steroid. We found that nearly all genomes contained a cholesterol oxidase or 3β-HSD ortholog and in most cases contained a KshA ortholog as well (see Table S1 in the supplemental material), which suggests that the presence of α2β2 ACADs correlates with the catabolism of sterols.
DISCUSSION
Almost all typical ACADs characterized thus far have an α4 homotetrameric quaternary structure with four FAD cofactors bound per tetramer (the exception being very-long-chain ACADs, which are homodimers). In earlier work, an unusual heterotetrameric ACAD that dehydrogenates the 2′-propionyl-CoA side chain of a sterol degradation intermediate was discovered (16). Herein, we have identified five additional α2β2 heterotetramers from M. tuberculosis and characterized four of them. All four of these ACADs bind two molecules of FAD noncovalently and are expected to have two active sites per tetramer. Interestingly, the expression of all six α2β2 M. tuberculosis ACADs identified within the M. tuberculosis genome are regulated by cholesterol.
We found that the adjacent fadE gene pair/heterotetrameric ACAD motif is present in several different species of bacteria from the Actinobacteria and Proteobacteria phyla. These genera include Pseudomonas (26), Burkholderia (27), and Comamonas (28). The network analysis demonstrates that operonic pairs encoding an α2β2 protein architecture in M. tuberculosis are conserved in these phyla. Moreover, different pairings from those observed in M. tuberculosis were not identified. The conservation of operons suggests that the αβ protein interface is unique for each heterotetrameric complex and that α FadEs have a single β FadE partner. This specificity is further confirmed by the failure of new heteromeric pairings to form in an expression crossover experiment.
We used the presence of choA (also choD or choE), 3β-hsd, and/or kshA genes as markers for an organism's ability to metabolize steroids. We found these markers in the genomes of almost all of the organisms encoding putative α2β2 ACADs. The presence of the α2β2 ACAD motif in bacteria distantly related to M. tuberculosis (i.e., separate phyla) that also metabolize steroids supports the importance of the heterotetramer structure for binding steroids. Taken together, these data suggest a modified ACAD architecture evolved for dehydrogenation of cycloalkane acyl-CoA substrates.
The ability of the Actinobacteria to adapt to a diverse set of environments is in part due to the complex regulation of a large number of genes, a subset of which have functions necessary for survival in each of those environments. In the M. tuberculosis genome, there are over 250 genes identified as involved in lipid, sterol, and fatty acid metabolism (29), and there are many variants of TetR-like transcriptional repressors throughout the M. tuberculosis genome. A large subset of the genes (∼80 to 90) in the M. tuberculosis cholesterol-regulated transcriptome are under the control of two TetR-like transcriptional repressors, KstR1 (also known as KstR) (30) and KstR2 (31).
The cholesterol-dependent KstR1 and KstR2 regulons encode four of the FadE protein complex pairs: FadE26-FadE27, ChsE1-ChsE2, FadE31-FadE32, and FadE31-FadE33. Although upregulated by cholesterol, FadE17-FadE18 expression is under the control of the TetR-like Mce3R repressor (6). In contrast, FadE23-FadE24 expression is downregulated by cholesterol and requires SigE, a transcriptional activator, for expression (32).
ChsE1-ChsE2 catalyzes dehydrogenation of the partially oxidized sterol side chain (16). FadE26-FadE27 most likely catalyzes an analogous step (or steps) earlier in the β-oxidation pathway of sterol side chain degradation based on its homology with ChsE1-ChsE2 and similar transcriptional regulation by KstR1. Consistent with this prediction, FadE26-FadE27 catalyzes the dehydrogenation of 3β-hydroxy-chol-5-en-24-oyl-CoA, an analog of the partially oxidized 5-carbon side chain intermediate. The protein similarities, their gene regulation, and the preliminary catalytic activity measurements are consistent with KstR1 control over production of side chain-cleaving enzymes.
The fadE31-fadE32-fadE33 gene triplet from clusters I and III are highlighted in Fig. 4C (pink edges). Although the triplet organization is conserved in Actinobacteria (green edges), the proteobacterial homologs are organized as duplet gene assemblies. That is, each genome has two distinct orthologs of fadE31. Each of these orthologs is paired with either a fadE32 or fadE33 gene in separate operons (yellow edges). These pairings are consistent with the oligomeric complexes isolated upon expression of the M. tuberculosis fadE31-fadE32-fadE33 gene triplet.
The fadE31-fadE32-fadE33 operon is regulated by KstR2. FadD3 from the KstR2 regulon catalyzes the formation of a CoA ester of the C/D ring intermediate of cholesterol degradation (15). Thus, the role of the proteins encoded in the KstR2 regulon is proposed to be catabolism of the C and D rings of the degradation intermediate. Consistent with this role, FadE31-FadE32 and FadE31-FadE33 do not catalyze dehydrogenation of 3β-hydroxy-chol-5-en-24-oyl-CoA, contrary to the assignment of Griffin et al. (8). Further assignment of function in this regulon awaits biochemical confirmation.
On the basis of our bioinformatic analysis, we hypothesize that in vivo, FadE17-FadE18 is an α2β2 heterotetramer, although our attempts to isolate soluble FadE17-FadE18 have thus far been unsuccessful. Mycobacterium bovis type 17, in which the echA13-fadE17-fadE18 operon is missing, is the predominant strain in the United Kingdom. In this strain, propionate flux shifts away from complex lipid synthesis toward pyruvate synthesis (33). This shift is believed to provide an evolutionary advantage to M. bovis, since this strain naturally lacks two key genes required for pyruvate synthesis. The M. bovis type 17 phenotype suggests that FadE17-FadE18 ties propionate production from cholesterol to complex lipid biosynthesis. Furthermore, sequences of the multiresistant and totally drug-resistant strains of M. tuberculosis, R1207 and CTRI-4XDR, respectively, both contain single nucleotide polymorphisms (SNPs) in their fadE17 gene sequences. How the SNPs alter FadE17-FadE18 function is not known (34). Importantly, of the four mammalian cell entry (mce) regulons that have been shown to be important for virulence in M. tuberculosis, fadE17-fadE18 belongs to mce3 and is regulated by the Mce3R transcriptional repressor (35). Homologs of fadE17-fadE18 do not exist in many other closely related nonpathogenic Actinobacteria like M. smegmatis, suggesting a role in pathogenesis for this enzyme.
The fadE23 and fadE24 genes (Fig. 4, group IV) are most distantly related to the other ACAD homolog pairs. FadE23 and FadE24 are curiosities, since they both contain a predicted active site glutamic acid, yet only two FAD cofactors bind per tetramer. A recent activity-based protein profiling experiment identified both FadE23 and FadE24 as possibly having the ability to bind ATP (36), hinting that the protein has a catalytic function distinct from acyl-CoA dehydrogenation. Consistent with this hypothesis, FadE23-FadE24 does not dehydrogenate 3β-hydroxy-chol-5-en-24-oyl-CoA. These ACAD genes are upregulated in the presence of the first-line antimycobacterial drug isoniazid (INH). INH causes increased cellular pools of fatty acids. Both genes are downregulated by cholesterol, consistent with the proposal that FadE23 and FadE24 are involved in the recycling of fatty acids (37). Moreover, SigE, which is required for survival in the host in order to counteract environmental stress from the host immune system regulates the expression of the fadE23-fadE24 operon (32).
Although there are 35 fadE genes that are currently annotated in the M. tuberculosis genome (29), this work provides evidence that there are not 35 functional ACAD enzymes. Rather, two adjacent ACAD genes code for a single protein complex, and only this complex is able to bind the FAD cofactor necessary for catalysis. From the 11 cholesterol-regulated fadE genes described in this work, we have demonstrated the existence of 5 holoprotein complexes, and we provide strong evidence for the existence of a 6th (FadE17-FadE18). Although there are 35 fadE open reading frames (ORFs) in the M. tuberculosis genome, there are at most 30 functional ACAD protein complexes, thus shrinking the number of functional enzymes available for catalysis of acyl-CoA dehydrogenation.
In conclusion, we have identified a subfamily of genes that encode α2β2 heterotetrameric ACADs and linked this unusual ACAD protein architecture to the dehydrogenation of steroid-CoA thioester substrates. The transcriptional regulation of α2β2 ACAD gene expression suggests that these ACADs function in four different subpathways of cholesterol metabolism. Two of these subpathways are cholesterol side chain catabolism and cholesterol C/D ring catabolism as demonstrated by previous biochemical experiments. The transcriptional regulation of the α2β2 ACAD genes in the remaining two subpathways suggests that elaboration of cholesterol metabolites plays a role in modulating M. tuberculosis propionate flux and M. tuberculosis response to the host immune system.
Supplementary Material
ACKNOWLEDGMENTS
We acknowledge Rui Lu for providing 3β-hydroxy-chol-5-en-24-oyl-CoA substrate.
This work was supported by the NIH (R21AI092455, R01HL53306, and S10RR021008 to N.S.S.; T32GM092714 to M.Y.), NSF-BIO1039771 (nuclear magnetic resonance [NMR]), and a DOE-GAANN fellowship (S.T.T.).
Footnotes
Published ahead of print 8 July 2013
Supplemental material for this article may be found at http://dx.doi.org/10.1128/JB.00502-13.
REFERENCES
- 1.World Health Organization 2012. Global tuberculosis report 2012 World Health Organization, Geneva, Switzerland [Google Scholar]
- 2.Morens DM, Folkers GK, Fauci AS. 2004. The challenge of emerging and re-emerging infectious diseases. Nature 430:242–249 [DOI] [PMC free article] [PubMed] [Google Scholar]
- 3.Russell DG, Cardona PJ, Kim MJ, Allain S, Altare F. 2009. Foamy macrophages and the progression of the human tuberculosis granuloma. Nature Immunol. 10:943–948 [DOI] [PMC free article] [PubMed] [Google Scholar]
- 4.Kim MJ, Wainwright HC, Locketz M, Bekker LG, Walther GB, Dittrich C, Visser A, Wang W, Hsu FF, Wiehart U, Tsenova L, Kaplan G, Russell DG. 2010. Caseation of human tuberculosis granulomas correlates with elevated host lipid metabolism. EMBO Mol. Med. 2:258–274 [DOI] [PMC free article] [PubMed] [Google Scholar]
- 5.Slayden RA, Jackson M, Zucker J, Ramirez MV, Dawson CC, Crew R, Sampson NS, Thomas ST, Jamshidi N, Sisk P, Caspi R, Crick DC, McNeil MR, Pavelka MS, Niederweis M, Siroy A, Dona V, McFadden J, Boshoff H, Lew JM. 2013. Updating and curating metabolic pathways of TB. Tuberculosis 93:47–59 [DOI] [PMC free article] [PubMed] [Google Scholar]
- 6.Nesbitt NM, Yang X, Fontan P, Kolesnikova I, Smith I, Sampson NS, Dubnau E. 2010. A thiolase of Mycobacterium tuberculosis is required for virulence and production of androstenedione and androstadienedione from cholesterol. Infect. Immun. 78:275–282 [DOI] [PMC free article] [PubMed] [Google Scholar]
- 7.Van der Geize R, Yam K, Heuser T, Wilbrink MH, Hara H, Anderton MC, Sim E, Dijkhuizen L, Davies JE, Mohn WW, Eltis LD. 2007. A gene cluster encoding cholesterol catabolism in a soil actinomycete provides insight into Mycobacterium tuberculosis survival in macrophages. Proc. Natl. Acad. Sci. U. S. A. 104:1947–1952 [DOI] [PMC free article] [PubMed] [Google Scholar]
- 8.Griffin JE, Gawronski JD, Dejesus MA, Ioerger TR, Akerley BJ, Sassetti CM. 2011. High-resolution phenotypic profiling defines genes essential for mycobacterial growth and cholesterol catabolism. PLoS Pathog. 7:e1002251. 10.1371/journal.ppat.1002251 [DOI] [PMC free article] [PubMed] [Google Scholar]
- 9.Yam KC, D'Angelo I, Kalscheuer R, Zhu H, Wang JX, Snieckus V, Ly LH, Converse PJ, Jacobs WR, Jr, Strynadka N, Eltis LD. 2009. Studies of a ring-cleaving dioxygenase illuminate the role of cholesterol metabolism in the pathogenesis of Mycobacterium tuberculosis. PLoS Pathog. 5:e1000344. 10.1371/journal.ppat.1000344 [DOI] [PMC free article] [PubMed] [Google Scholar]
- 10.Lack NA, Yam KC, Lowe ED, Horsman GP, Owen RL, Sim E, Eltis LD. 2010. Characterization of a carbon-carbon hydrolase from Mycobacterium tuberculosis involved in cholesterol metabolism. J. Biol. Chem. 285:434–443 [DOI] [PMC free article] [PubMed] [Google Scholar]
- 11.Yang X, Dubnau E, Smith I, Sampson NS. 2007. Rv1106c from Mycobacterium tuberculosis is a 3beta-hydroxysteroid dehydrogenase. Biochemistry 46:9058–9067 [DOI] [PMC free article] [PubMed] [Google Scholar]
- 12.Knol J, Bodewits K, Hessels GI, Dijkhuizen L, van der Geize R. 2008. 3-Keto-5α-steroid Δ1-dehydrogenase from Rhodococcus erythropolis SQ1 and its orthologue in Mycobacterium tuberculosis H37Rv are highly specific enzymes that function in cholesterol catabolism. Biochem. J. 410:339–346 [DOI] [PubMed] [Google Scholar]
- 13.Capyk JK, D'Angelo I, Strynadka NC, Eltis LD. 2009. Characterization of 3-ketosteroid 9-α-hydroxylase, a Rieske oxygenase in the cholesterol degradation pathway of Mycobacterium tuberculosis. J. Biol. Chem. 284:9937–9946 [DOI] [PMC free article] [PubMed] [Google Scholar]
- 14.Capyk JK, Kalscheuer R, Stewart GR, Liu J, Kwon H, Zhao R, Okamoto S, Jacobs WR, Jr, Eltis LD, Mohn WW. 2009. Mycobacterial cytochrome P450 125 (Cyp125) catalyzes the terminal hydroxylation of C27 steroids. J. Biol. Chem. 284:35534–35542 [DOI] [PMC free article] [PubMed] [Google Scholar]
- 15.Casabon I, Crowe AM, Liu J, Eltis LD. 2013. FadD3 is an acyl-CoA synthetase that initiates catabolism of cholesterol rings C and D in actinobacteria. Mol. Microbiol. 87:269–283 [DOI] [PubMed] [Google Scholar]
- 16.Thomas ST, Sampson NS. 2013. Mycobacterium tuberculosis utilizes a unique heterotetrameric structure for dehydrogenation of the cholesterol side chain. Biochemistry 52:2895–2904 [DOI] [PMC free article] [PubMed] [Google Scholar]
- 17.Thomas ST, VanderVen BC, Sherman DR, Russell DG, Sampson NS. 2011. Pathway profiling in Mycobacterium tuberculosis: elucidation of cholesterol-derived catabolite and enzymes that catalyze its metabolism. J. Biol. Chem. 286:43668–43678 [DOI] [PMC free article] [PubMed] [Google Scholar]
- 18.Ouellet H, Johnston JB, Ortiz de Montellano PR. 2010. The Mycobacterium tuberculosis cytochrome P450 system. Arch. Biochem. Biophys. 493:82–95 [DOI] [PMC free article] [PubMed] [Google Scholar]
- 19.Kim JJ, Battaile KP. 2002. Burning fat: the structural basis of fatty acid beta-oxidation. Curr. Opin. Struct. Biol. 12:721–728 [DOI] [PubMed] [Google Scholar]
- 20.Artimo P, Jonnalagedda M, Arnold K, Baratin D, Csardi G, de Castro E, Duvaud S, Flegel V, Fortier A, Gasteiger E, Grosdidier A, Hernandez C, Ioannidis V, Kuznetsov D, Liechti R, Moretti S, Mostaguir K, Redaschi N, Rossier G, Xenarios I, Stockinger H. 2012. ExPASy: SIB bioinformatics resource portal. Nucleic Acids Res. 40:W597–W603 [DOI] [PMC free article] [PubMed] [Google Scholar]
- 21.Lehman TC, Hale DE, Bhala A, Thorpe C. 1990. An acyl-coenzyme A dehydrogenase assay utilizing the ferricenium ion. Anal. Biochem. 186:280–284 [DOI] [PubMed] [Google Scholar]
- 22.Lehman TC, Thorpe C. 1990. Alternate electron acceptors for medium-chain acyl-CoA dehydrogenase: use of ferricenium salts. Biochemistry 29:10594–10602 [DOI] [PubMed] [Google Scholar]
- 23.Tamura K, Peterson D, Peterson N, Stecher G, Nei M, Kumar S. 2011. MEGA5: Molecular Evolutionary Genetics Analysis using maximum likelihood, evolutionary distance, and maximum parsimony methods. Mol. Biol. Evol. 28:2731–2739 [DOI] [PMC free article] [PubMed] [Google Scholar]
- 24.Tiffany KA, Roberts DL, Wang M, Paschke R, Mohsen AW, Vockley J, Kim JJ. 1997. Structure of human isovaleryl-CoA dehydrogenase at 2.6 Å resolution: structural basis for substrate specificity. Biochemistry 36:8455–8464 [DOI] [PubMed] [Google Scholar]
- 25.Djordjevic S, Dong Y, Paschke R, Frerman FE, Strauss AW, Kim JJ. 1994. Identification of the catalytic base in long chain acyl-CoA dehydrogenase. Biochemistry 33:4258–4264 [DOI] [PubMed] [Google Scholar]
- 26.Weintraub H, Vincent F, Baulieu EE, Alfsen A. 1977. Interaction of steroids with Pseudomonas testosteroni 3-oxosteroid delta4–delta5-isomerase. Biochemistry 16:5045–5053 [DOI] [PubMed] [Google Scholar]
- 27.Arfmann H, Timmis KN, Wittich R. 1997. Mineralization of 4-chlorodibenzofuran by a consortium consisting of Sphingomonas sp. strain RW1 and Burkholderia sp. strain JWS. Appl. Environ. Microbiol. 63:3458–3462 [DOI] [PMC free article] [PubMed] [Google Scholar]
- 28.Horinouchi M, Hayashi T, Yamamoto T, Kudo T. 2003. A new bacterial steroid degradation gene cluster in Comamonas testosteroni TA441 which consists of aromatic-compound degradation genes for seco-steroids and 3-ketosteroid dehydrogenase genes. Appl. Environ. Microbiol. 69:4421–4430 [DOI] [PMC free article] [PubMed] [Google Scholar]
- 29.Cole ST, Brosch R, Parkhill J, Garnier T, Churcher C, Harris D, Gordon SV, Eiglmeier K, Gas S, Barry CE, III, Tekaia F, Badcock K, Basham D, Brown D, Chillingworth T, Connor R, Davies R, Devlin K, Feltwell T, Gentles S, Hamlin N, Holroyd S, Hornsby T, Jagels K, Krogh A, McLean J, Moule S, Murphy L, Oliver K, Osborne J, Quail MA, Rajandream MA, Rogers J, Rutter S, Seeger K, Skelton J, Squares R, Squares S, Sulston JE, Taylor K, Whitehead S, Barrell BG. 1998. Deciphering the biology of Mycobacterium tuberculosis from the complete genome sequence. Nature 393:537–544 [DOI] [PubMed] [Google Scholar]
- 30.Kendall SL, Withers M, Soffair CN, Moreland NJ, Gurcha S, Sidders B, Frita R, Ten Bokum A, Besra GS, Lott JS, Stoker NG. 2007. A highly conserved transcriptional repressor controls a large regulon involved in lipid degradation in Mycobacterium smegmatis and Mycobacterium tuberculosis. Mol. Microbiol. 65:684–699 [DOI] [PMC free article] [PubMed] [Google Scholar]
- 31.Kendall SL, Burgess P, Balhana R, Withers M, Ten Bokum A, Lott JS, Gao C, Uhia-Castro I, Stoker NG. 2010. Cholesterol utilization in mycobacteria is controlled by two TetR-type transcriptional regulators: KstR and KstR2. Microbiology 156:1362–1371 [DOI] [PMC free article] [PubMed] [Google Scholar]
- 32.Fontan PA, Aris V, Alvarez ME, Ghanny S, Cheng J, Soteropoulos P, Trevani A, Pine R, Smith I. 2008. Mycobacterium tuberculosis sigma factor E regulon modulates the host inflammatory response. J. Infect. Dis. 198:877–885 [DOI] [PubMed] [Google Scholar]
- 33.Wheeler PR, Brosch R, Coldham NG, Inwald JK, Hewinson RG, Gordon SV. 2008. Functional analysis of a clonal deletion in an epidemic strain of Mycobacterium bovis reveals a role in lipid metabolism. Microbiology 154:3731–3742 [DOI] [PubMed] [Google Scholar]
- 34.Ilina EN, Shitikov EA, Ikryannikova LN, Alekseev DG, Kamashev DE, Malakhova MV, Parfenova TV, Afanas'ev MV, Ischenko DS, Bazaleev NA, Smirnova TG, Larionova EE, Chernousova LN, Beletsky AV, Mardanov AV, Ravin NV, Skryabin KG, Govorun VM. 2013. Comparative genomic analysis of Mycobacterium tuberculosis drug resistant strains from Russia. PLoS One 8:e56577. 10.1371/journal.pone.0056577 [DOI] [PMC free article] [PubMed] [Google Scholar]
- 35.Santangelo MP, Blanco FC, Bianco MV, Klepp LI, Zabal O, Cataldi AA, Bigi F. 2008. Study of the role of Mce3R on the transcription of mce genes of Mycobacterium tuberculosis. BMC Microbiol. 8:38. 10.1186/1471-2180-8-38 [DOI] [PMC free article] [PubMed] [Google Scholar]
- 36.Ansong C, Ortega C, Payne SH, Haft DH, Chauvigne-Hines LM, Lewis MP, Ollodart AR, Purvine SO, Shukla AK, Fortuin S, Smith RD, Adkins JN, Grundner C, Wright AT. 2013. Identification of widespread adenosine nucleotide binding in Mycobacterium tuberculosis. Chem. Biol. 20:123–133 [DOI] [PMC free article] [PubMed] [Google Scholar]
- 37.Wilson M, DeRisi J, Kristensen HH, Imboden P, Rane S, Brown PO, Schoolnik GK. 1999. Exploring drug-induced alterations in gene expression in Mycobacterium tuberculosis by microarray hybridization. Proc. Natl. Acad. Sci. U. S. A. 96:12833–12838 [DOI] [PMC free article] [PubMed] [Google Scholar]
- 38.de la Paz Santangelo M, Klepp L, Nunez-Garcia J, Blanco FC, Soria M, Garcia-Pelayo MC, Bianco MV, Cataldi AA, Golby P, Jackson M, Gordon SV, Bigi F. 2009. Mce3R, a TetR-type transcriptional repressor, controls the expression of a regulon involved in lipid metabolism in Mycobacterium tuberculosis. Microbiology 155:2245–2255 [DOI] [PubMed] [Google Scholar]
- 39.Parish T, Smith DA, Roberts G, Betts J, Stoker NG. 2003. The senX3-regX3 two-component regulatory system of Mycobacterium tuberculosis is required for virulence. Microbiology 149:1423–1435 [DOI] [PubMed] [Google Scholar]
- 40.Lee HJ, Wang M, Paschke R, Nandy A, Ghisla S, Kim JJ. 1996. Crystal structures of the wild type and the Glu376Gly/Thr255Glu mutant of human medium-chain acyl-CoA dehydrogenase: influence of the location of the catalytic base on substrate specificity. Biochemistry 35:12412–12420 [DOI] [PubMed] [Google Scholar]
- 41.Shannon P, Markiel A, Ozier O, Baliga NS, Wang JT, Ramage D, Amin N, Schwikowski B, Ideker T. 2003. Cytoscape: a software environment for integrated models of biomolecular interaction networks. Genome Res. 13:2498–2504 [DOI] [PMC free article] [PubMed] [Google Scholar]
Associated Data
This section collects any data citations, data availability statements, or supplementary materials included in this article.