

Abstract
The mineralization of organic matter in anoxic environments relies on the cooperative activities of hydrogen producers and consumers obligately linked by interspecies metabolite exchange in syntrophic consortia that may include sulfate reducing species such as Desulfovibrio. To evaluate the metabolic flexibility of syntrophic Desulfovibrio to adapt to naturally fluctuating methanogenic environments, we studied Desulfovibrio alaskensis strain G20 grown in chemostats under respiratory and syntrophic conditions with alternative methanogenic partners, Methanococcus maripaludis and Methanospirillum hungatei, at different growth rates. Comparative whole-genome transcriptional analyses, complemented by G20 mutant strain growth experiments and physiological data, revealed a significant influence of both energy source availability (as controlled by dilution rate) and methanogen on the electron transfer systems, ratios of interspecies electron carriers, energy generating systems, and interspecies physical associations. A total of 68 genes were commonly differentially expressed under syntrophic versus respiratory lifestyle. Under low-energy (low-growth-rate) conditions, strain G20 further had the capacity to adapt to the metabolism of its methanogenic partners, as shown by its differing gene expression of enzymes involved in the direct metabolic interactions (e.g., periplasmic hydrogenases) and the ratio shift in electron carriers used for interspecies metabolite exchange (hydrogen/formate). A putative monomeric [Fe-Fe] hydrogenase and Hmc (high-molecular-weight-cytochrome c3) complex-linked reverse menaquinone (MQ) redox loop become increasingly important for the reoxidation of the lactate-/pyruvate oxidation-derived redox pair, DsrCred and Fdred, relative to the Qmo-MQ-Qrc (quinone-interacting membrane-bound oxidoreductase; quinone-reducing complex) loop. Together, these data underscore the high enzymatic and metabolic adaptive flexibility that likely sustains Desulfovibrio in naturally fluctuating methanogenic environments.
INTRODUCTION
In anoxic environments depleted in inorganic electron acceptors (e.g., freshwater and marine sediments, flooded soils, landfills and sewage digestors) the complete mineralization of complex organic matter to CO2 and methane relies on the cooperative activities of phylogenetically and metabolically distinct microbial groups assembled in syntrophic consortia (1–3). In these assemblages, sulfate-reducing bacteria (SRB) such as Desulfovibrio species function as secondary fermenters obligately linked via interspecies electron transfer to the metabolic activity of methanogenic archaea, since the oxidation of common substrates (organic acids and alcohols) only yields sufficient energy for cell maintenance and growth when the methanogens maintain low concentrations of the SRB metabolites (1–3). Hydrogen and formate are considered to be the primary shuttle compounds for interspecies electron transfer in methanogenic consortia (1–3). Exclusive use of H2 as an electron carrier has been proven for several syntrophs, while a combined formate/H2 electron shuttling has been confirmed in propionate- and butyrate-degrading cocultures (2, 4–10). Since syntrophic communities exist in conditions close to thermodynamic equilibrium and metabolite exchange is considered to occur primarily via diffusion (1–4, 11), intermicrobial distances influence the efficiency of interspecies transfer (especially for H2), which affects the growth and biodegradation rates of these consortia (2, 6, 11–13). To ensure close proximity, cell aggregates of high complexity are often formed (e.g., sludge granules in anaerobic reactors) (11–13) with flagellar proteins having a putative role in triggering syntrophic interaction (14). In a previous comparative study of two Desulfovibrio species (Desulfovibrio alaskensis strain G20 and Desulfovibrio vulgaris strain Hildenborough) growing in lactate-based continuous coculture with Methanococcus maripaludis, we demonstrated that their various syntrophic growth characteristics are genetically and metabolically based on the involvement of different electron-transferring enzyme systems and interspecies electron carriers used for syntrophic growth with the same methanogenic partner (15). Faster growth of the strain G20 pairing was associated with two factors: (i) a kinetic advantage conferred by electron transfer through a redox loop consisting of a quinone-interacting membrane-bound oxidoreductase, Qmo (16), and a quinone-reducing complex, Qrc (17), that permits higher lactate oxidation rates at elevated H2 levels, thereby enhancing growth of M. maripaludis, and (ii) use of formate as the main electron exchange mediator (>70% electron flux) via periplasmic formate dehydrogenases (as opposed to the exclusively H2-based exchange used by strain Hildenborough). Thus, Desulfovibrio species have evolved different adaptive strategies for growth in environments that fluctuate in electron acceptor availability, as shown by the absence of a conserved pool of genes that are essential to sustain syntrophy (15).
Differences in adaptive strategy may also in part be associated with the syntrophic partner. At low substrate levels, the specific growth rate of mutualistic cultures were shown to depend upon the hydrogen affinity of the methanogen, as given by the substrate saturation constant (Ks) for H2 and its maximum specific growth rate in axenic culture on hydrogen (18). At low H2 concentrations, methanogenesis becomes fully coupled to growth yield (19, 20). The importance of the methanogenic partner was indicated by our initial batch culture analyses, showing that each Desulfovibrio species varied significantly in its growth characteristics (growth rate, yield, and population structure) when syntrophically paired with different hydrogenotrophic methanogens (B. Meyer, unpublished results). Thus, these physiological differences among methanogens, which may in part be determined by variation in electron transfer complexes coupled to the use of either H2 or formate at low concentrations (21–24), are expected to influence the metabolism of their syntrophic partner and, by inference, the fitness of the pairing.
Several model organisms (Syntrophobacter, Syntrophomonas [3–5, 9, 10], and Desulfovibrio [25] species) have been investigated to develop an understanding of the biochemistry and genetics of syntrophic growth. However, with only two notable exceptions (26, 27), these studies have been based almost exclusively on batch culture growth. However, the complex dynamics of growth in batch culture complicates the resolution of processes related to growth rate from those of syntrophic association. Thus, in the present study we used chemostats to examine both the impact of energy source availability (controlled by dilution rate) and the methanogenic partner on the syntrophic metabolism and energetics of Desulfovibrio species: D. alaskensis strain G20 was grown in sulfate-limited monoculture, as well as in coculture, at different growth rates (0.047 and 0.027 h−1) and with two different methanogenic partners, Methanococcus maripaludis and Methanospirillum hungatei, in chemostats. Comparative whole-genome transcriptional analyses, complemented by G20 mutant strain growth experiments and physiological data, revealed distinctive differences in the electron transfer systems, ratios of interspecies electron carriers, and energy conservation mechanisms associated with growth rate and methanogenic partner. Together, these data underscore the high enzymatic and metabolic adaptive flexibility that likely sustains Desulfovibrio in naturally fluctuating methanogenic environments.
MATERIALS AND METHODS
Microorganisms.
The wild-type strains D. alaskensis G20, M. maripaludis S2 (28, 29), and M. hungatei JF-1 (30, 31) used to establish the initial cocultures were obtained from the American Type Culture Collection (ATCC). A total of 26 D. alaskensis G20 transposon mutant strains were investigated in comparative phenotypic growth experiments (Table 1; for a detailed list of the mutant strains used in the present study, see Table S1 in the supplemental material).
Table 1.
Gene expression of hydrogenases, formate dehydrogenases, membrane-bound electron transfer complexes, and putative lactate oxidation pathway enzymes in Desulfovibrio alaskensis G20 during syntrophic growth with Methanococcus maripaludis and Methanospirillum hungatei
| Redox proteins in D. alaskensis G20a | Gene locus tag(s)b | Mutant growth in coculturec | Microarray data |
|||||
|---|---|---|---|---|---|---|---|---|
| Log2
R (syntrophy vs sulfate respiration)d |
Absolute log2e |
|||||||
|
M. maripaludis |
M. hungatei |
M. maripaludis |
M. hungatei | |||||
| 0.047 h−1 | 0.027 h−1 | 0.027 h−1 | 0.047 h−1 | 0.027 h−1 | 0.027 h−1 | |||
| Hydrogenases | ||||||||
| Periplasmic | ||||||||
| HynBA [NiFe] | Dde_2137-Dde_2138 | +/− | ++ | ++ | − | + | + | +/− |
| HynBAC3 | Dde_3754-Dde_3756 | − | +/− | +/− | − | − | − | |
| HysBA [NiFeSe] | Dde_2134-Dde_2135 | † | − | − | − | − | − | + |
| HydAB [FeFe] | Dde_0081-Dde_0082 | +/− | +/− | +/ | +/ | +/ | +/ | − |
| Dde_2280-Dde_2281 | +/− | +/− | + | +/ | +/− | +/− | − | |
| Cytoplasmic | ||||||||
| [FeFe] monomeric Fd-dependent | Dde_0725 | − | +/ | +/ | + | + | + | |
| Carbon monoxide dehydrogenase | ||||||||
| Cytoplasmic | ||||||||
| CooSC | Dde_3028-Dde_3029 | +/− | − | +/− | + | + | + | ++ |
| Formate dehydrogenases | ||||||||
| Periplasmic | ||||||||
| FdhAB | Dde_0716-Dde_0718 | − | ++ | ++ | ++ | + | + | ++ |
| Dde_0812-Dde_0813 | +/− | +/− | +/− | − | − | − | − | |
| Dde_3513-Dde_3514 | +/− | − | +/− | +/− | − | − | − | |
| FdhABC3 | Dde_0680-Dde_0683 | +/− | +/− | +/− | +/− | +/− | +/− | +/− |
| Cytoplasmic | ||||||||
| FhcABCD | Dde_0473-Dde_0476 | +/− | − | +/− | +/− | − | − | − |
| Periplasmic cytochromes | ||||||||
| Cytochrome c3 (TpIc3) CycA | Dde_3182 | − | ++ | ++ | ++ | ++ | ++ | |
| Split-Soret cytochrome c | Dde_3211 | ++ | ++ | ++ | + | + | ++ | |
| METC | ||||||||
| QrcABCD | Dde_2932-Dde_2935 | − | + | +/− | + | + | + | + |
| HmcABCDEF | Dde_0648-Dde_0653 | −/† | +/− | +/− | +/ | +/ | + | + |
| DhcARnfCDGEAB | Dde_0580-Dde_0586 | +/− | − | − | +/− | +/− | +/− | |
| QmoABC-D | Dde_1111-Dde_1114 | − | + | − | − | + | + | + |
| DsrMKJOP | Dde_2271-Dde_2275 | +/− | − | − | + | +/− | +/− | |
| TmcABCD | Dde_3707-Dde_3710 | − | − | − | − | − | − | |
| Carbon metabolism enzymes | ||||||||
| Pyruvate-oxidoreductase | ||||||||
| Por | Dde_3237 | − | + | + | ++ | ++ | ++ | |
| PorAB | Dde_1792-Dde_1793 | +/− | − | − | +/ | +/ | +/− | |
| d-Lactate permease | ||||||||
| LctP-1 | Dde_1074 | † | ++ | ++ | ++ | + | + | + |
| LctP-2 | Dde_3238 | † | + + | + | + | + | + | + |
| l-Lactate dehydrogenase | ||||||||
| l-Ldh | Dde_0750 | − | − | +/− | +/− | +/− | +/− | |
| d-Lactate dehydrogenase (monomeric) | ||||||||
| d-Ldh | Dde_3604 | +/− | − | − | +/− | − | − | |
| GlcD | Dde_0182 | − | +/− | +/− | − | − | +/− | |
| d-LdhA | Dde_1681 | +/− | − | − | +/− | +/− | +/− | |
| d/l-Lactate dehydrogenase (with HdrD-like subunits) | ||||||||
| LldEFG | Dde_1842-Dde_1844 | +/ | − | − | +/ | +/ | +/− | |
| LdhA + Ldh-HdrD-1 (LdhB-1) | Dde_3239-Dde_3240 | † | ++ | + | ++ | ++ | ++ | ++ |
| Ldh3 | Dde_1085-Dde_1087 | − | +/− | +/− | − | − | − | |
| Phosphotransacetylase Pta | Dde_3241 | ++ | +/− | + | ++ | ++ | ++ | |
| Acetate kinase AckA | Dde_3242 | + | + | + | + | ++ | ++ | |
| Pyruvate formate lyase Pfl-I | Dde_1273 | +/− | − | − | − | − | − | − |
| NADH oxidase Nox | Dde_0374 | − | − | − | − | +/− | +/− | +/− |
| Hdr-like proteins | ||||||||
| HdrABC-FloxABCD | Dde_1207-Dde_1213 | − | − | − | +/− | +/− | +/− | |
| Dde_3523-Dde_3530 | − | +/− | +/− | − | − | − | ||
| Ldh-HdrD-2 (LdhB-2) | Dde_3245 | † | ++ | + | + | + | ++ | |
| FAD-HdrD | Dde_0312 | − | +/ | − | − | +/− | +/− | +/− |
| Mop-HdrD | Dde_3540 | − | − | − | − | − | − | |
| Cytoplasmic electron carrier | ||||||||
| Ferredoxin II | Dde_0286 | ++ | ++ | +/ | ++ | ++ | + | |
| DsrC (thiol/disulfide redox pair) | Dde_0762 | − | − | − | ++ | ++ | ++ | |
Gene annotation according to http//www.microbesonline.org (87), Pereira et al. (39), and Keller and Wall (38).
D. alaskensis G20 transposon insertion mutants of respective genes investigated in comparative growth experiments are indicated in boldface.
Mutant growth in coculture with M. hungatei on lactate is summarized as follows: +/−, growth identical to reference mutant strain Dde_1072; −, inhibited growth relative to the reference strain; and †, no growth observed.
Log2R of gene expression of D. alaskensis G20 grown in coculture with M. maripaludis or M. hungatei (30 mM lactate) versus D. alaskensis G20 grown in monoculture (30 mM lactate, 10 mM sulfate) at dilution rates of 0.047 h−1 and 0.027 h−1 (log2R values for enzymes or protein complexes are summarized as follows: ++, log2R > 1; +, log2R > 0.5; +/−, log2R > 0; and −, log2R < −0.5).
Absolute log2 values (normalized with a median of 0) of D. alaskensis G20 grown in coculture with M. maripaludis or M. hungatei at dilution rates of 0.047 h−1 and 0.027 h−1 (++, absolute log2 > 4; +, absolute log2 > 2; +/−, absolute log2 > 0; −, absolute log2 < −0.5).
Mono- and coculture medium composition for chemostat and batch cultures.
The basal salt solution of the media was described earlier (26) and contained 30 mM sodium d,l-lactate or sodium pyruvate, resazurin as a redox indicator, and 10 mM Na2SO4 (chemostat monoculture media) or 30 mM Na2SO4 (batch monoculture media). The media were prepared in bioreactor glass vessels (2 liters), medium reservoir bottles (10 liters), and Widdel flasks (1 and 2 liters) anoxically under an N2-CO2 (80:20, vol/vol) gas atmosphere according to the method of Widdel and Bak (32). The media were buffered using 1.1 mM KH2PO4 and 30 mM NaHCO3. Nonchelated trace element mixture 1 and selenite-tungstate solution, as well as vitamin mixture, riboflavin, vitamin B1 and B12 solutions and 1 M Na2S solution (32), were added aseptically in 1-ml aliquots per liter of medium. All stock solutions were prepared under anoxic conditions as described previously (32). For batch culture cultivation, the media were dispensed anoxically in sterile N2-CO2 (80:20 [vol/vol]) pregassed 250-ml serum bottles or 25-ml Balch tubes in 130- and 13-ml aliquots, respectively. After preparation, the bioreactor and medium reservoir bottles were connected to a N2-CO2 (90:10 [vol/vol]) gas mixture tank.
Chemostat operation conditions.
A 0.5-ml inoculum from a glycerol stock of a previously grown coculture (D. alaskensis G20 paired either with M. maripaludis or M. hungatei, tenth transfer generation) or monoculture was used to inoculate 130 ml of medium in 250-ml serum bottles. Cultures were incubated at 37°C in a shaking incubator (300 rpm) until reaching an optical density at 600 nm (OD600) of 0.3 or 0.26 ± 0.02 (for M. hungatei coculture pairing). A 100-ml inoculum was added to a 2.45 liter bioreactor vessel (FairMenTec 2.3 l model, Göttingen, Germany, and Electrolab FerMac 300 Series, Tewkesbury, United Kingdom) containing 2 liters of culture media. Three biological replicates of each coculture pairing and sulfate-limited D. alaskensis G20 monocultures were grown in chemostats. After inoculation, chemostats were initially run in batch mode at 37°C with stirring at 250 rpm. The headspace of the bioreactor was flushed through a sterile 0.2 micron syringe filter with N2-CO2 (90:10, [vol/vol]) at a constant rate of 1 ml/min using a mass and volumetric precision gas flow controller (MC-20 Series; Alicat Scientific, Tucson, AZ). The pH was maintained at 7.0 ± 0.1 by using bicarbonate buffer and small additions of 0.1 M NaOH or HCl as needed. Headspace gas levels of N2, O2, CH4, H2, and CO were measured at time intervals of 1 to 10 h using an SRI 8610SC gas chromatograph (GC) with thermal conductivity and reducing gas detectors (analytical column: molecular sieve MS-5A, 6 ft; carrier gas: 4.7 laser grade helium at 20 ml/min). Organic acid concentrations (lactate, acetate, and formate) were determined using a Dionex DX500 ionic chromatograph model LC20-1 (analytical column IonPac AS11-HC, eluent 0.75 to 40 mM NaOH, CD20 conductivity detector), whereas ethanol and glycerol were measured enzymatically as described elsewhere (33). The chemostat mode was initiated after the optical density OD600 reached 0.29 or 0.25 ± 0.01 (for M. hungatei containing coculture) and maintained at a dilution rate of 0.027 h−1. Coculture samples were taken regularly for direct cell counting (Petroff-Hauser counting chamber). Cells were harvested after three retention periods with an OD600 variance of <10% by using an ice-chilled sterile stainless steel tube connected to the chemostat medium exhaust line that allowed a cell suspension transfer with minimal O2-contact into pregassed, ice-chilled Falcon tubes (50 ml). After centrifugation for 15 min at 3,220 × g at 4°C, the supernatant was carefully poured off, and the cell pellets were immediately frozen at −80°C.
For the qualitative and quantitative investigation of the interspecies electron mediators in coculture, the methanogen was specifically inhibited by manually adding 5 mM bromoethanosulfonate (BES) to the chemostat and medium reservoir bottle after three volume turnovers at constant OD600 values. The OD600, organic acids, and gas levels were monitored at short time intervals for 24 h after BES addition, as described above. Based on the data of the first 3 h after BES addition, the electron flow ratio through each electron carrier during syntrophic lactate conversion has been calculated according to the following equation (simplified): % electron flow through electron carrier (HCOO−/H2/CO) from lactate oxidation = [Δnelectron of electron carrier formed/(nelectron of lactate inflow − nelectron of lactate outflow − Δnelectron of methane formed)] × 100, where nelectron is the number of electrons in moles and Δnelectron is the difference of electrons in moles. Only electrons available from conversion of lactate to acetate (four electrons per lactate molecule) were taken into consideration. The parameters for the chemostat runs were 30 mM lactate in the culture media, a dilution rate of 0.027 h−1, and a 1-ml/min gas flow rate.
Whole-genome transcriptional analysis.
Microarray gene expression measurements were performed on three biological replicates of coculture and monoculture chemostats. Total RNA was extracted from frozen cell paste (stored at −80°C) using the RNeasy kit according to the manufacturer's protocol but omitting the lysozyme cell wall digestion step. Total RNA concentration and quality were determined using an RNA nanochip run on a Bioanalyzer (Agilent, Santa Clara, CA). We generated first strand cDNA using the SuperScript Indirect cDNA Labeling System (Life Technologies, Carlsbad, CA) with random hexamers. The cDNA was labeled with Alexa 555 (Life Technologies). Labeled cDNA (∼1 μg per slide) was hybridized to a custom Nimblegen microarray containing four independent microarrays comprised of 72,000 probes each (60-mers). The vast majority of genes are represented by nine unique oligonucleotide probes, with each probe arrayed in duplicate. After overnight incubation in a hybridization station (Maui), slides were washed using the standard Nimblegen protocol. Microarrays were scanned using a GenPix Pro 4200A according to the Nimblegen recommendations. Arrays were scanned at a minimum of three PMT (photomultiplier tube) gains. The scanned array images were analyzed for probe intensities using the Nimblegen Scan v2.4, with the local alignment turned off and a border of −1. Feature files containing the probe intensities and probe identifiers were exported for further analysis. PMT settings were used with ∼1% of probes being above half of the maximum value. Each scan was normalized by forcing the distribution of values to conform to the distribution of log2 intensities of monoculture control chemostats (average of two monoculture chemostats). After excluding probes that were in the lowest 2% of the control, initial log2 levels were computed by averaging across replicate spots of each probe, and the log2 ratio median was set to zero. To remove intensity-dependent effects, we used local regression (Loess in R) of each probe's log2 ratio versus the log2 level and subtracted out these estimated effects. To assess whether genes had statistically significant changes in expression, we used OpWise (34), which uses the correlation of expression of genes in predicted operons to estimate the reliability of bacterial expression data.
Phenotypic growth analyses of strain G20 transposon mutants.
The complete description and validation of a D. alaskensis G20 transposon mutant collection is in preparation and will be described elsewhere (A. Deutschbauer and A. Arkin, unpublished data). For each of the 26 mutant strains used here, the insertion of the transposon was determined by a two-step arbitrary PCR protocol (35) and further confirmed by PCR amplification with a transposon- and genome-specific primer pair.
Endpoint dilution monocultures from glycerol stocks of M. hungatei, D. alaskensis G20 wild-type and mutant strains were used to initiate all pairings (methanogen was grown in media containing only 5 mM acetate with an H2-CO2 [80:20, vol/vol] headspace at an overpressure of 20 lb/in2). Cocultures were established by mixing 1 ml of the highest dilution of the D. alaskensis G20 wild type or an insertion mutant strain with 1 ml of the highest dilution of M. hungatei in 13 ml of coculture medium in Balch tubes. Initial batch mono- and cocultures were transferred at least two times (1% [vol/vol]) before inoculation of triplicate tubes for monitoring growth (OD600) using uninoculated medium as a reference. All cultures were incubated at 37°C with horizontal shaking at 300 rpm.
Microarray data accession number.
The microarray data are available under GEO reference GSE46547.
RESULTS
Growth characteristics of D. alaskensis G20 chemostat cocultures with different methanogenic partners and growth rates.
In a previous study (15), continuous cultures of D. alaskensis G20 were grown on 30 mM lactate in monoculture (10 mM sulfate added) and coculture with M. maripaludis at a high dilution rate of 0.047 h−1 (the maximum growth rate of this coculture pairing in chemostat is 0.051 h−1). The impact of growth rate and methanogenic partner on syntrophic assemblies was investigated by running additional chemostats with D. alaskensis G20 grown in monoculture or coculture with different methanogens (M. maripaludis or M. hungatei) at a low dilution rate of 0.027 h−1 (close to the maximum growth rate of the M. hungatei coculture pairing at 0.031 h−1 [see Table 2]). Notably, the latter pairing showed an extended lag phase by ∼50 h compared to the M. maripaludis containing coculture and reached only a maximum OD600 of 0.25 ± 0.01 before the start of the chemostat growth (Fig. 1 and 2). The coculture cell ratios stabilized at ratios of ∼1.0 (Desulfovibrio:Methanococcus) and ∼1.2 (Desulfovibrio:Methanospirillum), respectively (Fig. 1). Scanning electron microscopy (SEM) imaging of cell suspensions at steady state demonstrated the Desulfovibrio-methanogen interactions to be localized predominantly at the Desulfovibrio cell poles, whereas a general increase in cell aggregation (EPS formation) was observed compared to growth at a rate of 0.047 h−1 (see Fig. S2 in the supplemental material). The lactate level remained close to, or below, the detection limit (0.05 mM) during chemostat growth, indicating complete utilization of the added lactate (Fig. 2). Acetate was the dominant fermentation product (26 to 28 mM), while no other organic acids, ethanol, or glycerol were detected. After an initial hydrogen burst (fermentation burst [1–3], prolonged in the M. hungatei coculture pairing with occasionally measurable formate levels), the H2 concentration dropped to constant levels of between 280 and 400 ppm for the M. maripaludis coculture pairings and between 70 and 110 ppm for the M. hungatei coculture pairings. In contrast, the carbon monoxide concentration increased slowly during batch growth to final concentrations of 8 ppm (M. maripaludis) or 5 ppm (M. hungatei) throughout the run (Fig. 3). Measurable methane formation started within 10 to 15 h (M. maripaludis) or 45 to 50 h (M. hungatei) after inoculation comprising ∼35% of the headspace gas phase during chemostat operation (Fig. 3; gas level fluctuations are most likely attributable to manual sampling and GC injection). Notably, in the coculture chemostats in which the methanogen metabolic activity was inhibited by BES (following growth stabilization after at least three retention periods), formate could be detected within the first hour after treatment (0.1 and 0.05 mM for the M. maripaludis and M. hungatei cocultures, respectively), accumulating to more than 0.3 and 0.2 mM, respectively, within the next 2 h (Fig. 2). The inhibition of the methanogen by BES was confirmed by an immediate drop in the OD, a decrease in acetate, an increase in lactate, and an exponential decline in methane levels (Fig. 2 and 3). The later was consistent with the calculated gas exchange rate based on a 1-ml/min gas flow through the bioreactor headspace. The accumulation of formate so shortly after BES treatment is a strong indicator that formate is an important mediator in the interspecies electron exchange in cocultures of D. alaskensis G20 irrespective of the growth rate and methanogenic partner. An approximate calculation of the syntrophic electron flow at 0.027 h−1 growth rate (based on the formate, H2, and CO production immediately following methanogen inhibition [data were obtained from at least two replicate experiments]) points to a transfer of reducing equivalents of >63.5% as formate (less than 36% and 0.5% as H2 and CO, respectively). Notably, the M. hungatei coculture shuttled more electrons via H2 compared to M. maripaludis (Table 3). Both methanogens are capable of growing on formate-acetate; however, their growth rates on formate are generally slower compared to growth on H2-acetate (Fig. 4). No methane production or significant growth was observed for either methanogen on carbon monoxide-acetate. Irrespective of the substrate, M. hungatei showed an extended lag phase and lower growth rate and biomass yield, but a slightly higher total methane production compared to M. maripaludis.
Table 2.
Growth characteristics of D. alaskensis G20 cocultures on 30 mM lactate in chemostat with different methanogens and dilution ratesa
| Parameter | Coculture pairing/dilution rate |
||
|---|---|---|---|
| G20 + M. maripaludis |
G20 + M. hungatei |
||
| 0.047 h−1 | 0.027 h−1 | 0.027 h−1 | |
| Batch mode growth | |||
| Maximum growth rate | 0.051 h−1 | 0.051 h−1 | 0.031 h−1 |
| Mean maximum OD600 ± SD | 0.30 ± 0.01 | 0.30 ± 0.01 | 0.25 ± 0.01 |
| Chemostat | |||
| Start after inoculation (h) | 60–65 | 60–65 | 105–120 |
| Mean OD600 at steady state ± SD | 0.29 ± 0.01 | 0.25 ± 0.01 | 0.21 ± 0.01 |
| Cell ratio (Desulfovibrio/methanogen) | 1.4 | 1.0 | 1.2 |
| Organic acid concn (mM) | |||
| Lactate | < 0.05 | < 0.05 | < 0.05 |
| Acetate | 26–28 | 26–28 mM | 26–28 |
| Formate | NDb | ND | ND |
| Gas content | |||
| Methane (%) | 50–60 | 30–40 | 30–40 |
| Hydrogen (ppm) | 350–550 | 280–400 | 70–110 |
| Carbon monoxide (ppm) | 10–15 | 7–9 | 4–6 |
Average values of three replicate chemostats for each pairing/growth rate are shown.
ND, no data (below the detection limit of IC).
Fig 1.

Growth characteristics of D. alaskensis G20 grown in coculture with either M. maripaludis (A) or M. hungatei (B) in chemostats at a dilution rate of 0.027 h−1. The optical density (dashed line, ×), D. alaskensis G20 (♢), methanogen (□), and total cell number (△) are shown for a single coculture replicate. The continuous coculture was started at 65 or 110 h, respectively (indicated by arrow).
Fig 2.
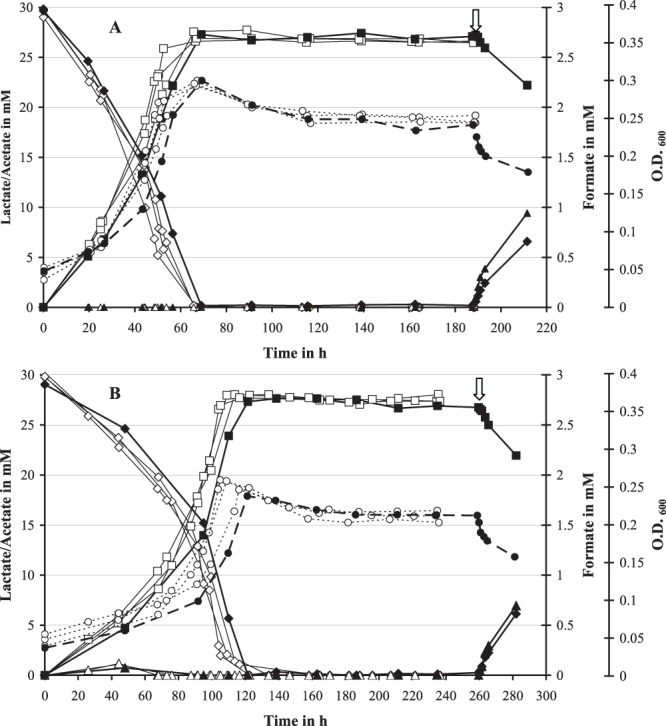
Optical density (○, ●), lactate (♢, ◆), acetate (□, ■), and formate (△, ▲) profiles for three coculture replicates of D. alaskensis G20 grown in coculture with either M. maripaludis (A) or M. hungatei (B) in chemostats (open symbols). The coculture chemostat of each pairing that was treated with 5 mM BES after three volume turnovers at 0.027 h−1 dilution rate is marked by closed symbols (time point of BES addition is marked by arrow).
Fig 3.

Methane (□, ■), hydrogen (♢, ◆), and carbon monoxide (○, ●) profiles for three coculture replicates of D. alaskensis G20 grown in coculture with either M. maripaludis (A) or M. hungatei (B) in chemostats (open symbols). The coculture chemostat treated with 5 mM BES after three volume turnovers at 0.027 h−1 dilution rate is shown in closed symbols (the time point of BES addition is marked by an arrow).
Table 3.
D. alaskensis G20 electron flow ratio through the electron carriers formate, hydrogen, and carbon monoxide during syntrophic lactate conversiona
| Electron carrier | Mean electron flow ratio (%) in coculture ± SD |
|||||
|---|---|---|---|---|---|---|
| G20 + M. maripaludis |
G20 + M. hungatei |
|||||
| 0.047 h−1 |
0.027 h−1 |
0.027 h−1 |
||||
| 1 h | 3 h | 1 h | 3 h | 1 h | 3 h | |
| Formate | 83.5 ± 2.4 | 78.0 ± 2.1 | 84.5 ± 3.0 | 81.0 ± 2.5 | 80.3 ± 2.8 | 63.7 ± 1.7 |
| Hydrogen | 16.5 ± 1.7 | 21.5 ± 2.3 | 15.5 ± 2.5 | 18.5 ± 2.5 | 19.5 ± 3.2 | 36.3 ± 1.7 |
| Carbon monoxide | 0.02 ± 0.1 | 0.02 ± 0.01 | 0.5 ± 0.1 | 0.03 ± 0.01 | 0.3 ± 0.1 | 0.07 ± 0.01 |
Calculations are based on biochemical data from the first 3 h after BES inhibitor treatment of coculture chemostats. Average values of two to three replicate experiments for each growth rate/methanogen pairing are shown.
Fig 4.
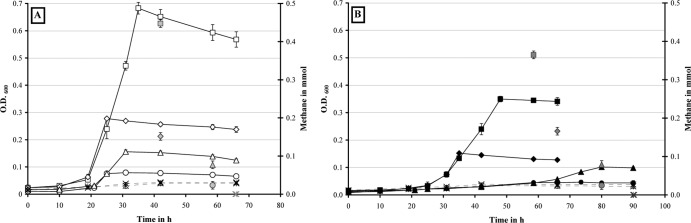
Growth curves of M. maripaludis (A) and M. hungatei (B) in batch culture on the following substrates: hydrogen at 30 lb/in2 (□, ■) or 1 lb/in2 (♢, ◆) overpressure, formate at 60 mM (△, ▲) or 20 mM (○, ●), and carbon monoxide at 0.38% (dashed lines,  ) or 0.2% (dashed lines, ×) headspace concentration (5 mM acetate was added to all cultures). The total amount of methane produced is shown in gray symbols for each substrate. Error bars indicate the standard deviations for triplicate cultures.
Differential gene expression during syntrophic growth: impact of growth rate and methanogenic partner.
Syntrophically grown D. alaskensis G20 had 172 and 119 differentially regulated genes in coculture with M. maripaludis and M. hungatei, respectively, compared to respiratory growth in monoculture at identical low growth rate (genes with an absolute log2 R value of >0.5 and an absolute Z score of >2.0 were included; see Tables S3 and S4 in the supplemental material). The numbers of differentially regulated genes are lower relative to the number of genes of the M. maripaludis pairing grown at a higher growth rate (400 up- or downregulated genes [15]). The COG functional category of energy metabolism was highest among both up- and downregulated genes for both coculture pairings. Significant increases in transcript abundance were observed for general function prediction, inorganic ion transport (M. maripaludis) and coenzyme metabolism categories (M. hungatei), whereas several genes of signal transduction, intracellular trafficking, and inorganic ion transport were downregulated (see Fig. S5 in the supplemental material). Notably, energy source availability (as controlled by dilution rate) had a much greater impact on syntrophic gene regulation in D. alaskensis G20 (see Fig. S6A and B in the supplemental material) than the methanogenic partners (see Fig. S6C in the supplemental material). The significant growth rate effect was reflected by expression changes in 268 genes (including 33 operons) in the M. maripaludis cocultures (absolute Z score > 2.0; absolute Δlog2 R > 0.5; Fig. 5A and see Table S7 in the supplemental material for details). Their affiliation with almost every COG category demonstrates the global transcriptional response to energy limitation. Although several of the significantly up- or downregulated genes (absolute log2 R value > 0.5) were exclusively differentially expressed in only one of the coculture pairings (66 and 27, respectively), only 22 genes showed a significant change in expression (absolute Δlog2 R > 0.5) between both pairings when grown at the same rate (Fig. 5B; see also Table S8 in the supplemental material for details). Interestingly, a large fraction of these genes (41%) was associated with energy metabolism (COG category C) and included periplasmic formate dehydrogenase (fdh-1, Dde_0716-Dde_0718), periplasmic [NiFeSe] and [NiFe] hydrogenases (hysAB, Dde_2134-Dde_2135; hynAB, Dde_2137-Dde_2138), ferredoxin (Dde_0286), and CO dehydrogenase (Dde_3028-Dde_3029), as well as putative cofactor biosynthesis-associated genes (Dde_0719, Dde_0805-Dde_0806). Thus, the results clearly demonstrated that this Desulfovibrio also has the capacity to adapt to different methanogenic partners.
Fig 5.
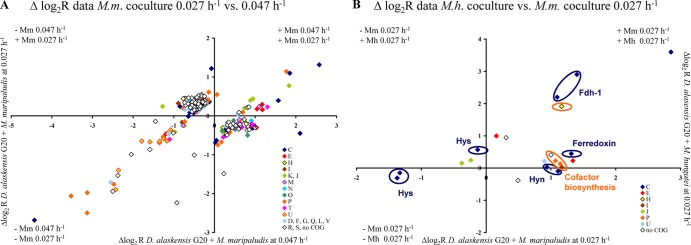
(A) Plot of the log2 R values of the 268 genes of D. alaskensis G20 differentially expressed during syntrophic growth with M. maripaludis between different growth rates. (B) Plot of the log2 R values of the 22 genes of D. alaskensis G20 differentially expressed during syntrophic growth between different methanogens at the same growth rate. Genes are differently colored according to their COG functional category affiliation (single-letter code: amino acid transport, E; carbohydrate transport and metabolism, G; cell division and chromosome partitioning, D; cell motility and secretion, N; cell envelope biogenesis, M; chromatin structure and dynamics, B; coenzyme metabolism, H; defense mechanism, V; energy production and conservation, C; function unknown, S; general function prediction only, R; inorganic ion transport and metabolism, P; intracellular trafficking and secretion, U; lipid metabolism, I; nucleotide transport and metabolism, F; posttranslational modification, protein turnover, chaperones, O; DNA replication, recombination and repair, L; secondary metabolites biosynthesis, transport and catabolism, Q; signal transduction mechanisms, T; transcription, K; and translation, ribosomal structures and biogenesis, J).
The gene expression data sets were merged to identify putative syntrophy-specific genes in D. alaskensis G20. Notably, only 68 genes were commonly differentially expressed under the different syntrophic growth conditions syntrophy relative to sulfate respiration on lactate (Fig. 6A; for a detailed list, see Table S9A in the supplemental material). Of these genes, 54 were commonly downregulated, while only 14 genes are upregulated in strain G20 during syntrophy. The most highly downregulated (lowest log2 R values under all syntrophic conditions studied) comprised 11 operons (33 genes) of the Fur regulon (e.g., biopolymer transport complexes Dde_0447-Dde_0457, Dde_2152-Dde_2157; iron-repressed flavodoxin fld, Dde_3667; ferrous iron uptake systems feo, Dde_2669-Dde_2673; and regulatory proteins hdd, Dde_1511; araC, Dde_1611; rsbU, Dde_3047 [36, 37]). In addition, the tmc operon (Dde_3707-Dde_3710), a gene cluster of regulators and signal transduction components (Dde_3711-Dde_3714, TmcR regulated) and two uncharacterized operons (Dde_3197-Dde_3202, RpoN regulated [36]) were significantly repressed in syntrophy compared to sulfate respiration (COG groups: C, P, U, M, and T). In contrast, most of the commonly upregulated genes during syntrophy were associated with energy metabolism and comprised genes encoding for lactate uptake (LctP-1 and -2) and conversion (lactate-oxidation pathway operon [38, 39], Dde_3237-Dde_3245), split-soret cytochrome c (Ssc, Dde_3211), Fdh-1 (all regulated by RpoN and ModE [36]) and the carbon starvation protein CstA (Dde_0227).
Fig 6.

Plot of the log2 R values of D. alaskensis G20 genes commonly differentially expressed in strain G20 during syntrophic growth irrespective of growth rate and methanogenic partner (“syntrophy-relevant,” 68 genes) (A), only in coculture with M. maripaludis irrespective of growth rate (putatively “M. maripaludis syntrophy-relevant,” 19 genes) (B), and only at a low growth rate irrespective of the methanogenic partner (putatively “low syntrophic growth rate-relevant,” 18 genes) (C). Genes are differently colored according to their COG functional category affiliation (see the legend of Fig. 5 for the definitions of the single-letter code).
Notably, there appears to be a pool of 19 “M. maripaludis syntrophy-relevant” genes that are only differentially expressed when strain G20 is grown in coculture with this methanogen (including HynAB, HysAB, ferredoxin, cofactor biogenesis-associated genes Dde_0805-Dde_0806, Dde_2018, and the 2-hydroxyglutaryl–coenzyme A (CoA) dehydratase operon Dde_0089-Dde_0090; see Fig. 6B and see Table S9B in the supplemental material). Interestingly, most of these genes also showed the highest change in gene expression between both coculture pairings (Fig. 5B). The transcriptional data set analysis further indicate 18 genes to be relevant in D. alaskensis G20 for syntrophic growth at low growth rate (e.g., signal transducing GGDEF-domain protein, Dde_3048, and uncharacterized histidine kinase, Dde_3715; Fig. 6C and see Table S9C in the supplemental material for details).
Comparative phenotypic growth experiments of mutant strains.
Phenotypic growth analyses of 26 D. alaskensis G20 transposon mutants with gene insertions in formate dehydrogenases, hydrogenases, membrane-bound electron transfer complexes (METCs), lactate metabolism enzymes were carried out in monoculture and coculture with M. hungatei to evaluate the function of the respective genes for syntrophy at a low growth rate (this methanogen is a slower H2/formate scavenger relative to M. maripaludis) (Fig. 7). Surprisingly, all mutants showed an extended lag phase in lactate-based coculture growth compared to the wild type even after four transfers (1% inoculum), whereas no differences were observed between the mutant and wild-type strains when grown in coculture on pyruvate and in monoculture on both substrates. The mutant phenotypic growth behavior in coculture on lactate was therefore evaluated in reference to mutant strain Dde_1072, which carries a syntrophy-irrelevant transposon insertion. Among the mutants of formate dehydrogenases or hydrogenases, the HysA mutant (Dde_2135) showed no syntrophic growth on lactate, while both mutants for Fdh-1 (Dde_0716-Dde_0718) were slightly impaired (lower growth rates and maximum cell densities than the reference strains). Notably, the hysAB and fdh-1 genes were highly expressed during coculture growth at steady-state conditions (see Table 1). None of the investigated formate dehydrogenase and hydrogenase mutants showed growth inhibition during sulfate respiration on lactate or pyruvate.
Fig 7.

(A) Growth curves for D. alaskensis wild-type and mutant strain cocultures with M. hungatei on pyruvate and lactate. The wild type and the Dde_1072 insertion mutant strain are indicated by filled symbols, whereas other mutant strains are indicated by open symbols (mutant strain data have been clustered into groups according to their proposed gene function, as shown in Table 1). (B) Maximum ODs of wild-type and mutant strains grown in monoculture (with sulfate) or coculture (without sulfate) on either 30 mM lactate or 30 mM pyruvate. The error bars indicate the standard deviations for triplicate cultures.
Among the METC subunit mutants investigated, the QrcD (Dde_2935) and HmcF (Dde_0648) showed no growth in coculture on lactate, whereas mutants for HmcE (Dde_0649), HmcB (Dde_0652), and QmoD (Dde_1114; the structural component of the Qmo complex [40]) were slightly inhibited with lower growth rates and maximum cell densities relative to the reference strains (80 to 73%). The QmoD mutant demonstrated inhibited respiratory growth on both lactate and pyruvate (extended lag phase), while the QrcD mutant was only impaired in monoculture on pyruvate (27% lower maximum cell density than the wild type). Among the lactate metabolism enzymes, mutants of the pyruvate:formate lyase (Dde_1273) demonstrated slightly higher biomass production than the wild type in monoculture and pyruvate-grown coculture. Mutants for the NADH oxidase, Nox, and an uncharacterized FAD-HdrD homologue were inhibited in coculture on lactate with extended lag phases and lower growth rates relative to the reference strains. The mutants of both putative lactate permeases (LctP-1, Dde_1074, and LctP-2, Dde_3238) and the HdrD-like putative beta subunits of the lactate dehydrogenase (LdhB-1, Dde_3240, and LdhB-2, Dde_3245) showed no growth in coculture on lactate, confirming their essential function during syntrophy. However, as demonstrated by their slightly inhibited (LdhB-1/2) and impaired (LctP-2) growth or reduced maximum cell density (LctP-1 with <20% than the wild type) in monoculture on lactate, they also are involved in lactate uptake/oxidation processes during sulfate respiration. Notably, the mutant for the lactate-oxidation-operon integral permease LctP-2 also showed inhibited growth in mono- and coculture on pyruvate.
DISCUSSION
The transcriptional data of this study demonstrated a significant shift in the gene expression profile upon change of syntrophic growth conditions. The limitation of energy availability had a major impact on the physiology of syntrophic D. alaskensis G20, as shown by the differential expression of 268 genes (including 41 operons) of a wide range of COG functional categories between different coculture growth rates with the same methanogen. Besides energy metabolism, many of the encoded proteins are involved in cell surface biogenesis (19 genes, e.g., LpxDC, KdsA, Gmd, and pilus assembly proteins), transport (18 genes, e.g., LivFK, CysWA, PstAC, and Amt), and signal transduction and transcriptional regulation (13 and 9, respectively, e.g., hmc operon-associated Rrf2 [41]) that might result in structural and physiological modifications of the cell. The methanogenic partner has only a minor influence on the gene expression of strain G20, as shown by significant transcriptional level variations in only 22 genes between the coculture pairings. However, only 68 genes were commonly differentially expressed in strain G20 under syntrophic versus respiratory lifestyle. The majority of the 54 downregulated genes in syntrophy are part of the Fur regulon (36, 37) and reflect physiological adaptations of the Desulfovibrio to changes in the environmental conditions associated with the absence of sulfide production in syntrophy, e.g., different metal availability. Notably, only 14 genes are upregulated under all syntrophic conditions investigated which include the lactate oxidation pathway operon, genes for an additional lactate permease and periplasmic cytochrome c (Ssc), the Fdh-1 formate dehydrogenase (RpoN and ModE regulon [36]), and the proposed dipeptide transporter, CstA (induced in, for example, Escherichia coli during starvation periods to enhance its metabolic potential [42, 43]). Their significant upregulation is most simply explained by the requirement for increased lactate uptake and oxidation rates to sustain growth through fermentation (lower energy availability relative to sulfate respiration). Thus, there are no truly syntrophy-specific but only syntrophy-relevant genes present in D. alaskensis G20.
In a previous study examining the metabolic and genetic basis for syntrophy in two different Desulfovibrio species (grown with M. maripaludis at their respective maximum growth rates), we demonstrated that the faster coculture growth of D. alaskensis G20 relative to D. vulgaris Hildenborough was attributed to two factors: (i) an alternative electron transfer system conferring a kinetic advantage by permitting higher lactate oxidation rates under elevated H2 levels and (ii) the use of formate as a main interspecies electron exchange mediator (15), which could sustain a 100-fold-higher conversion rate than interspecies hydrogen transfer based on diffusion kinetics (6, 7). Divergent growth characteristics of syntrophic cocultures of individual Desulfovibrio species in batch culture studies were indicative of a high level of intraspecies metabolic flexibility that was evaluated in the present study by varying the environmental parameters, e.g., methanogenic partner and energy source availability (controlled by dilution rate), for D. alaskensis G20 cocultures.
The most general effect of energy limitation imposed by the lower growth rate was a significant reduction in the proportion of Desulfovibrio (Table 2). A drop in total cell numbers in the M. maripaludis and M. hungatei cocultures of 77 or 67%, respectively, at the lower growth rate was primarily associated with reduced Desulfovibrio cell numbers (70 and 65% of the values observed at the higher growth rate). The coculture structure shifted from a Desulfovibrio dominated to an evenly populated community, indicating the nonsustainability of the initial coculture populations at lower energy availability. The lower methanogen cell number and higher cell ratio in the M. hungatei pairing relative to the M. maripaludis coculture might be attributable to the cell size/morphology differences between both species (28–31). At a lower growth rate, the community was engaged in physical interspecies association. The interspecies cell-cell contact appears to be initiated by a tight association of the methanogen to the poles of individual Desulfovibrio cells, most likely as a result of the involvement of spatially varying surface structures that promote the interactions, e.g., polar chemoreceptor clusters (44–47) or flagella (demonstrated to function in cell aggregation and biofilm formation by inducing expression of genes required for syntrophic growth [14]).
In mutualistic cocultures, the methanogen determines the specific growth rate for a pairing since both partners have to equalize their individual growth rates to achieve a balanced exchange of electron carriers to allow exponential growth of the culture (18, 48–50). The higher maximum growth rate of the M. maripaludis-D. alaskensis G20 coculture (0.051 h−1) relative to the M. hungatei pairing (0.031 h−1) correlates with higher growth rates of M. maripaludis in monoculture (e.g., on formate, the rates are 0.16 h−1 versus 0.04 h−1 for M. hungatei). Its higher growth rate in coculture might reflect the structural (e.g., sheath structure of M. hungatei [47, 51, 52] and type IV pili in M. maripaludis [53, 54]) or physiological (facultative autotrophic M. maripaludis [28, 29] and mixotrophic M. hungatei [31, 55]) differences. M. maripaludis utilizes H2 and formate faster than M. hungatei under nonlimiting conditions (see Fig. 4) (30, 56), which might be the result of the various enzyme systems used for methanogenesis and energy conservation (21–24). In M. maripaludis, an electron-bifurcating complex (consisting of heterodisulfide reductase [HdrABC], F420-reducing formate dehydrogenase [Fdh-1], and F420-nonreducing hydrogenase [Vhu]) couples the reduction of heterodisulfide and CO2 and turns the process of methanogenesis into a cyclic pathway (57–59); the respective genes are also upregulated in syntrophic M. maripaludis (60). In contrast, the heterodisulfide/CO2 reductions in M. hungatei are proposed to be coupled to transmembrane proton or sodium ion transport (22). Genes for Fdh-1 and energy-converting hydrogenases (Ech and Mbh) are highly expressed in syntrophic M. hungatei (9), which could result in lower syntrophic growth rates since ferredoxin-linked methanogenesis requires an energized membrane. In D. alaskensis G20 cocultures, formate is used as the main interspecies electron carrier irrespective of growth conditions (at least 64% of syntrophic electron flow was via formate). Notably, M. hungatei utilizes H2 preferentially (the monoculture growth rates were 0.04 h−1 on formate and 0.11 h−1 on H2) and maintained a 4-fold-lower H2 level in coculture than M. maripaludis (the average concentrations of dissolved H2 in chemostats were 70 and 265 nM, respectively) due to its high affinity for H2 relative to formate (Ks values of ∼6 μM and ∼0.22 mM, respectively [61, 62]). This preferential use of H2 by M. hungatei possibly also contributed to the reduction in the syntrophic growth rate of this coculture pairing. Remarkably, D. alaskensis G20 adapted to its partner's preference for H2 by shifting the ratio of electron carriers used for interspecies metabolite exchange (81% as formate with M. maripaludis versus only 63.7% with M. hungatei). The low Ks values of M. hungatei for H2 and formate relative to other hydrogenotrophic methanogens (H2 Ks, 14 to 66 μM [61, 63, 64]; formate Ks, 0.58 mM [62]) suggests that M. hungatei might have a competitive advantage when substrates supplied by Desulfovibrio are below the saturation constant(s) of the other species (i.e., at low dilution rates). Thus, M. maripaludis might be adapted to an opportunistic lifestyle, growing rapidly in the presence of occasional high nutrient concentrations, whereas M. hungatei is adapted to life under continuous nutrient limitation (a copiotrophic versus a oligotrophic lifestyle [18, 65]).
Transcription and mutant phenotype analyses revealed a significant influence of both energy source availability (as controlled by dilution rate) and methanogenic partner on the electron transfer enzyme system of syntrophically grown D. alaskensis G20. The data now serve to refine and extend our previous metabolic model for the syntrophic growth of strain G20 (15) and highlight the flexibility of Desulfovibrio species to adapt enzymatically and energetically to natural fluctuations in the environment (Fig. 8). At high growth rates sustained by association with M. maripaludis, strain G20 links lactate oxidation with periplasmic H+/CO2 reduction by coupling the oxidation of high redox potential DsrCred (thiol/disulfide redox pair, lactate oxidation derived) energetically with the oxidation of the low redox potential Fd-IIred (pyruvate oxidation derived). This involves a flavin-based electron confurcation process and a MQ redox loop-mediated reverse electron flow by the membrane-bound Qmo and Qrc complexes. The Qmo-MQ-Qrc loop serves as the main electron transfer system permitting high lactate oxidation rates under elevated H2 levels (460 ppm, on average, in the gas phase), thereby enhancing methanogenic growth. Although energetically costly (coupling of DsrCred oxidation to Fdred and reverse MQ cycling), the high lactate throughput presumably generates sufficient energy by substrate level phosphorylation to sustain growth.
Fig 8.

Proposed metabolic models for syntrophic growth of D. alaskensis G20 at the low growth rate of 0.027 h−1 with either M. maripaludis (A) or M. hungatei (B). Colors indicate transcriptional changes in individual genes during coculture growth relative to a sulfate-limited monoculture (the main electron transfer pathway in respective Desulfovibrio species is highlighted with red arrows); D. alaskensis G20 mutants with no growth in coculture on lactate are marked with the symbol “†” (the coculture mutant phenotypes with M. maripaludis were determined in an earlier study [15]). Abbreviations used: LctP, lactate permease; Ldh, lactate dehydrogenase; R-(SH)2 and R-SS, reduced and oxidized form of unknown thiol/disulfide redox pair (probably DsrC) interacting as electron carrier with Ldh; Por, pyruvate:ferredoxin oxidoreductase; Fdred and Fdox, reduced and oxidized form of ferredoxin; Qmo, quinone-interacting membrane-bound oxidoreductase; MQ, menaquinone; Qrc, quinone reduction complex; Pta, phosphate acetyltransferase; Ack, acetate kinease; Aor, aldehyde:ferredoxin oxidoreductase; Adh, alcohol dehydrogenase; Hdr-Flox, putative electron-bifurcating complex coupling NADH oxidation with reduction of thiol/disulfide redox pair (probably DsrC) and ferredoxin and vice versa (electron confurcation); Hmc, high-molecular-weight cytochrome c complex; Hyn, [NiFe] hydrogenase; Fdh, formate dehydrogenase; Hyd, [Fe] hydrogenase; TpIc3, type I cytochrome c3; Ssc, split-soret cytochrome c; CoA, coenzyme A.
The transcription profiles also revealed a shift in the gene expression of METCs in response to lower energy availability (lower dilution rate or pairing with M. hungatei). The Qmo complex was significantly downregulated at a low growth rate, whereas the Hmc complex was slightly upregulated, pointing to a possible shift in electron channeling through these two electron transfer systems. The Hmc closely resembles the DsrMKJOP complex (66, 67) in terms of subunit structure, composition, and location (39, 68), consisting of one periplasmic cytochrome c subunit (HmcA) and [4Fe-4S] cluster protein (HmcB), two integral membrane proteins of the NrfD (HmcC) and NarI (HmcE) families, and a cytoplasmic HdrD homologue (HmcF) (69). Being reduced by TpIc3 (70), the Hmc was initially postulated to be involved in H2 uptake of Desulfovibrio species (41, 71), but expression levels are low during respiratory growth with H2 (72, 73) and lactate (38). Our recent work indicates a functional role in electron transfer during syntrophic growth of D. vulgaris Hildenborough (15, 26). Thus, based on the data presented here, we postulate that under energy source limitation the Hmc complex is increasingly involved in the reoxidation of the LdhAB-1 derived DsrCred and transfer of electrons via TpIc3/Ssc to the periplasmic W-formate dehydrogenase Fdh-1 and hydrogenases (Hyn or Hys) in strain G20. This linkage would be achieved using an MQ-based reverse redox loop involving an HmcEF and HmcABCD module operating as menaquinone reductase and menaquinol oxidase, respectively. The HmcE is homologous to the cytochrome b integral membrane subunit HdrE (21, 74), while HmcC belongs to the NrfD family of proteins that interact with the quinone pool without the involvement of heme b, as for QrcD (17). Indeed, a bidirectional electron transport between cytoplasm and periplasm was demonstrated for the complex (71, 75). The shift in electron channeling from the Qmo-Qrc to the HmcEF-HmcABCD redox loop for the reoxidation of the reduced DsrC electron carrier might be energetically beneficial since it preserves the low redox potential Fdred for coupling periplasmic H+/CO2 reduction with cytoplasmic lactate oxidation. A proton-consuming cytoplasmic H2 generation from Fdred mediated by the putative monomeric [Fe-Fe] hydrogenase (Dde_0725; slightly upregulated under low-energy conditions) could contribute to proton motive force and allow additional chemiosmotic energy conservation besides the substrate level phosphorylation step. Thus, the Hmc complex and monomeric [Fe-Fe] hydrogenase likely represent a linked system that becomes increasingly important (besides the Qmo-MQ-Qrc loop) under low-energy conditions when maintenance energy becomes an increasing component of total energy demand (76). An additional pathway for thiol/disulfide conversion reactions supporting syntrophic growth was also suggested by coculture growth results of mutants for the uncharacterized HdrD homologue, Dde_0312 (additional FAD group containing), and the NADH oxidase, Nox. In association, both proteins could operate as a soluble flavin-based electron-bi-/confurcating enzyme that reversibly converts any remaining ferredoxin, thiol/disulfide redox pairs, and NADH in the cytoplasm. NADH could be reoxidized by a Qmo complex-associated Nox (77). The upregulation of the Ssc encoding gene during syntrophy irrespective of growth rate and methanogenic partner is indicative of an as-yet-uncharacterized functional role in linking electron transport between METCs and periplasmic enzymes in addition to TpIc3. Although its reduction by periplasmic dehydrogenases has been experimentally confirmed (78), a direct interaction with the Qrc and Hmc complex has not yet been demonstrated.
Despite the overall similarity of their transcriptional profiles, 22 genes showed significant transcriptional level variation between both coculture pairings at a low growth rate. D. alaskensis G20 adapted to the metabolism of the respective methanogenic partner, as shown by the differing gene expression and mutant coculture phenotypes of the periplasmic hydrogenases. Strain G20 possesses four periplasmic hydrogenases (HysAB, HynAB, and HydAB-1/-2) with unique kinetic properties (e.g., different substrate affinities) that have been demonstrated to be differently regulated in D. vulgaris Hildenborough in dependence on medium composition and growth conditions during sulfate respiration (72, 79, 80). Both [NiFe] hydrogenase (Hyn) and [NiFeSe] hydrogenase (Hys) were suggested to function bidirectionally (H2 oxidizing/producing) (81). Our results show that irrespective of growth rate, Hyn seems to be the main enzyme responsible for periplasmic H2 production in D. alaskensis G20 when grown syntrophically with M. maripaludis. The recently described Hyn-Qrc-TpIc3 supercomplex formation (82) likely ensures an optimized electron transfer required for periplasmic H2 production at elevated levels (the average concentration of dissolved H2 is 265 nM). Since M. hungatei keeps the dissolved H2 in coculture at a lower level (70 nM, on average, reflecting its low Ks value [61, 83]), strain G20 responds by using a different periplasmic hydrogenase (Hys) for H2 generation. Notably, under all syntrophic conditions, the W-formate dehydrogenase Fdh-1 appears to be the main enzyme for the periplasmic formate generation in strain G20, most likely because of tungsten availability in the media; the same effect on transcription has been reported for its respiratory growth on formate (84, 85).
Among the 22 genes with a significant change in expression between the coculture pairings, 11 belong to the pool of putatively “M. maripaludis syntrophy-relevant” genes that are exclusively upregulated during syntrophic growth with this methanogen (irrespective of energy availability). These include genes for the 2-hydroxyglutaryl-CoA dehydratases (Dde_0089 and Dde_0090), which catalyzes a key step in the 2-hydroxyglutarate pathway in which glutamate is fermented to ammonia, CO2, acetate, butyrate, and H2 (60). Operating in reverse, this process might be an additional pathway in D. alaskensis G20 for consuming the end products of lactate fermentation, with glutamate being excreted and transported to M. maripaludis as another exchanged metabolite. Recently, an interspecies alanine transfer has been reported for D. vulgaris Hildenborough-M. maripaludis cocultures (86).
In summary, the comparative transcriptional analyses, complemented by individual mutant growth experiments and physiological data, established distinctive differences in the population structures, electron transfer systems, ratios of interspecies electron carriers (H2/formate), enzyme systems, and energy conservation mechanisms that sustain the syntrophic growth of D. alaskensis G20 when grown under different environmental conditions (energy source availability, different methanogenic partner). The results emphasize the high enzymatic and metabolic flexibility of syntrophic D. alaskensis G20, which ensures its ability to adapt to the frequent fluctuations of growth conditions in nature. Adaptive strategies may also involve architectural changes, e.g., cell attachment and aggregation (observed in coculture at low growth rate), which might allow for efficient metabolite transfer to the methanogen and therefore more energy-efficient energy coupling.
Supplementary Material
ACKNOWLEDGMENTS
We thank Jayashree Ray and Marcin Zemla (Lawrence Berkeley National Laboratory [LBNL], Berkeley, CA) for assistance, as well as M. Auer (LBNL) for the use of the Hitachi S5000 scanning electron microscope and the courtesy of providing the SEM images.
This study, conducted by ENIGMA–Ecosystems and Networks Integrated with Genes and Molecular Assemblies (http://enigma.lbl.gov), a Scientific Focus Area Program at the LBNL, was supported by the Office of Science, Office of Biological and Environmental Research, U.S. Department of Energy, under contract DE-AC02-05CH11231.
Footnotes
Published ahead of print 23 August 2013
Supplemental material for this article may be found at http://dx.doi.org/10.1128/JB.00504-13.
REFERENCES
- 1.McInerney MJ, Struchtemeyer CG, Sieber J, Mouttaki H, Stams AJM, Schink B, Rohlin L, Gunsalus RP. 2008. Physiology, ecology, phylogeny, and genomics of microorganisms capable of syntrophic metabolism. Ann. N. Y. Acad. Sci. 1125:58–72 [DOI] [PubMed] [Google Scholar]
- 2.Schink B, Stams AJM. 2006. Syntrophism among prokaryotes, p 309–335 In Dworkin M, Falkow S, Rosenberg E, Schleifer K-H, Stackebrandt E. (ed), The prokaryotes, 2nd ed, vol 2 Springer-Verlag, Heidelberg, Germany [Google Scholar]
- 3.Stams AJM, Plugge CM. 2009. Electron transfer in syntrophic communities of anaerobic bacteria and archaea. Nat. Rev. Microbiol. 7:568–577 [DOI] [PubMed] [Google Scholar]
- 4.McInerney MJ, Sieber JR, Gunsalus RP. 2009. Syntrophy in anaerobic global carbon cycles. Curr. Opin. Biotechnol. 20:623–632 [DOI] [PMC free article] [PubMed] [Google Scholar]
- 5.Müller N, Worm P, Schink B, Stams AJM, Plugge CM. 2010. Syntrophic butyrate and propionate oxidation processes: from genomes to reaction mechanisms. Environ. Microbiol. Rep. 2:489–499 [DOI] [PubMed] [Google Scholar]
- 6.Boone DR, Johnson Liu Y. 1989. Diffusion of the interspecies electron carriers H2 and formate in methanogenic ecosystems and its implications in the measurement of Km for H2 or formate uptake. Appl. Environ. Microbiol. 55:1735–1741 [DOI] [PMC free article] [PubMed] [Google Scholar]
- 7.Thiele JH, Zeikus JG. 1988. Control of interspecies electron flow during anaerobic digestion: significance of formate transfer versus hydrogen transfer during syntrophic methanogenesis in flocs. Appl. Environ. Microbiol. 54:20–29 [DOI] [PMC free article] [PubMed] [Google Scholar]
- 8.Stams AJM, Dong X. 1995. Role of formate and hydrogen in the degradation of propionate and butyrate by defined suspended cocultures of acetogenic and methanogenic bacteria. Antonie Van Leeuwenhoek Int. J. Gen. Mol. Microbiol. 68:281–284 [DOI] [PubMed] [Google Scholar]
- 9.Worm P, Stams AJM, Cheng X, Plugge CM. 2011. Growth- and substrate-dependent transcription of formate dehydrogenase and hydrogenase coding genes in Syntrophobacter fumaroxidans and Methanospirillum hungatei. Microbiology 157:280–289 [DOI] [PubMed] [Google Scholar]
- 10.de Bok FAM, Luijten MLGC, Stams AJM. 2002. Biochemical evidence for formate transfer in syntrophic propionate-oxidizing cocultures of Syntrophobacter fumaroxidans and Methanospirillum hungatei. Appl. Environ. Microbiol. 68:4247–4252 [DOI] [PMC free article] [PubMed] [Google Scholar]
- 11.Schink B, Thauer RK. 1988. Energetics of syntrophic methane formation and the influence of aggregation. Pudoc, Wageningen, Netherlands [Google Scholar]
- 12.Ishii S, Kosaka T, Hotta Y, Watanabe K. 2006. Simulating the contribution of coaggregation to interspecies hydrogen fluxes in syntrophic methanogenic consortia. Appl. Environ. Microbiol. 72:5093–5096 [DOI] [PMC free article] [PubMed] [Google Scholar]
- 13.Ishii S, Kosaka T, Hori K, Hotta Y, Watanabe K. 2005. Coaggregation faciliates interspecies hydrogen transfer between Pelotomaculum thermopropionicum and Methanothermobacter thermautotrophicus. Appl. Environ. Microbiol. 71:7838–7845 [DOI] [PMC free article] [PubMed] [Google Scholar]
- 14.Shimoyama T, Kato S, Ishii S, Watanabe K. 2009. Flagellum mediates symbiosis. Science 323:1574. [DOI] [PubMed] [Google Scholar]
- 15.Meyer B, Kuehl J, Deutschbauer AM, Price MN, Arkin AP, Stahl DA. 2013. Variation among Desulfovibrio species in electron transfer systems used for syntrophic growth. J. Bacteriol. 195:990–1004 [DOI] [PMC free article] [PubMed] [Google Scholar]
- 16.Pires RH, Lourenco AI, Morais F, Teixeira M, Xavier AV, Saraiva LM, Pereira IAC. 2003. A novel membrane-bound respiratory complex from Desulfovibrio desulfuricans ATCC 27774. Biochim. Biophys. Acta Bioenerget. 1605:67–82 [DOI] [PubMed] [Google Scholar]
- 17.Venceslau SS, Lino RR, Pereira IAC. 2010. The Qrc membrane complex, related to the alternative complex III, is a menaquinone reductase involved in sulfate respiration. J. Biol. Chem. 285:22774–22783 [DOI] [PMC free article] [PubMed] [Google Scholar]
- 18.Archer DB, Powell GE. 1985. Dependence of the specific growth rate of the methanogenic mutualistic cocultures on the methanogen. Arch. Microbiol. 141:133–137 [Google Scholar]
- 19.de Porter LMI, Geerts WJ, Keltjens JT. 2007. Coupling of Methanothermobacter thermoautotrophicus methane formation and growth in fed-batch and continuous cultures under different H2 gassing regiments. Appl. Environ. Microbiol. 73:740–749 [DOI] [PMC free article] [PubMed] [Google Scholar]
- 20.Schönheit P, Moll J, Thauer RK. 1980. Growth parameters (KS, μmax, YS) of Methanobacterium thermoautotrophicum. Arch. Microbiol. 127:59–65 [DOI] [PubMed] [Google Scholar]
- 21.Thauer RK, Kaster AK, Seedorf H, Buckel W, Hedderich R. 2008. Methanogenic archaea: ecologically relevant differences in energy conservation. Nat. Rev. Microbiol. 6:579–591 [DOI] [PubMed] [Google Scholar]
- 22.Anderson I, Ulrich LE, Lupa B, Susanti D, Porat I, Hooper SD, Lykidis A, Sieprawska-Lupa M, Dharmarajan L, Goltsman E, Lapidus A, Saunders E, Han C, Land M, Lucas S, Mukhopadhyay B, Whitman WB, Woese C, Bristow J, Kyrpides N. 2009. Genomic characterization of Methanomicrobiales reveals three classes of methanogens. PLoS One 4:e5797. 10.1371/journal.pone.0005797 [DOI] [PMC free article] [PubMed] [Google Scholar]
- 23.Rother M. 2010. Methanogenesis, p 483–499 In Timmis KN. (ed), Handbook of hydrocarbon and lipid microbiology. Springer-Verlag, Heidelberg, Germany [Google Scholar]
- 24.Hedderich R, Whitman WB. 2006. Physiology and biochemistry of the methane-producing archaea, 2nd ed. Springer-Verlag, Heidelberg, Germany [Google Scholar]
- 25.Li X, McInerney MJ, Stahl DA, Krumholz LR. 2011. Metabolism of H2 by Desulfovibrio alaskensis G20 during syntrophic growth on lactate. Microbiology 157:2912–2921 [DOI] [PubMed] [Google Scholar]
- 26.Walker CB, He Z, Yang ZK, Ringbauer JA, He Q, Zhou J, Voordouw G, Wall JD, Arkin AP, Hazen TC, Stolyar S, Stahl DA. 2009. The electron transfer system of syntrophically grown Desulfovibrio vulgaris. J. Bacteriol. 191:5793–5801 [DOI] [PMC free article] [PubMed] [Google Scholar]
- 27.Plugge CM, Scholten JCM, Culley DE, Nie L, Brockman FJ, Zhang W. 2010. Global transcriptomics analysis of the Desulfovibrio vulgaris change from syntrophic growth with Methanosarcina barkeri to sulfidogenic metabolism. Microbiology 156:2746–2756 [DOI] [PubMed] [Google Scholar]
- 28.Jones WJ, Paynter MJB, Gupta R. 1983. Characterization of Methanococcus maripaludis sp. nov., a new methanogen isolated from salt marsh sediment. Arch. Microbiol. 1983:91–97 [Google Scholar]
- 29.Whitman WB, Shieh S, Sohn S, Caras DS, Premachandran U. 1986. Isolation and characterization of 22 mesophilic methanococci. Syst. Appl. Microbiol. 7:235–240 [Google Scholar]
- 30.Ferry JG, Smith PH, Wolfe RS. 1974. Methanospirillum, a new genus of methanogenic bacteria, and characterization of Methanospirillum hungatei sp. nov. Int. J. Syst. Bacteriol. 24:465–469 [Google Scholar]
- 31.Iino T, Mori K, Suzuki KI. 2010. Methanospirillum lacunae sp. nov., a methane-producing archaeon isolated from puddy soil, and emended descriptions of the genus Methanospirillum and Methanospirillum hungatei. Int. J. Syst. Evol. Microbiol. 60:2563–2566 [DOI] [PubMed] [Google Scholar]
- 32.Widdel F, Bak F. 1992. Gram-negative mesophilic sulfate-reducing bacteria, p 3352–3378 In Balows A, Tr̈uper HG, Dworkin M, Harder W, Schleifer K-H. (ed), The prokaryotes, 2nd ed, vol 4 Springer Verlag, New York, NY [Google Scholar]
- 33.Stolyar S, van Dien S, Hillesland KL, Pinel N, Lie TJ, Leigh JA, Stahl DA. 2007. Metabolic modeling of a mutualistic microbial community. Mol. Syst. Biol. 3:92. [DOI] [PMC free article] [PubMed] [Google Scholar]
- 34.Price MN, Arkin AP, Alm EJ. 2006. OpWise: operons aid the identification of differentially expressed genes in bacterial microarray experiments. BMC Bioinform. 13:7–19 [DOI] [PMC free article] [PubMed] [Google Scholar]
- 35.Oh J, Fung E, Price MN, Dehal PS, Davis RW, Giaever G, Nislow C, Arkin AP, Deutschbauer AM. 2010. A universal TagModule collection for parallel genetic analysis of microorganisms. Nucleic Acids Res. 38:e146. [DOI] [PMC free article] [PubMed] [Google Scholar]
- 36.Rodionov DA, Dubchak I, Arkin A, Alm E, Gelfand MS. 2004. Reconstruction of regulatory and metabolic pathways in metal-reducing Deltaproteobacteria. Genome Biol. 5:R90. [DOI] [PMC free article] [PubMed] [Google Scholar]
- 37.Bender KS, Yen H-CB, Hemme CL, Yang Z, He Z, He Q, Zhou J, Huang KH, Alm EJ, Hazen TC, Arkin AP, Wall JD. 2007. Analysis of ferric uptake regulator (Fur) mutant of Desulfovibrio vulgaris Hildenborough. Appl. Environ. Microbiol. 73:5389–5400 [DOI] [PMC free article] [PubMed] [Google Scholar]
- 38.Keller KL, Wall JD. 2011. Genetics and molecular biology of the electron flow for sulfate respiration in Desulfovibrio. Front. Microbiol. 2:Article 135 [DOI] [PMC free article] [PubMed] [Google Scholar]
- 39.Pereira IAC, Ramos AR, Grein F, Marques MC, Marques da Silva S, Venceslau SS. 2011. A comparative genomic analysis of energy metabolism in sulfate reducing bacteria and archaea. Front. Microbiol. 2:Article 69 [DOI] [PMC free article] [PubMed] [Google Scholar]
- 40.Krumholz LR, Wang L, Beck DAC, Wang T, Hackett M, Mooney B, Juba TR, McInerney MJ, Meyer B, Wall JD, Stahl DA. Membrane protein complex of APS reductase and Qmo is present in Desulfovibrio vulgaris and Desulfovibrio alaskensis. Microbiology, in press [DOI] [PubMed] [Google Scholar]
- 41.Keon RG, Fu RD, Voordouw G. 1997. Deletion of two downstream genes alters expression of the hmc operon of Desulfovibrio vulgaris subsp. vulgaris Hildenborough. Arch. Microbiol. 167:376–383 [DOI] [PubMed] [Google Scholar]
- 42.Schultz JE, Matin A. 1991. Molecular and functional characterization of a carbon starvation gene of Escherichia coli. J. Mol. Biol. 218:129–140 [DOI] [PubMed] [Google Scholar]
- 43.Matin A. 1991. The molecular basis of carbon-starvation-induced general resistance in Escherichia coli. Mol. Microbiol. 5:3–10 [DOI] [PubMed] [Google Scholar]
- 44.Maddock J, Alley RMRK, Shapiro L. 1993. Polarized cells, polar actions. J. Bacteriol. 175:7125–7129 [DOI] [PMC free article] [PubMed] [Google Scholar]
- 45.Bray D, Levin MD, Morton-Firth CJ. 1998. Receptor clustering as a cellular mechanism to control sensitivity. Nature 393:85–88 [DOI] [PubMed] [Google Scholar]
- 46.Briegel A, Ortega DR, Tocheva EI, Wuichet K, Li Z, Chen S, Müller A, Iancu CV, Murphy GE, Dobro MJ, Zhulin IB, Jensen GJ. 2009. Universal architecture of bacterial chemoreceptor arrays. Proc. Natl. Acad. Sci. U. S. A. 106:17181–17186 [DOI] [PMC free article] [PubMed] [Google Scholar]
- 47.Albers SV, Meyer BH. 2011. The archaeal cell envelope. Nat. Rev. Microbiol. 9:414–426 [DOI] [PubMed] [Google Scholar]
- 48.Powell GE. 1984. Equalisation of specific growth rates for syntrophic associations in batch culture. J. Chem. Technol. Biotechnol. 34B:97–100 [Google Scholar]
- 49.Powell GE. 1985. Stable coexistence of syntrophic associations in continuous culture. J. Chem. Technol. Biotechnol. 35B:46–50 [Google Scholar]
- 50.Kreikenbohm R, Bohl E. 1986. A mathematical model of syntrophic cocultures in the chemostat. FEMS Microbiol. Ecol. 38:131–140 [Google Scholar]
- 51.Xu W, Mulhern PJ, Blackford BL, Jericho MH, Firtel M, Beveridge TJ. 1996. Modeling and measuring the elastic properties of an archaeal surface, the sheath of Methanospirillum hungatei, and the implication for methane production. J. Bacteriol. 178:3106–3112 [DOI] [PMC free article] [PubMed] [Google Scholar]
- 52.Beveridge TJ, Sprott GD, Whippey P. 1991. Ultrastructure, inferred porosity, and Gram staining character of Methanospirillum hungatei filament termini describe unique cell permeability of this archaeobacterium. J. Bacteriol. 173:130–140 [DOI] [PMC free article] [PubMed] [Google Scholar]
- 53.Ng SY, Wu MJ, Nair DB, Logan SM, Robotham A, Tessier L, Kelly JF, Uchida K, Aizawa SI, Jarrell KF. 2011. Genetic and mass spectrometry analyses of the unusual type IV-like pili of the archaeon Methanococcus maripaludis. J. Bacteriol. 193:804–814 [DOI] [PMC free article] [PubMed] [Google Scholar]
- 54.Jarrell KF, Stark M, Nair DB, Chong JPJ. 2011. Flagella and pili are both necessary for efficient attachment of Methanococcus maripaludis to surfaces. FEMS Microbiol. Lett. 319:44–50 [DOI] [PubMed] [Google Scholar]
- 55.Ekiel I, Smith ICP, Sprott GD. 1983. Biosynthetic pathways in Methanospirillum hungatei as determined by 13C nuclear magnetic resonance. J. Bacteriol. 156:316–326 [DOI] [PMC free article] [PubMed] [Google Scholar]
- 56.Patel GB, Roth LA, van den Berg L, Clark DS. 1976. Characterization of a strain of Methanospirillum hungatei. Can. J. Microbiol. 22:1404–1410 [DOI] [PubMed] [Google Scholar]
- 57.Kaster AK, Moll J, Parey K, Thauer RK. 2011. Coupling of ferredoxin and heterodisulfide reduction via electron bifurcation in hydrogenotrophic methanogenic archaea. Proc. Natl. Acad. Sci. U. S. A. 108:2981–2986 [DOI] [PMC free article] [PubMed] [Google Scholar]
- 58.Costa KC, Wong PM, Lie T, Dodsworth TJ, Swanson JA, Burn I, Hackett JA, Leigh JA. 2010. Protein complexing in a methanogen suggests electron bifurcation and electron delivery from formate to heterodisulfide reductase. Proc. Natl. Acad. Sci. U. S. A. 107:11050–11055 [DOI] [PMC free article] [PubMed] [Google Scholar]
- 59.Lie TJ, Costa KC, Lupa B, Korpole S, Whitman WB, Leigh JA. 2012. Essential anaplerotic role for the energy-converting hydrogenase Eha in hydrogenotrophic methanogenesis. Proc. Natl. Acad. Sci. U. S. A. 109:15473–15478 [DOI] [PMC free article] [PubMed] [Google Scholar]
- 60.Walker CB, Redding-Johanson AM, Baidoo EE, Rajeev L, He Z, Hendrickson EL, Joachimiak MP, Stolyar S, Arkin AP, Leigh JA, Zhou J, Keasling JD, Mukhopadhyay A, Stahl DA. 2012. Functional responses of methanogenic archaea to syntrophic growth. ISME J. 6:2045–2055 [DOI] [PMC free article] [PubMed] [Google Scholar]
- 61.Robinson JA, Tiedje JM. 1984. Competition between sulfate-reducing and methanogenic bacteria for H2 under resting and growing conditions. Arch. Microbiol. 137:26–32 [Google Scholar]
- 62.Schauer NL, Brown DP, Ferry JG. 1982. Kinetics of formate metabolism in Methanobacterium formicicum and Methanospirillum hungatei. Appl. Environ. Microbiol. 44:549–554 [DOI] [PMC free article] [PubMed] [Google Scholar]
- 63.Ver Eecke HC, Butterfield DA, Huber JA, Lilley MD, Olson EJ, Roe KK, Evans LJ, Merkel AY, Cantin HV, Holden JF. 2012. Hydrogen-limited growth of hyperthermophilic methanogens at deep-sea hydrothermal vents. Proc. Natl. Acad. Sci. U. S. A. 109:13674–13679 [DOI] [PMC free article] [PubMed] [Google Scholar]
- 64.Lupton FS, Zeikus JG. 1984. Physiological basis for sulfate-dependent hydrogen competition between sulfidogens and methanogens. Curr. Microbiol. 11:7–12 [Google Scholar]
- 65.Owens JD, Legan JD. 1987. Determination of the Monod substrate saturation constant for microbial growth. FEMS Microbiol. Rev. 46:419–432 [Google Scholar]
- 66.Mander GJ, Duin EC, Linder D, Stetter KO, Hedderich R. 2002. Purification and characterization of a membrane-bound enzyme complex from the sulfate-reducing archaeon Archaeoglobus fulgidus related to heterodisulfide reductase from methanogenic archaea. Eur. J. Biochem. 269:1895–1904 [DOI] [PubMed] [Google Scholar]
- 67.Pires RH, Venceslau SS, Morais F, Teixeira M, Xavier AV, Pereira IAC. 2006. Characterization of the Desulfovibrio desulfuricans ATCC 27774 DsrMKJOP complex: a membrane-bound redox complex involved in the sulfate respiratory pathway. Biochemistry 45:249–262 [DOI] [PubMed] [Google Scholar]
- 68.Grein F, Ramos AR, Venceslau SS, Pereira IAC. 2013. Unifying concepts in anaerobic respiration: insights from dissimilatory sulfur metabolism. Biochim. Biophys. Acta 1827:145–160 [DOI] [PubMed] [Google Scholar]
- 69.Rossi M, Pollock WBR, Reij MW, Keon RG, Fu RD, Voordouw G. 1993. The hmc operon of Desulfovibrio vulgaris subsp. vulgaris Hildenborough encodes a potential transmembrane redox protein complex. J. Bacteriol. 175:4699–4711 [DOI] [PMC free article] [PubMed] [Google Scholar]
- 70.Pereira IAC, Romao CV, Xavier AV, LeGall J, Teixeira M. 1998. Electron transfer between hydrogenases and mono- and multiheme cytochromes in Desulfovibrio spp. J. Biol. Inorg. Chem. 3:494–498 [Google Scholar]
- 71.Dolla A, Pohorelic BKJ, Voordouw JK, Voordouw G. 2000. Deletion of the hmc operon of Desulfovibrio vulgaris subsp. vulgaris Hildenborough hampers hydrogen metabolism and low-redox-potential niche establishment. Arch. Microbiol. 174:143–151 [DOI] [PubMed] [Google Scholar]
- 72.Caffrey SM, Park H-S, Voordouw JK, He Z, Zhou J, Voordouw G. 2007. Function of periplasmic hydrogenases in the sulfate-reducing bacterium Desulfovibrio vulgaris Hildenborough. J. Bacteriol. 189:6159–6167 [DOI] [PMC free article] [PubMed] [Google Scholar]
- 73.Pereira PM, He Q, Valente FMA, Xavier AV, Zhou JZ, Pereira IAC, Louro RO. 2008. Energy metabolism in Desulfovibrio vulgaris Hildenborough: insights from transcriptome analysis. Antonie Van Leeuwenhoek Int. J. Gen. Mol. Microbiol. 93:347–362 [DOI] [PubMed] [Google Scholar]
- 74.Hedderich R, Hamann N, Bennati M. 2005. Heterodisulfide reductase from methanogenic archaea: a new catalytic role for an iron-sulfur cluster. Biol. Chem. 386:961–970 [DOI] [PubMed] [Google Scholar]
- 75.Voordouw G. 2002. Carbon monoxide cycling by Desulfovibrio vulgaris Hildenborough. J. Bacteriol. Virol. 184:5903–5911 [DOI] [PMC free article] [PubMed] [Google Scholar]
- 76.Nyström T, Gustavsson N. 1998. Maintenance energy requirement: what is required for stasis survival of Escherichia coli. Biochim. Biophys. Acta 1365:225–231 [DOI] [PubMed] [Google Scholar]
- 77.Ramos AR, Keller KL, Wall JD, Pereira IAC. 2012. The membrane QmoABC complex interacts directly with the dissimilatory adenosine 5′-phosphosulfate reductase in sulfate reducing bacteria. Front. Microbiol. 3:Article 137 [DOI] [PMC free article] [PubMed] [Google Scholar]
- 78.da Silva SM, Pacheco I, Pereira IAC. 2012. Electron transfer between periplasmic formate dehydrogenase and cytochromes c in Desulfovibrio desulfuricans ATCC 27774. J. Biol. Inorg. Chem. 17:831–838 [DOI] [PubMed] [Google Scholar]
- 79.Valente FMA, Almeida CC, Pacheco I, Carita J, Saraiva LM, Pereira IAC. 2006. Selenium is involved in regulation of periplasmic hydrogenase gene expression in Desulfovibrio vulgaris Hildenborough. J. Bacteriol. 188:3228–3235 [DOI] [PMC free article] [PubMed] [Google Scholar]
- 80.Pohorelic BKJ, Voordouw JK, Lojou E, Dolla A, Harder J, Voordouw G. 2002. Effects of deletion of genes encoding Fe-only hydrogenase of Desulfovibrio vulgaris Hildenborough on hydrogen and lactate metabolism. J. Bacteriol. 184:679–686 [DOI] [PMC free article] [PubMed] [Google Scholar]
- 81.Valente FMA, Oliveira ASF, Gnadt N, Pacheco I, Coelho AV, Xavier AV, Teixeira M, Soares CM, Pereira IAC. 2005. Hydrogenases in Desulfovibrio vulgaris Hildenborough: structural and physiologic characterisation of the membrane-bound (NiFeSe) hydrogenase. J. Biol. Inorg. Chem. 10:667–682 [DOI] [PubMed] [Google Scholar]
- 82.Venceslau SS, Matos D, Pereira IAC. 2011. EPR characterization of the new Qrc complex from sulfate reducing bacteria and its ability to form a supercomplex with hydrogenase and TpIc3. FEBS Lett. 585:2177–2181 [DOI] [PubMed] [Google Scholar]
- 83.Kristjansson JK, Schönheit P, Thauer RK. 1982. Different KS values for hydrogen of methanogenic bacteria and sulfate-reducing bacteria: an explanation for the apparent inhibition of methanogenesis by sulfate. Arch. Microbiol. 131:278–282 [Google Scholar]
- 84.Mota CS, Valette O, Gonzalez PJ, Brondino CD, Moura JJG, Moura I, Dolla A, Rivas MG. 2011. Effects of molybdate and tungstate on expression levels and biochemical characteristics of formate dehydrogenases produced by Desulfovibrio alaskensis NCIMB 13491. J. Bacteriol. 193:2917–2923 [DOI] [PMC free article] [PubMed] [Google Scholar]
- 85.da Silva SM, Pimentel C, Valente FMA, Rodrigues-Pousada C, Pereira IAC. 2011. Tungsten and molybdenum regulation of formate dehydrogenase expression in Desulfovibrio vulgaris Hildenborough. J. Bacteriol. 193:2909–2916 [DOI] [PMC free article] [PubMed] [Google Scholar]
- 86.Pereira PM, Teixeira M, Xavier AV, Louro RO, Pereira IAC. 2006. The Tmc complex from Desulfovibrio vulgaris Hildenborough is involved in transmembrane electron transfer from periplasmic hydrogen oxidation. Biochemistry 45:10359–10367 [DOI] [PubMed] [Google Scholar]
- 87.Dehal PS, Joachimiak MP, Price MN, Bates JT, Baumohl JK, Chivian D, Friedland GD, Huang KH, Keller K. 2010. MicrobesOnline: an integrated portal for comparative and functional genomics. Nucleic Acids Res. 38:D396–D400 [DOI] [PMC free article] [PubMed] [Google Scholar]
Associated Data
This section collects any data citations, data availability statements, or supplementary materials included in this article.