Abstract
Many transcriptional regulators control gene activity by responding to specific ligands. Members of the multiple-antibiotic resistance regulator (MarR) family of transcriptional regulators feature prominently in this regard, and they frequently function as repressors in the absence of their cognate ligands. Plant pathogens such as Dickeya dadantii encode a MarR homolog named PecS that controls expression of a gene encoding the efflux pump PecM in addition to other virulence genes. We report here that the soil bacterium Streptomyces coelicolor also encodes a PecS homolog (SCO2647) that regulates a pecM gene (SCO2646). S. coelicolor PecS, which exists as a homodimer, binds the intergenic region between pecS and pecM genes with high affinity. Several potential PecS binding sites were found in this intergenic region. The binding of PecS to its target DNA can be efficiently attenuated by the ligand urate, which also quenches the intrinsic fluorescence of PecS, indicating a direct interaction between urate and PecS. In vivo measurement of gene expression showed that activity of pecS and pecM genes is significantly elevated after exposure of S. coelicolor cultures to urate. These results indicate that S. coelicolor PecS responds to the ligand urate by attenuated DNA binding in vitro and upregulation of gene activity in vivo. Since production of urate is associated with generation of reactive oxygen species by xanthine dehydrogenase, we propose that PecS functions under conditions of oxidative stress.
INTRODUCTION
Members of the multiple-antibiotic resistance regulator (MarR) family of transcriptional regulators are involved in a variety of important biological processes. MarR proteins are particularly well suited to sense environmental changes, as they can regulate target gene expression in response to the binding of specific ligands (1, 2). Therefore, many MarR family regulators mediate bacterial responses to environmental stress. A common regulatory mechanism involves the MarR homolog binding to the intergenic region between the marR gene and a divergently oriented gene (or operon), repressing the transcription of both. Upon binding of a specific ligand, DNA binding is attenuated, causing derepression of both genes (1–4).
A subfamily of MarR proteins, termed urate-responsive transcriptional regulators (UrtR), has been described (5). The transcriptional regulators in this subfamily are characterized by an N-terminal extension not found in “classical” MarR proteins, such as Escherichia coli MarR. In addition, they conserve four amino acid residues, which have been implicated in urate coordination and the attendant attenuation of DNA binding, and conservation of sequences within the DNA recognition helices correlates with similarity of their cognate DNA binding sites in target promoters (5–10). Several members of this subfamily have been shown to respond to urate as a ligand; the founding member, HucR from Deinococcus radiodurans, regulates expression of a gene encoding a uricase (6). However, PecS from Agrobacterium tumefaciens (Rhizobium radiobacter) and MftR from Burkholderia thailandensis regulate expression of a predicted membrane transporter (8, 9). R. radiobacter PecS and PecM (the membrane transporter) are homologous to proteins previously described in the plant pathogen Erwinia chrysanthemi (Dickeya dadantii) (3, 11–13). D. dadantii pecM, which is also regulated by PecS, was shown to encode a transporter involved in indigoidine excretion (11). The antioxidant indigoidine functions in defense against reactive oxygen species (ROS) and is important for bacterial virulence (13).
Plants produce ROS in the early stages of pathogen invasion as part of their mechanism to defend themselves; hence, production of antioxidants is important for virulence of plant pathogens (14–16). One of the mechanisms by which host plants produce ROS is by activating xanthine oxidase. Since xanthine oxidase uses xanthine and hypoxanthine as the substrates to produce urate and ROS, urate will be produced as a by-product and may be detected by the invading bacterium as a signal of impending oxidative stress. If the bacterium can use urate as a signal to regulate specific genes, it might augment the defense against oxidative stress or elicit expression of other genes required for effective colonization. The observed upregulation of R. radiobacter pecM on exposure to urate would be consistent with this scenario (8).
We have recently reported that Streptomyces coelicolor encodes a UrtR homolog that is very similar to PecS from plant pathogens yet differs by responding to the ligand trans-aconitate and related compounds (17). This homolog, named trans-aconitate methyltransferase regulator (TamR), regulates expression of a gene encoding trans-aconitate methyltransferase and is important for metabolic flux through the citric acid cycle during oxidative stress. S. coelicolor lives in different ecological environments and is one of the most widely distributed soil bacteria (18). It needs to compete with other organisms (plants, fungi, or bacteria) for limited nutrients and other resources in the soil. For Streptomyces spp. and other bacteria, secretion of antibiotics is thought to be one of their important strategies during this competition (19–21). In this complex ecological environment, many organisms (such as plants) employ the strategy of producing ROS in defense against invading pathogens (14–16). For organisms that inhabit the rhizosphere, mechanisms must therefore be in place to respond to incidental exposure to ROS and other secreted compounds.
We show here that S. coelicolor encodes divergent pecS and pecM genes that are upregulated by exogenous urate. The sequence conservation and predicted domain architecture of PecS and TamR proteins from Streptomycetes suggest that they derive from a common ancestor. However, TamR and PecS from Streptomyces spp. have evolved distinct functions, with PecS homologs comparable to PecS from plant pathogens in regulating expression of a gene encoding PecM.
MATERIALS AND METHODS
Sequence analyses.
Sequences were aligned using ClustalW. Prealigned amino acid sequences were used to generate a phylogenetic tree using the neighbor-joining method in MEGA4 (22, 23). Five hundred bootstrap replicates were analyzed to generate the bootstrap consensus tree and to estimate the statistical confidence values. Positions that contain gaps were eliminated during calculation. The evolutionary distances are in units of number of amino acid substitutions per site.
Cloning and purification of PecS.
The S. coelicolor A3 (2) M145 strain was cultured in tryptone yeast extract broth (International Streptomyces Project [ISP] medium 1) at 30°C. The genomic DNA was isolated from S. coelicolor using the salting out method (24). Forward primer 5′-CCGATACTCGTCATATGACTGAACG-3′ and reverse primer 5′-GGGCGGATCCCTACTTCTCCG-3′ were used to amplify the gene encoding PecS (SCO2647; restriction sites are underlined) using genomic DNA as the template. The PCR product was cloned into the NdeI-BamHI sites of pET28b (Novagen). As a result, an N-terminal His6-tag was introduced into the recombinant PecS. The recombinant plasmid was transformed into E. coli TOP10 (Invitrogen). After the correct construct was confirmed by sequencing, it was transformed into E. coli BL21(DE3)/pLysS for protein overexpression.
For overexpression, a 50-ml culture was inoculated with a single colony and grown overnight at 37°C (250 rpm) in Luria-Bertani medium (with 50 μg/ml kanamycin). The overnight culture was diluted 1:500 with LB medium (with 50 μg/ml kanamycin) and grown at 37°C (250 rpm). When the optical density at 600 nm (OD600) reached about 0.6, overexpression of protein was induced with 0.2 mM isopropyl-β-d-1-thiogalactopyranoside (IPTG) for 3 h. The induced cultures were then chilled on ice. Cell pellets were stored at −80°C after the cultures were centrifuged at 4,000 × g for 10 min.
For protein purification, cell pellets were thawed on ice, and cells were resuspended in ice-cold lysis buffer (50 mM sodium phosphate buffer [pH 7.2], 250 mM NaCl, 5% glycerol, 10 mM imidazole, 0.15 mM phenylmethylsulfonyl fluoride [PMSF], and 1 mM 2-mercaptoethanol). Sonication was used to disrupt cells. After sonication, DNase I was added to digest nucleic acids. Then, this solution was centrifuged at 15,000 × g for 60 min at 4°C. After the supernatant was filtered through filter paper, it was loaded onto an HIS-Select nickel affinity column (Sigma), which was already equilibrated with lysis buffer. Then, the column was washed by gravity flow with 10 volumes of wash buffer (50 mM sodium phosphate buffer [pH 7.2], 250 mM NaCl, 5% glycerol, 20 mM imidazole, 0.15 mM PMSF, 1 mM 2-mercaptoethanol). Elution buffer (50 mM sodium phosphate buffer [pH 7.2], 250 mM NaCl, 5% glycerol, 250 mM imidazole, 0.15 mM PMSF, 1 mM 2-mercaptoethanol) was applied to elute proteins after the washing step. Peak fractions from the elution were pooled and dialyzed against dialysis buffer (50 mM potassium phosphate buffer [pH 7.2], 250 mM NaCl, 5% glycerol, 0.15 mM PMSF, 1 mM 2-mercaptoethanol) at 4°C. All steps of purification were performed at 4°C. After dialysis, the protein was stored at −80°C. Purity was determined by Coomassie brilliant blue-stained SDS-polyacrylamide gels. PecS concentration was determined based on its absorbance at 280 nm using the calculated extinction coefficient (8,250 M−1 cm−1). All experiments were performed with His6-tagged PecS.
DNA binding assays.
The intergenic segment between PecS (SCO2647) and SCO2646 genes was amplified from S. coelicolor genomic DNA using primers pecS-Fv (5′-GTGGCGGCCATGA-3′) and pecS-Rv (5′-TGCGACGAGTATCGG-3′). This 124-bp DNA contains the entire intergenic region and extends 1 bp into the coding region of SCO2647 and 11 bp into the coding region of SCO2646. Then, this DNA segment was 32P-labeled at the 5′ ends using T4-polynucleotide kinase (T4-PNK). In titration experiments, 32P-labeled pecO (0.10 nM) was incubated with PecS in binding buffer (25 mM Tris [pH 7.5], 50 mM NaCl, 0.06% detergent BRIJ58 [Pierce], 10 μg/ml bovine serum albumin [BSA], 2% glycerol) at 25°C for 20 min. Complex and free DNA was separated on 6% nondenaturing polyacrylamide gels (39:1 [wt/wt] acrylamide-bisacrylamide). The gel was prerun for about 20 min in 0.5× Tris–borate–EDTA (TBE) buffer at 4°C before the samples were loaded and run at 10 V/cm for 2 h in 0.5× TBE buffer at 4°C. After the gel was dried, it was exposed to phosphor screens. A Storm 840 phosphorimager (GE Healthcare) was used to visualize and scan results. The densitometric result was quantified using ImageQuant 5.1 (Molecular Dynamics). The quantitative data were fitted to the Hill equation: f = fmax · [TamR]n/(K + [TamR]n), where [TamR] is the protein concentration, f is the fractional saturation, K is a constant, and n is the Hill coefficient.
To determine the effect of ligand binding on PecS, the binding buffer used was 0.5 M Tris (pH 7.5), 50 mM NaCl, 0.06% BRIJ58, 10 μg/ml BSA, and 2% glycerol. Note that the higher buffer concentration was necessitated to prevent pH changes by the addition of ligands, which were dissolved in 0.4 M NaOH. This higher ionic strength reduces the affinity of PecS for both DNA and ligands. Reaction mixtures contained 1.25 nM PecS and 0.10 nM labeled DNA, except for the control (DNA only). After 20 min of incubation at 25°C, samples were analyzed using electrophoretic mobility shift assay (EMSA) under the conditions described above. Data were analyzed by fitting to the exponential decay equation: f = Ae−kL, where f is the fractional saturation, L is the ligand concentration, A is the saturation plateau, and k represents the exponential decay constant. Experiments designed to assess binding specificity were also performed under these conditions, with labeled DNA mixed with unlabeled pecO DNA or linearized pGEM5 DNA (3,000 bp) prior to the addition of protein. All quantitative results derive from at least three independent experiments.
Thermal stability.
PecS (10 μM) was diluted in a measurement buffer (200 μM Tris [pH 8.0], 200 mM NaCl), which contained reference fluorescent dye 5× SYPRO orange (Invitrogen). An Applied Biosystems 7500 real-time PCR system was used to measure the fluorescence emission at a range of temperatures (5 to 94°C) in 1°C increments for 45 s. A SYBR green filter was used in the measurement. The result from a reaction without protein was used to correct the fluorescence yield. Then, the sigmoidal part of the melting curve was fit to a four-parameter sigmoidal equation using Sigma Plot 9 to calculate the melting temperature. Eight independent experiments were performed for this measurement.
In vivo regulation of gene activity.
S. coelicolor cultures, which were germinated from spores in ISP medium 1, were grown for 36 h before they were treated with urate (10 mM) for 4 h. After the 4-h incubation, cells were harvested by centrifugation and immediately washed twice using 50 mM sodium phosphate buffer (pH 6.4). The total RNA was then immediately isolated using the Illustra RNAspin isolation minikit (GE Healthcare). Then, avian myeloblastosis virus (AMV) reverse transcriptase (New England BioLabs) was used to generate cDNA for quantitative PCR (qPCR). Quantitative PCR was performed on an Applied Biosystems 7500 real-time PCR system using SYBR green I as the fluorescent dye. The rpoA gene (housekeeping gene encoding the RNA polymerase alpha subunit) was used as the internal control. The comparative threshold cycle (CT) (2−ΔΔCT) method was used for data analysis after the necessary data validations (25). The primers used in quantitative reverse transcription-PCR (qRT-PCR) were ScPecS-RT5 (5′-TGTCGGCCACGCTGATGC-3′), ScPecS-RT3 (5′-CGGTGAGGGTGACCTGGAGTC-3′), SCO2646-RT5 (5′-CGCTGGCGTACTGGCTCTGGTT-3′), SCO2646-RT3 (5′-CCCGTCAGGTCCATCGAATCTTTT-3′), RpoA-RT5 (5′-AAGCTGGAGATGGAGCTGAC-3′), and RpoA-RT3 (5′-TTGAGAACCGGCGAGTAGAT-3′).
Glutaraldehyde-mediated cross-linking.
After dilution with 50 mM sodium phosphate buffer (pH 7.0), 40 μM PecS in 50 mM sodium phosphate buffer (pH 7.0) was incubated in the presence of glutaraldehyde (0.1%, 0.2%, or 0.3%) at 25°C for 30 min. To terminate the reaction, 4× Laemmli sample buffer was used. Then, protein samples were loaded on an SDS-PAGE (15%) gel. The gel was stained with Coomassie brilliant blue after electrophoresis.
Gel filtration.
A Superose 12 10/300 column (inner diameter of 10 mm, bed length of 30 cm; GE Healthcare) was preequilibrated and eluted with mobile phase buffer (50 mM sodium phosphate buffer [pH 7.0], 150 mM NaCl, 2% glycerol) in a fast protein liquid chromatography (FPLC) system (ÄKTA FPLC; GE Healthcare) at 4°C. The flow rate was 0.5 ml/min for measurements. Several molecular mass markers (Bio-Rad gel filtration standard) were used to create the standard curve. These markers include γ-globulin (158.0 kDa), ovalbumin (44.0 kDa), myoglobin (17.0 kDa), and vitamin B12 (1,350 Da). The equation Kav = (VE − VO)/(VT − VO) was used to calculated the K average (Kav) of a protein. In this equation, VE, VO, and VT represent the retention volume of the protein, void volume of the column, and the geometric bed volume of the column, respectively.
Circular dichroism spectroscopy.
A Jasco J-815 circular dichroism spectrometer was used to measure the far UV circular dichroism spectrum. PecS (0.19 mg/ml) was in CD buffer (50 mM potassium phosphate buffer [pH 7.0], 20 mM KCl, 0.8% glycerol) during ellipticity measurements. A quartz cuvette with a 0.1-cm path length was used. All measurements were conducted at 1-nm steps in triplicate at 20°C. The results were corrected for buffer contributions to the signal. The SELCON3 program from the website DichroWeb was used to calculate the predicted secondary structure composition from the spectrum (26–28). The goodness of fit was determined from the normalized root mean square deviation (NRMSD) value of 0.034.
Fluorescence spectrum and tryptophan fluorescence quenching.
A Jasco FP-6300 spectrofluorimeter was used to measure the fluorescence emission spectra from 295 nm to 400 nm with an excitation wavelength set at 290 nm at 25°C. A 0.5-cm path length cuvette was used for the measurement. PecS (10 μM) was in FL buffer (40 mM Tris-HCl [pH 8.0], 100 mM NaCl, 10 mM MgCl2, 0.2 mM EDTA, 0.1% Brij58). To measure effects of ligand, ligands were dissolved in 0.4 M NaOH and serially diluted with 0.4 M NaOH. Ligand solution (1 μl; the control was an equal volume of 0.4 M NaOH) was contained in a 200-μl total volume reaction mixture (with 10 μM PecS in FL buffer) and incubated for 2 min before fluorescence measurement. Data analysis, including the inner filter effect correction, fluorescence quenching calculation, and fitting to the Hill equation, were carried out as described previously (29).
RESULTS
The genomic locus encoding PecS.
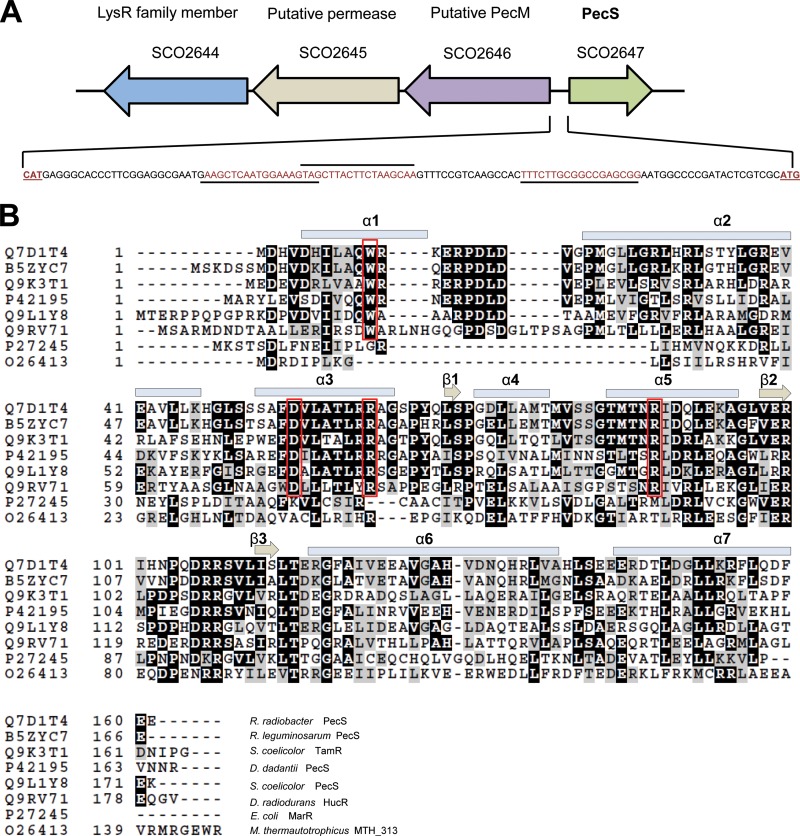
Previously characterized PecS proteins from R. radiobacter and D. dadantii are encoded divergently from pecM, which encodes a membrane transporter. This genomic locus organization is conserved in S. coelicolor (Fig. 1A). Locus SCO2647 encodes a MarR family transcriptional regulator with homology to PecS, and a divergently oriented gene encoding a putative integral membrane protein related to PecM (SCO2646) is separated from the pecS gene by an intergenic region of 112 bp. Two consecutive genes encoding another putative integral membrane protein (SCO2645) and an LysR family transcriptional regulator (SCO2644), respectively, are encoded on the same strand as SCO2646, with each pair of genes separated by approximately 30 bp.
Fig 1.
(A) The genetic organization of pecS and adjacent genes. Genes are represented by open arrows. An intergenic region of 112 bp separates pecS and pecM (SCO2646). The sequence of the intergenic region is shown with predicted binding sites underlined. (B) Sequence alignment of PecS and other MarR homologs. Secondary structure elements are based on the structure of HucR (10). E. coli MarR and MTH313 do not include the N-terminal helix α1 (46, 47).
This MarR homolog is annotated in the genome as PecS since the amino acid sequence is similar to that of D. dadantii PecS (about 40% identity); by comparison, PecS proteins from the plant pathogens D. dadantii and R. radiobacter share ∼45% identity. Moreover, the sequence of the membrane protein encoded by the divergent gene is highly similar to that of D. dadantii PecM (about 44% identity). The sequence of the intergenic region suggests that the common regulatory mechanism involving the transcriptional regulator binding to this region and repressing expression of the divergent genes may also apply to PecS. In the pecM-pecS intergenic region, several imperfect inverted repeats may be identified that could serve as binding sites for PecS (Fig. 1A). Notably, these sites share similarity to the UrtR consensus site, whose 9-bp half-sites are most conserved in the center (the central three bases of each consensus half-site are CTT and AAG) (5).
Amino acid sequence alignment of MarR homologs reveals that S. coelicolor PecS belongs to the UrtR subfamily. It contains the characteristic N-terminal extension seen in D. radiodurans HucR to form a helical segment as well as the four conserved amino acid residues (W22, D66, R73, R99) implicated in ligand binding (Fig. 1B). Significant conservation of residues in α3 is consistent with binding to a common ligand, as this secondary structure element lines the inferred ligand-binding pocket in HucR (10). Conservation of residues in α5, the DNA recognition helix, is consistent with shared features of the cognate DNA sites.
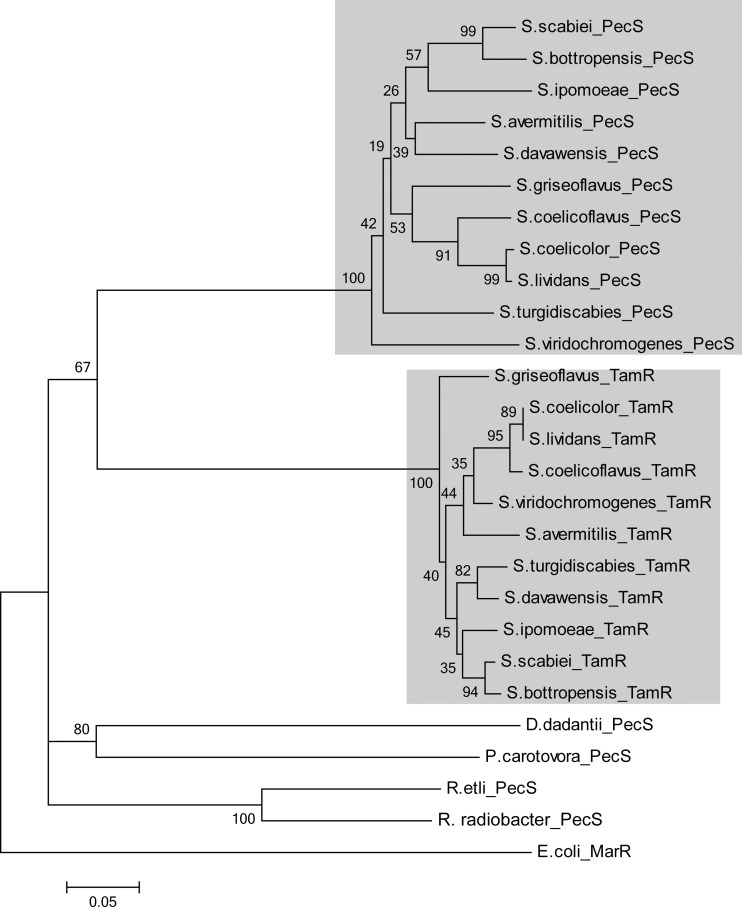
While UrtR homologs are not universally encoded by Streptomyces spp., as evidenced by BLASTP searches of the numerous available genomes using R. radiobacter PecS as a query, ∼20 species that encode PecS are found, all among the more than 40 that also encode TamR; assignment of UrtR homologs as either TamR or PecS was based on identification of the divergent gene as either tam (trans-aconitate methyltransferase) or pecM (eamA; encoding protein domains previously called DUF6). Using the sequences of 10 randomly selected Streptomyces spp. that encode PecS, a phylogenetic tree was created to illustrate the evolutionary relationship between TamR and PecS proteins (Fig. 2). TamR and PecS proteins form two separate clusters, consistent with divergence from a common ancestor and a shared function of PecS from Streptomyces spp. We also note that species encoding PecS include the few characterized pathogenic species for which sequence information is available, such as Streptomyces turgidiscabies and Streptomyces ipomoeae.
Fig 2.
Phylogenetic analysis of UrtR homologs. MEGA4 was used to generate the phylogenetic tree using the neighbor-joining method with 500 bootstrap replicates. The tree is drawn to scale. The scale bar represents an evolutionary distance of 0.05. Background shading denotes the subtree of PecS homologs from Streptomycetes and the subtree of TamR homologs.
PecS is a stable dimer.
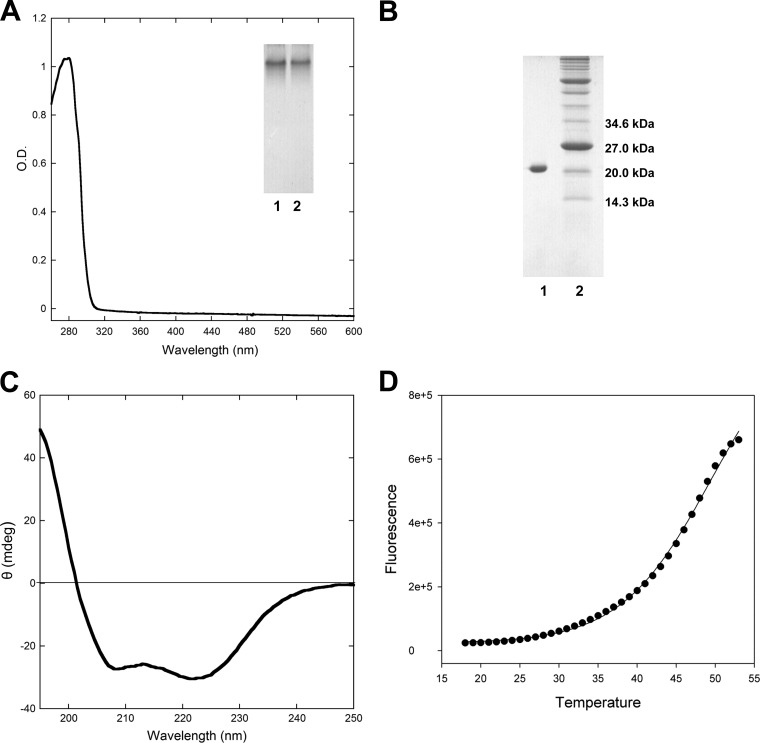
The pecS gene was amplified from S. coelicolor genomic DNA, cloned into pET28b, and overexpressed in E. coli. PecS with an N-terminal His6-tag was purified to apparent homogeneity, and it yielded a single band in an SDS-PAGE gel with a molecular mass consistent with the monomer (theoretical molecular mass of recombinant PecS is about 21 kDa; Fig. 3B). The UV-visible spectrum of PecS showed a single peak at a wavelength around 280 nm (Fig. 3A). PecS migrated as a single band in native gel electrophoresis, suggesting that it exists as a single species (Fig. 3A, inset). The far-UV circular dichroism spectroscopy revealed a secondary structure composition of PecS of about 52% α-helix, 6% β-sheet, 17% turn, and 25% unordered (Fig. 3C). This structure composition estimate is similar to the composition of HucR, which contains about 55% α-helix and 5% β-sheet (10). PecS had a melting temperature of 47.3 ± 0.5°C, indicating that it is stable at physiological temperatures (Fig. 3D).
Fig 3.
Characterization of purified PecS. (A) UV-visible absorption spectra of purified recombinant PecS. Insert, lanes 1 and 2, purified PecS in 10% native PAGE. (B) Purified recombinant PecS in a 15% SDS-PAGE gel. Lane 1, PecS; lane 2, molecular mass marker (Bio-Rad; molecular mass is indicated at the right). (C) Far-UV circular dichroism (CD) spectrum of purified PecS. Ellipticity measurements are represented in units of millidegrees (mdeg; machine units). (D) Melting temperature of PecS. Thermal denaturation is represented by the fluorescence emission resulting from the binding of SYPRO orange to denatured protein as a function of temperature.
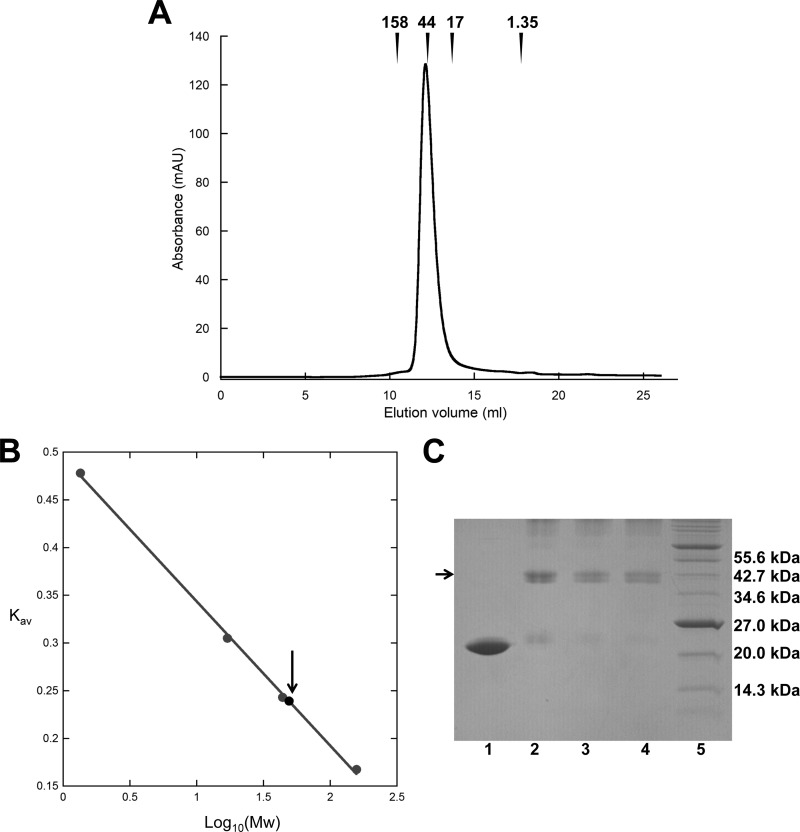
In order to determine the oligomeric state of purified PecS, size exclusion chromatography was used. Purified PecS eluted as a single peak in size exclusion chromatography, which is consistent with the single species seen after native gel electrophoresis. PecS eluted from the gel filtration column at about 49 kDa (Fig. 4A and B), consistent with the molecular mass of the dimer. In addition, glutaraldehyde-mediated cross-linking of PecS resulted in a doublet at the molecular mass of the dimer in SDS-PAGE gels, probably reflecting the formation of two different cross-linked species (Fig. 4C). These results revealed that purified PecS exists as a dimer, with the secondary structure composition and stability as expected for an MarR homolog.
Fig 4.
PecS exists mainly as dimer. (A) Size exclusion chromatography of purified recombinant PecS. Elution volumes of molecular weight standards are identified with arrows. (B) Gel filtration analysis of PecS and standards to determinate molecular weight. The standard curve was generated from the Kav of molecular mass standards (gray circles) versus Log10(Mw) of these standards. The Kav of PecS is indicated by an arrow. (C) Glutaraldehyde-mediated cross-linking of purified PecS. Lane 1, unmodified PecS; lanes 2 to 4, PecS cross-linked with 1%, 2%, and 3% glutaraldehyde, respectively; lane 5, molecular mass marker (molecular mass is indicated at the right). A 15% SDS-PAGE gel was used.
PecS binds to the pecM-pecS intergenic region.
Electrophoretic mobility shift assays (EMSAs) were used to detect the binding of PecS to pecO, a 124-bp DNA segment representing the pecM-pecS intergenic region. PecS bound to this DNA segment, forming multiple complexes, which indicates the presence of more than one binding site in pecO (Fig. 5A). A single PecS-pecO complex appeared at relatively low PecS concentrations, whereas more complexes formed gradually with increasing concentrations of PecS, with complex formation saturating at high PecS concentrations. The pattern of complex formation is consistent with gradual accumulation of additional PecS molecules on the DNA. Quantitation of EMSA data revealed half-maximal saturation of pecO at [PecS] values of 0.11 ± 0.03 nM, indicating high-affinity binding (Fig. 5B). The interaction between PecS and pecO is not cooperative (Hill coefficient of 1.0 ± 0.0), consistent with the gradual formation of complexes with lower electrophoretic mobility with increasing [PecS]. It should also be noted that the reported PecS concentration that achieves half-maximal saturation of the DNA does not reflect the affinity for a single site but rather an aggregate (or functional) affinity for the DNA, which contains multiple cognate sites. The functional affinity for the entire intergenic region may well be more physiologically relevant, assuming that other regions of the DNA are not inaccessible to PecS due to binding of other regulatory factors.
Fig 5.
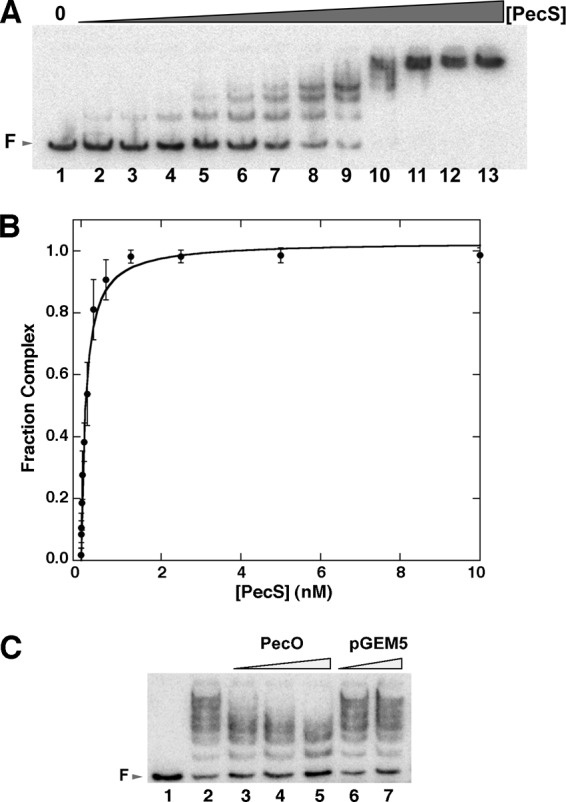
Binding of PecS to pecS-pecM intergenic region pecO. (A) Electrophoretic mobility shift assays showing binding of PecS to pecO. Labeled pecO (0.10 nM) was titrated with PecS (lanes 1 to 13, representing reactions with 0, 4.9 pM, 9.8 pM, 19.5 pM, 39.0 pM, 78.1 pM, 156.2 pM, 312.5 pM, 625.0 pM, 1.25 nM, 2.50 nM, 5.00 nM, 10.0 nM PecS). Free DNA (F) is identified by an arrow at the left. (B) Normalized fractional complex formation as a function of PecS concentration. Error bars represent standard deviations from three independent repeats. (C) Binding of labeled pecO (0.1 nM) to PecS (0.625 nM) was challenged with increasing concentration of unlabeled 124-bp pecO DNA (lanes 3 to 5, 0.1, 0.25, 0.5 nM) or a 3,000-bp plasmid, pGEM5 (lanes 6 and 7, 0.1 and 0.25 nM, respectively). The reaction mixture in lane 1 contained labeled DNA only. The reaction mixture in lane 2 contained no competitor DNA.
Specificity of PecS binding to pecO was assessed by EMSAs in which unlabeled specific DNA (pecO) or nonspecific DNA (plasmid pGEM5) was used to compete with labeled specific DNA (pecO) for PecS binding. The addition of unlabeled pecO could compete with labeled pecO for binding to PecS (Fig. 5C). However, complex formation between PecS and pecO was not affected by the addition of nonspecific pGEM5 DNA (up to 2.5-fold molar excess of the 3,000-bp pGEM5 compared to the concentration of the 124-bp pecO), which showed that the binding of PecS to DNA is specific.
Urate attenuates the binding of PecS to pecO.
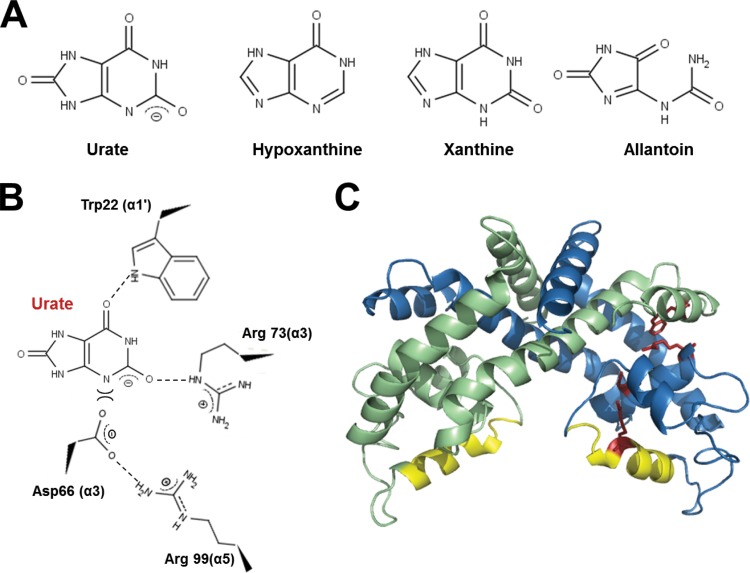
Since S. coelicolor PecS exhibits features that are characteristic of UrtR proteins, urate and several related intermediates in the purine degradation pathway were used to determine their effect on DNA binding by PecS. These ligands included xanthine, hypoxanthine, and allantoin (Fig. 6A). The four conserved amino acid residues, which are predicted to participate in urate binding, are labeled in the structure model of PecS (Fig. 6C). The predicted interactions between urate and these amino acids is based on the proposed model for interaction between HucR and urate, in which the Trp in α1 and the Arg in α3 interact with urate through a hydrogen bond and a salt bridge, respectively (7). The occupancy of urate in the binding pocket would result in the repulsion of Asp in α3, which would then cause displacement of the DNA recognition helix (α5) as Asp forms a salt bridge with Arg in α5. According to this model, xanthine mostly contains the functional groups necessary for binding, whereas both hypoxanthine and adenine lack some features necessary for efficient interaction.
Fig 6.
Model of PecS and ligand interaction. (A) Structure of urate and related ligands used in this study. Note that urate is fully deprotonated at the pH at which experiments are performed (pKa of ∼5.5), whereas xanthine has a higher pKa (∼7.7). (B) Predicted interactions between urate and amino acid residues in the ligand-binding pocket. (C) Homology model of PecS. The structure was generated by Phyre using HucR as the template (10, 48). The two monomers are shown in different colors (blue and green). Residues predicted to be important for urate coordination and urate-mediated conformational changes are shown in red (stick representation). The recognition helices (α5) are shown in yellow.
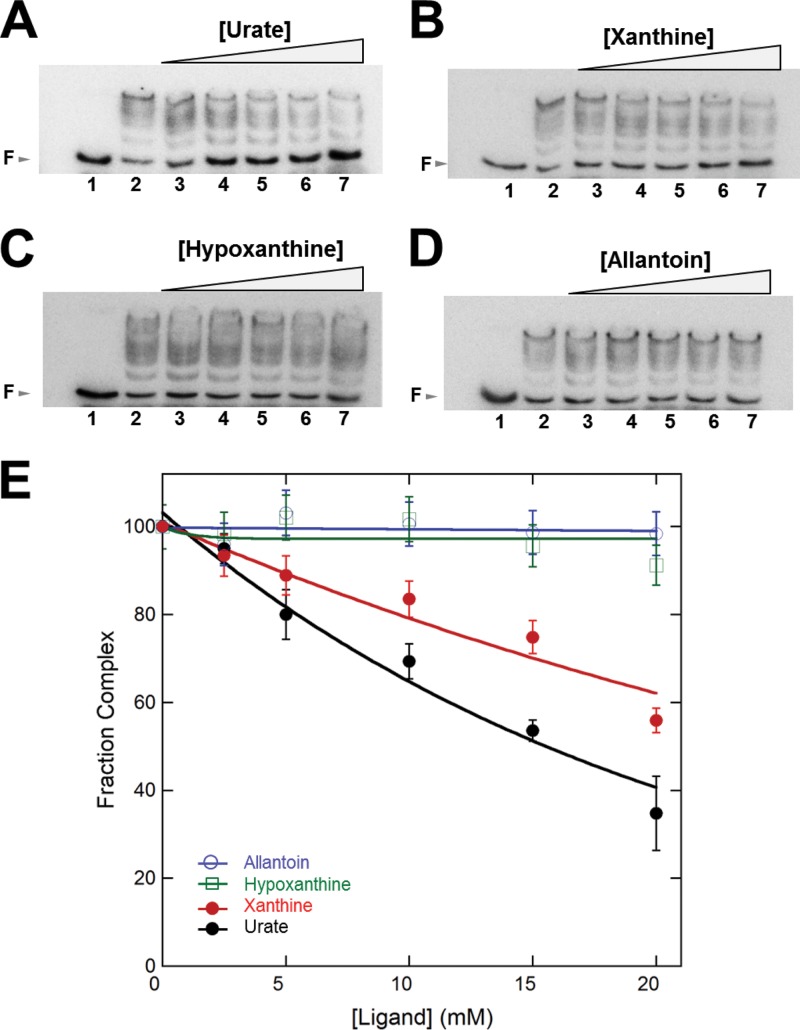
To measure the effect of ligands on DNA binding of PecS, complexes of PecS and pecO were challenged with increasing concentrations of urate, xanthine, hypoxanthine, or allantoin. A PecS concentration was selected that does not constitute a large excess to ensure that ligand binding will be readily detectable as a decrease in protein-DNA complex formation. EMSA results showed that urate significantly attenuated the binding between PecS and DNA with a 50% inhibitory concentration (IC50) value of 15.6 ± 0.5 mM (Fig. 7A and E; note that reactions are performed in a buffer of high ionic strength). Although xanthine can attenuate the binding between PecS and DNA, the effect is somewhat weaker, with an IC50 value of 29.0 ± 0.9 mM (Fig. 7B and E). In contrast, hypoxanthine and allantoin have no effect on binding of PecS to its target DNA pecO (Fig. 7C to E). This result shows that DNA binding by PecS could be attenuated by urate, and it is consistent with the effect of urate and related ligands on DNA binding by other UrtR subfamily members, D. radiodurans HucR, R. radiobacter PecS, and B. thailandensis MftR (7–9). The comparable ligand specificity is consistent with a shared ligand binding pocket and mechanism for attenuation of DNA binding.
Fig 7.
Effect of different ligands on the binding of PecS to pecO. Free DNA (F) is identified by arrows at the left. (A to D) Reactions in lane 1 contained labeled pecO DNA only. Ligand concentrations in lanes 2 to 7 were 0, 2.5, 5, 10, 15, 20 mM, respectively. Each reaction mixture contained 0.10 nM DNA and 1.25 nM PecS (lanes 2 to 7). Note that reaction mixtures contained 0.5 M Tris to prevent changes in pH upon the addition of ligands dissolved in sodium hydroxide; the difference in buffer composition also resulted in a different pattern of complex migration (less distinct separation of complexes) compared to that of reaction mixtures in Fig. 5A. (E) Normalized PecS-pecO complex formation as a function of ligand concentration. Error bars represent the standard deviations from three independent repeats.
PecS contains only one Trp residue per monomer, located at the predicted urate-binding site (Fig. 6C). Ligand binding to PecS would therefore be predicted to alter the environment of this tryptophan and cause a change in intrinsic fluorescence. When excited at a wavelength of 290 nm, PecS exhibited intrinsic fluorescence with a peak around 330 nm (Fig. 8A). A concentration-dependent fluorescence quenching was induced by urate and xanthine (Fig. 8B). The intrinsic fluorescence was significantly quenched by urate and to a lesser extent by xanthine; this is consistent with the effect of urate and xanthine on the intrinsic fluorescence of D. radiodurans HucR and R. radiobacter PecS (8, 29). Binding affinity of these ligands was analyzed by fitting the fluorescence quenching as a function of ligand concentration to the Hill equation. Urate bound PecS with a dissociation constant (Kd) value of 0.17 ± 0.01 mM and no cooperativity (nH = 1.0 ± 0.1), and xanthine bound PecS with a Kd value of 0.10 ± 0.03 mM (nH = 1.3 ± 0.3).
Fig 8.
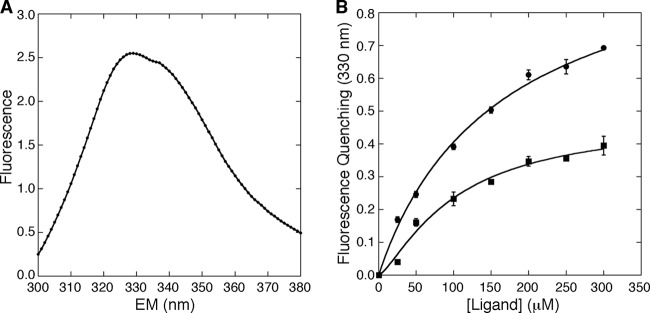
Fluorescence profile of PecS and effect of ligand binding on intrinsic fluorescence. (A) Intrinsic fluorescence spectrum of PecS. The excitation wavelength was 290 nm. (B) Fluorescence quenching as a function of ligand concentration. The change of PecS intrinsic fluorescence at 330 nm was measured in the presence of urate (filled circles) or xanthine (filled squares). The excitation wavelength was 290 nm. Error bars represent the standard deviations from three independent repeats.
We have previously shown that incubation of S. coelicolor TamR with urate has little effect on DNA binding, suggesting optimization of the TamR ligand-binding pocket for association with trans-aconitate and structurally related molecules (17). For PecS, we compared binding to pecO, for which half-maximal saturation is ∼0.1 nM, with its binding to two different promoters that are regulated by TamR (genes encoding malate dehydrogenase [SCO4827] and isocitrate dehydrogenase [SCO7000]) and found no detectable complex formation at [PecS] up to 10 nM (data not shown). This suggests that DNA binding domains of TamR and PecS and their respective DNA sites have diverged sufficiently to prevent protein association with noncognate DNA.
In vivo effect of urate on PecS-mediated gene regulation.
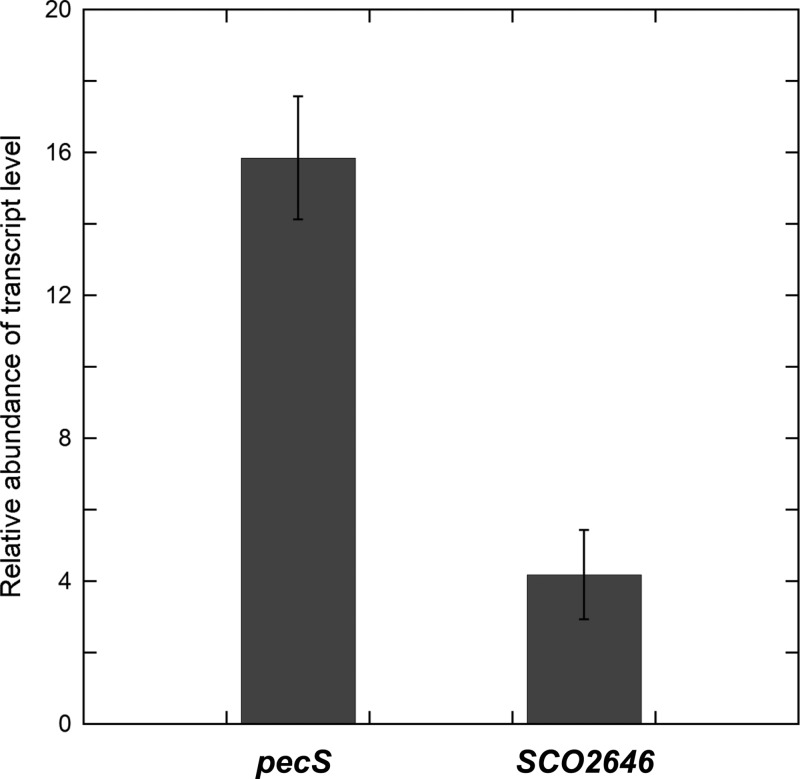
To measure the effect of urate on the transcriptional regulation by PecS, the transcript level of pecS and pecM was detected after S. coelicolor was exposed to exogenous urate. qRT-PCR results showed that the transcript level of pecS and pecM increased 15.9 ± 1.7-fold and 4.2 ± 1.2-fold, respectively, after exposure to 10 mM urate (Fig. 9). This significant increase in pecS and pecM mRNA levels after exposure to urate indicates that PecS can bind to the pecS-pecM intergenic region and regulate the transcription of these genes in vivo.
Fig 9.
In vivo gene expression of pecS and pecM. Relative abundance of pecS and pecM transcripts levels in S. coelicolor after exposure to 10 mM urate for 4 h. Relative mRNA levels of pecS and pecM genes and reference control gene (rpoA) were measured by qRT-PCR. Error bars represent standard deviations from three repeats.
DISCUSSION
Urate is a ligand for S. coelicolor PecS.
R. radiobacter PecS controls expression of pecM in response to exogenous urate (8). R. radiobacter is most likely to encounter urate when a host plant produces ROS as an antibacterial defense; hence, urate-mediated regulation of gene activity may contribute to host colonization. Consistent with this proposed mechanism, UrtR proteins are encoded mainly by bacterial species whose life cycle may include association with a living host (5). The soil bacterium S. coelicolor is an exception. Not only does S. coelicolor encode TamR, a UrtR homolog with altered ligand specificity, but it also encodes a protein with similarity to PecS from plant pathogens. S. coelicolor PecS binds urate directly, as evidenced by the ability of urate to quench its intrinsic fluorescence (Fig. 8B). Urate binding attenuates PecS binding to the pecS-pecM intergenic DNA (Fig. 7A and E), and in vivo analyses show that exposure to exogenous urate causes a significantly elevated expression of pecS and pecM genes (Fig. 9). These features indicate that urate functions as a ligand for S. coelicolor PecS.
An amino acid sequence alignment shows that PecS contains all the characteristics of UrtR proteins. PecS is predicted to contain the N-terminal helix (α1), which includes the Trp implicated in ligand binding. The coordination of urate is predicted to involve Trp22 in helix α1 and Arg73 and Asp66 in α3, with Arg99 in the DNA recognition helix α5 sensing ligand binding via its salt bridge with Asp66 (Fig. 6B and C). That urate attenuates DNA binding more efficiently than xanthine is consistent with the complete deprotonation of urate and the partial deprotonation of xanthine, yielding the requisite negative charge for a salt bridge with Arg73 and repulsion of Asp66 (Fig. 6) (7). Hypoxanthine and allantoin lack these negative charges and do not attenuate DNA binding, consistent with the proposed model.
The identified consensus sequence for UrtR proteins allowed the prediction of several binding sites in the pecS-pecM intergenic region (Fig. 1A). EMSA confirmed the existence of multiple PecS binding sites as evidenced by the observation that increasing PecS concentration led to the formation of additional complexes with reduced electrophoretic mobility. While the observed complexes may correspond to additional PecS proteins accumulating on the DNA, perhaps nucleated by PecS binding to an optimal site, it is also possible that the electrophoretic mobility of DNA with PecS bound to different combinations of sites may differ if PecS binding induces DNA distortion. Multiple binding sites in this intergenic region may facilitate differential regulation of the divergent genes. PecS represses transcription of pecS and pecM genes, a repression that most likely results from PecS either interfering with RNA polymerase binding to the promoter or preventing elongation of the transcript. Mapping of transcriptional starts would be a first step toward distinguishing these possibilities.
Conservation of PecS in pathogenic Streptomyces species.
The presence of multiple UrtR homologs is consistent with the frequent gene duplication and horizontal gene transfer events that have been inferred to occur in Streptomyces spp. (30). Neither TamR nor PecS homologs are ubiquitously present in Streptomyces species. It is notable, however, that the about 20 Streptomyces species presently seen to encode a PecS homolog are found only among the more than 40 that encode TamR, perhaps reflecting a gene duplication event followed by divergence to develop a novel function and ligand specificity.
Only few pathogenic Streptomyces species have been characterized. Notably, the pathogenic species for which sequence information is available encode PecS, including the plant pathogens S. ipomoeae, Streptomyces scabiei, Streptomyces acidiscabies, and S. turgidiscabies and the human pathogen Streptomyces somaliensis (31–34). The pathogenicity of Streptomyces spp. results from a diverse set of factors. For species that cause scab symptoms, for example, the cellulose synthesis inhibitor thaxtomin is a pivotal virulence factor (35, 36), and other conserved virulence determinants include Nec1, a secreted protein which can cause necrosis of the host cell (37). The conservation of PecS in pathogenic Streptomyces species would be consistent with its role in promoting survival under the oxidative stress conditions elicited by the host upon bacterial infection. By analogy to the inferred function of PecS in R. radiobacter, PecS encoded by pathogenic Streptomyces species is likely to encounter urate produced by the host upon bacterial infection. As urate is a longer-lived species than the ROS also produced as a first defense against the invasion, it may augment the bacterial defense against ROS. Both urate and ROS may activate cognate transcription factors and elicit expression of genes required for ROS defense and virulence.
D. dadantii PecS and S. coelicolor PecS share ∼40% sequence identity, which is relatively high considering the phylogenetic distance between these species. In addition, the regulated gene SCO2646 encodes a putative integral membrane protein with about 44% identity to D. dadantii PecM. The SCO2645 gene locus also encodes a putative integral membrane protein with two copies of Pfam entry PF00892 (DUF6); however, this protein shares only 27% identity to D. dadantii PecM. D. dadantii PecM functions to excrete indigoidine, an antioxidant involved in ROS defense (11, 13). Considering the significant conservation of both PecS and PecM proteins, S. coelicolor PecS may likewise be involved in ROS defense by sensing urate produced when xanthine oxidase generates ROS. Consistent with this inference, Streptomyces spp. have been shown to produce indigoidine (38). Based on the conservation of D. dadantii and S. coelicolor PecM proteins and the ability of both Dickeya and Streptomyces species to produce the antioxidant indigoidine, we speculate that the PecM homolog from Streptomyces species likewise exports indigoidine or perhaps other antioxidants to combat ROS. The inferred functions of both PecS and PecM in oxidative stress responses could be addressed by inactivation of the respective genes; since inactivation of pecS should result in constitutive expression of pecM, this strain may be more resistant to oxidative stress. In contrast, inactivation of pecM might result in increased sensitivity to oxidative stress.
TamR, which is also encoded by pathogenic Streptomyces spp., functions to ensure metabolic flux through the citric acid cycle during oxidative stress (17). While TamR and PecS likely derive from a common ancestor yet have evolved distinct functions and ligand specificities, they apparently both function to control gene activity during oxidative stress. Selective pressures associated with efficient responses to ROS may therefore have formed the basis for evolution and retention of tamR and pecS genes in select Streptomyces species.
Potential reasons for the existence of a urate-responsive transcriptional regulator in S. coelicolor.
Most Streptomyces spp. are not pathogens, and yet several encode divergent pecS-pecM genes. However, the soil is a very competitive environment for microorganisms, not only because of limited nutrition and variable physical conditions (such as temperature and moisture) but also because of fierce competition between organisms that occupy this ecological niche. Competitive strategies employed include the production of antibiotics or other bioactive metabolites, and plants secrete both ROS and other compounds in response to stress or pathogen invasion. In addition, many streptomycetes play important roles in plant-associated microbial communities. For instance, some streptomycetes form symbioses with plants in the rhizosphere and decrease the possibility of those plants being invaded by pathogenic organisms (39, 40). In this case, if pathogens successfully invade the plant cell, both pathogens and streptomycetes may be exposed to bursts of ROS. The mechanical injury of plant roots caused by animals or other factors may also result in the exposure of streptomycetes to ROS (41, 42). In addition, plant activity, such as root tip growth, may result in an ROS burst in the surrounding rhizosphere (43).
Many Streptomyces species colonize the rhizosphere. Their successful colonization of this complex ecological niche has in part been attributed to their prolific production of antimicrobials. Both streptomycetes that inhabit the rhizosphere as well as endophytic species have been shown to prime plants against pathogens, reflecting induction of defense systems in the plant (44). Conversely, analysis of the S. coelicolor proteome after exposure to plant exudates shows differential expression of several proteins, including proteins required for utilization of specific carbon sources and proteins involved in stress adaptation, such as superoxide dismutase (45). We speculate that the oxidative stress response induced in S. coelicolor upon exposure to plant material includes detection of plant-derived urate. Streptomycetes inhabiting the rhizosphere may use elevated exogenous urate concentrations as a signal to prepare for ROS tolerance; as noted above, an advantage to detecting urate in addition to sensing the ROS directly may be the longer half-life of urate than the highly reactive ROS. In addition, if urate produced by xanthine oxidase is detected, the corresponding response can also defend against ROS produced by other systems (mainly NADPH oxidase).
ACKNOWLEDGMENTS
We thank Marcia Newcomer for the use of her FPLC and spectrofluorimeter.
This work was supported in part by the National Science Foundation (MCB-1051610 to A.G.).
Footnotes
Published ahead of print 30 August 2013
REFERENCES
- 1.Perera IC, Grove A. 2010. Molecular mechanisms of ligand-mediated attenuation of DNA binding by MarR family transcriptional regulators. J. Mol. Cell Biol. 2:243–254 [DOI] [PubMed] [Google Scholar]
- 2.Grove A. 2013. MarR family transcription factors. Curr. Biol. 23:R142–R143 [DOI] [PubMed] [Google Scholar]
- 3.Reverchon S, Nasser W, Robert-Baudouy J. 1994. pecS: a locus controlling pectinase, cellulase and blue pigment production in Erwinia chrysanthemi. Mol. Microbiol. 11:1127–1139 [DOI] [PubMed] [Google Scholar]
- 4.Ariza RR, Cohen SP, Bachhawat N, Levy SB, Demple B. 1994. Repressor mutations in the marRAB operon that activate oxidative stress genes and multiple antibiotic resistance in Escherichia coli. J. Bacteriol. 176:143–148 [DOI] [PMC free article] [PubMed] [Google Scholar]
- 5.Perera IC, Grove A. 2011. MarR homologs with urate-binding signature. Protein Sci. 20:621–629 [DOI] [PMC free article] [PubMed] [Google Scholar]
- 6.Wilkinson SP, Grove A. 2004. HucR, a novel uric acid-responsive member of the MarR family of transcriptional regulators from Deinococcus radiodurans. J. Biol. Chem. 279:51442–51450 [DOI] [PubMed] [Google Scholar]
- 7.Perera IC, Lee YH, Wilkinson SP, Grove A. 2009. Mechanism for attenuation of DNA binding by MarR family transcriptional regulators by small molecule ligands. J. Mol. Biol. 390:1019–1029 [DOI] [PubMed] [Google Scholar]
- 8.Perera IC, Grove A. 2010. Urate is a ligand for the transcriptional regulator PecS. J. Mol. Biol. 402:539–551 [DOI] [PubMed] [Google Scholar]
- 9.Grove A. 2010. Urate-responsive MarR homologs from Burkholderia. Mol. Biosyst. 6:2133–2142 [DOI] [PubMed] [Google Scholar]
- 10.Bordelon T, Wilkinson SP, Grove A, Newcomer ME. 2006. The crystal structure of the transcriptional regulator HucR from Deinococcus radiodurans reveals a repressor preconfigured for DNA binding. J. Mol. Biol. 360:168–177 [DOI] [PubMed] [Google Scholar]
- 11.Praillet T, Reverchon S, Nasser W. 1997. Mutual control of the PecS/PecM couple, two proteins regulating virulence-factor synthesis in Erwinia chrysanthemi. Mol. Microbiol. 24:803–814 [DOI] [PubMed] [Google Scholar]
- 12.Hommais F, Oger-Desfeux C, Van Gijsegem F, Castang S, Ligori S, Expert D, Nasser W, Reverchon S. 2008. PecS is a global regulator of the symptomatic phase in the phytopathogenic bacterium Erwinia chrysanthemi 3937. J. Bacteriol. 190:7508–7522 [DOI] [PMC free article] [PubMed] [Google Scholar]
- 13.Rouanet C, Nasser W. 2001. The PecM protein of the phytopathogenic bacterium Erwinia chrysanthemi, membrane topology and possible involvement in the efflux of the blue pigment indigoidine. J. Mol. Microbiol. Biotechnol. 3:309–318 [PubMed] [Google Scholar]
- 14.Sandalio LM, Fernandez VM, Ruperez FL, Del Rio LA. 1988. Superoxide free radicals are produced in glyoxysomes. Plant Physiol. 87:1–4 [DOI] [PMC free article] [PubMed] [Google Scholar]
- 15.Bolwell GP, Bindschedler LV, Blee KA, Butt VS, Davies DR, Gardner SL, Gerrish C, Minibayeva F. 2002. The apoplastic oxidative burst in response to biotic stress in plants: a three-component system. J. Exp. Bot. 53:1367–1376 [PubMed] [Google Scholar]
- 16.Yoshioka H, Bouteau F, Kawano T. 2008. Discovery of oxidative burst in the field of plant immunity: looking back at the early pioneering works and towards the future development. Plant Signal Behav. 3:153–155 [DOI] [PMC free article] [PubMed] [Google Scholar]
- 17.Huang H, Grove A. 2013. The transcriptional regulator TamR from Streptomyces coelicolor controls a key step in central metabolism during oxidative stress. Mol. Microbiol. 87:1151–1166 [DOI] [PubMed] [Google Scholar]
- 18.Hodgson DA. 2000. Primary metabolism and its control in streptomycetes: a most unusual group of bacteria. Adv. Microb. Physiol. 42:47–238 [DOI] [PubMed] [Google Scholar]
- 19.Laskaris P, Tolba S, Calvo-Bado L, Wellington EM. 2010. Coevolution of antibiotic production and counterresistance in soil bacteria. Environ. Microbiol. 12:783–796 [DOI] [PubMed] [Google Scholar]
- 20.Haas D, Keel C. 2003. Regulation of antibiotic production in root-colonizing Pseudomonas spp. and relevance for biological control of plant disease. Annu. Rev. Phytopathol. 41:117–153 [DOI] [PubMed] [Google Scholar]
- 21.Slattery M, Rajbhandari I, Wesson K. 2001. Competition-mediated antibiotic induction in the marine bacterium Streptomyces tenjimariensis. Microb. Ecol. 41:90–96 [DOI] [PubMed] [Google Scholar]
- 22.Tamura K, Dudley J, Nei M, Kumar S. 2007. MEGA4: Molecular Evolutionary Genetics Analysis (MEGA) software version 4.0. Mol. Biol. Evol. 24:1596–1599 [DOI] [PubMed] [Google Scholar]
- 23.Saitou N, Nei M. 1987. The neighbor-joining method: a new method for reconstructing phylogenetic trees. Mol. Biol. Evol. 4:406–425 [DOI] [PubMed] [Google Scholar]
- 24.Kieser T, Bibb MJ, Buttner MJ, Chater KF, Hopwood DA. 2000. Practical Streptomyces genetics. John Innes Foundation, Norwich, United Kingdom [Google Scholar]
- 25.Schmittgen TD, Livak KJ. 2008. Analyzing real-time PCR data by the comparative C(T) method. Nat. Protoc. 3:1101–1108 [DOI] [PubMed] [Google Scholar]
- 26.Whitmore L, Wallace BA. 2004. DICHROWEB, an online server for protein secondary structure analyses from circular dichroism spectroscopic data. Nucleic Acids Res. 32:W668–W673 [DOI] [PMC free article] [PubMed] [Google Scholar]
- 27.Whitmore L, Wallace BA. 2008. Protein secondary structure analyses from circular dichroism spectroscopy: methods and reference databases. Biopolymers 89:392–400 [DOI] [PubMed] [Google Scholar]
- 28.Sreerama N, Venyaminov SY, Woody RW. 1999. Estimation of the number of alpha-helical and beta-strand segments in proteins using circular dichroism spectroscopy. Protein Sci. 8:370–380 [DOI] [PMC free article] [PubMed] [Google Scholar]
- 29.Wilkinson SP, Grove A. 2005. Negative cooperativity of uric acid binding to the transcriptional regulator HucR from Deinococcus radiodurans. J. Mol. Biol. 350:617–630 [DOI] [PubMed] [Google Scholar]
- 30.Zhou Z, Gu J, Li YQ, Wang Y. 2012. Genome plasticity and systems evolution in Streptomyces. BMC Bioinformatics 13(Suppl 10):S8. [DOI] [PMC free article] [PubMed] [Google Scholar]
- 31.Bignell DR, Huguet-Tapia JC, Joshi MV, Pettis GS, Loria R. 2010. What does it take to be a plant pathogen: genomic insights from Streptomyces species. Antonie Van Leeuwenhoek 98:179–194 [DOI] [PubMed] [Google Scholar]
- 32.Lerat S, Simao-Beaunoir AM, Beaulieu C. 2009. Genetic and physiological determinants of Streptomyces scabies pathogenicity. Mol. Plant Pathol. 10:579–585 [DOI] [PMC free article] [PubMed] [Google Scholar]
- 33.Loria R, Kers J, Joshi M. 2006. Evolution of plant pathogenicity in Streptomyces. Annu. Rev. Phytopathol. 44:469–487 [DOI] [PubMed] [Google Scholar]
- 34.Kirby R, Sangal V, Tucker NP, Zakrzewska-Czerwinska J, Wierzbicka K, Herron PR, Chu CJ, Chandra G, Fahal AH, Goodfellow M, Hoskisson PA. 2012. Draft genome sequence of the human pathogen Streptomyces somaliensis, a significant cause of actinomycetoma. J. Bacteriol. 194:3544–3545 [DOI] [PMC free article] [PubMed] [Google Scholar]
- 35.Loria R, Bignell DR, Moll S, Huguet-Tapia JC, Joshi MV, Johnson EG, Seipke RF, Gibson DM. 2008. Thaxtomin biosynthesis: the path to plant pathogenicity in the genus Streptomyces. Antonie Van Leeuwenhoek 94:3–10 [DOI] [PubMed] [Google Scholar]
- 36.Guan D, Grau BL, Clark CA, Taylor CM, Loria R, Pettis GS. 2012. Evidence that thaxtomin C is a pathogenicity determinant of Streptomyces ipomoeae, the causative agent of Streptomyces soil rot disease of sweet potato. Mol. Plant Microbe Interact. 25:393–401 [DOI] [PubMed] [Google Scholar]
- 37.Bukhalid RA, Chung SY, Loria R. 1998. nec1, a gene conferring a necrogenic phenotype, is conserved in plant-pathogenic Streptomyces spp. and linked to a transposase pseudogene. Mol. Plant Microbe Interact. 11:960–967 [DOI] [PubMed] [Google Scholar]
- 38.Takahashi H, Kumagai T, Kitani K, Mori M, Matoba Y, Sugiyama M. 2007. Cloning and characterization of a Streptomyces single module type non-ribosomal peptide synthetase catalyzing a blue pigment synthesis. J. Biol. Chem. 282:9073–9081 [DOI] [PubMed] [Google Scholar]
- 39.Sardi P, Saracchi M, Quaroni S, Petrolini B, Borgonovi GE, Merli S. 1992. Isolation of endophytic Streptomyces strains from surface-sterilized roots. Appl. Environ. Microbiol. 58:2691–2693 [DOI] [PMC free article] [PubMed] [Google Scholar]
- 40.Tokala RK, Strap JL, Jung CM, Crawford DL, Salove MH, Deobald LA, Bailey JF, Morra MJ. 2002. Novel plant-microbe rhizosphere interaction involving Streptomyces lydicus WYEC108 and the pea plant (Pisum sativum). Appl. Environ. Microbiol. 68:2161–2171 [DOI] [PMC free article] [PubMed] [Google Scholar]
- 41.Razem FA, Bernards MA. 2003. Reactive oxygen species production in association with suberization: evidence for an NADPH-dependent oxidase. J. Exp. Bot. 54:935–941 [DOI] [PubMed] [Google Scholar]
- 42.Sagi M, Davydov O, Orazova S, Yesbergenova Z, Ophir R, Stratmann JW, Fluhr R. 2004. Plant respiratory burst oxidase homologs impinge on wound responsiveness and development in Lycopersicon esculentum. Plant Cell 16:616–628 [DOI] [PMC free article] [PubMed] [Google Scholar]
- 43.Monshausen GB, Bibikova TN, Messerli MA, Shi C, Gilroy S. 2007. Oscillations in extracellular pH and reactive oxygen species modulate tip growth of Arabidopsis root hairs. Proc. Natl. Acad. Sci. U. S. A. 104:20996–21001 [DOI] [PMC free article] [PubMed] [Google Scholar]
- 44.Lehr NA, Schrey SD, Hampp R, Tarkka MT. 2008. Root inoculation with a forest soil streptomycete leads to locally and systemically increased resistance against phytopathogens in Norway spruce. New Phytol. 177:965–976 [DOI] [PubMed] [Google Scholar]
- 45.Langlois P, Bourassa S, Poirier GG, Beaulieu C. 2003. Identification of Streptomyces coelicolor proteins that are differentially expressed in the presence of plant material. Appl. Environ. Microbiol. 69:1884–1889 [DOI] [PMC free article] [PubMed] [Google Scholar]
- 46.Alekshun MN, Levy SB, Mealy TR, Seaton BA, Head JF. 2001. The crystal structure of MarR, a regulator of multiple antibiotic resistance, at 2.3 A resolution. Nat. Struct. Biol. 8:710–714 [DOI] [PubMed] [Google Scholar]
- 47.Saridakis V, Shahinas D, Xu X, Christendat D. 2008. Structural insight on the mechanism of regulation of the MarR family of proteins: high-resolution crystal structure of a transcriptional repressor from Methanobacterium thermoautotrophicum. J. Mol. Biol. 377:655–667 [DOI] [PubMed] [Google Scholar]
- 48.Kelley LA, Sternberg MJ. 2009. Protein structure prediction on the Web: a case study using the Phyre server. Nat. Protoc. 4:363–371 [DOI] [PubMed] [Google Scholar]


