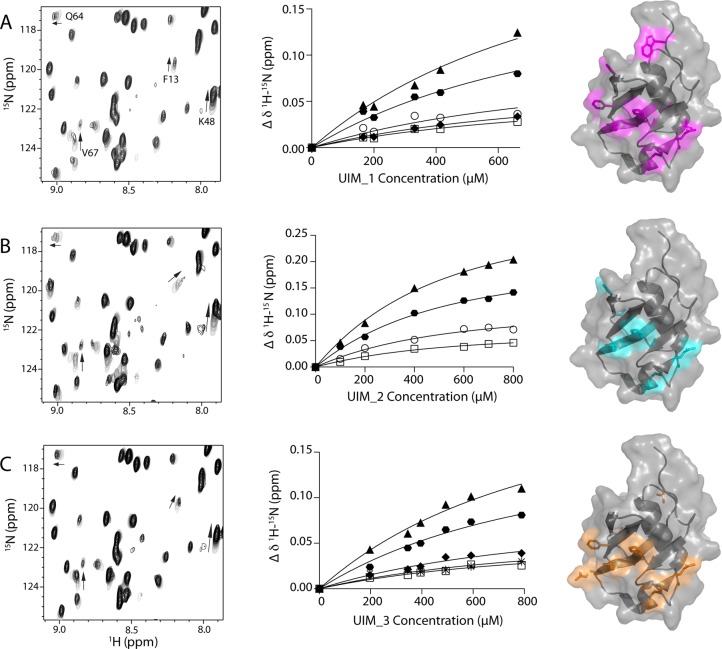
Figure 4.
Individual UIM regions in ataxin-3 bind similarly to the parkin Ubl domain. Regions of 1H–15N HSQC spectra of the 15N-labeled parkin Ubl domain (100 μM) showing selected residues that exhibit changes in chemical shifts upon addition of (A) UIM_1, (B) UIM_2, and (C) UIM_3. The change in chemical shift as a function of increasing ataxin-3 protein concentration is shown for residues F13, K48, V67, and Q64. The middle panels show the binding curves for (A) UIM_1, (B) UIM_2, and (C) UIM_3 with the parkin Ubl domain derived from NMR data. The data were globally fit for 1:1 binding using eq 2 to determine the apparent dissociation constants; KD,UIM_I = 840 ± 189 μM, KD,UIM_2 = 502 ± 41 μM, and KD,UIM_3 = 921 ± 165 μM. In each case, fits were completed using residues K48 (▲), E49 (⬣), H68 (○), Q64 (◆), L61 (□), and V43 (∗). The right panel depicts the corresponding surface representations of the parkin Ubl domain (Protein Data Bank entry 1IYF) showing residues affected by binding of UIM_1 (purple), UIM_2 (cyan), and UIM_3 (orange). The surface representations were created in PyMOL (PyMOL Molecular Graphics System, version 1.5.0.4, Schrödinger, LLC).

