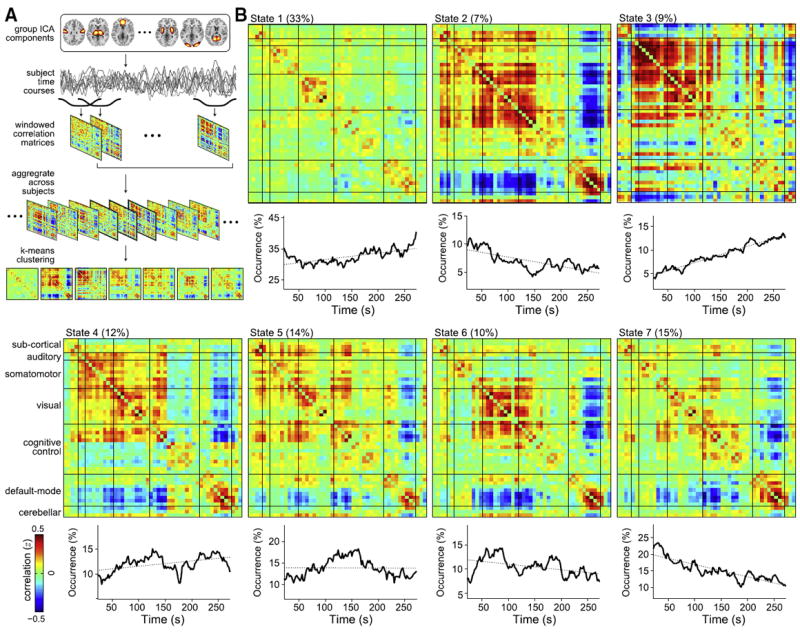
Fig. 2.

Detection of functional connectivity (FC) states with a sliding window/clustering approach. (A) An overview of the analysis. Group ICA is used to decompose resting-state data into intrinsic networks. Correlation matrices are computed from windowed portions of each subject’s component time series and the matrices are aggregated across subjects. K-means clustering is applied to the correlation matrices to find repeating patterns of connectivity, referred to as FC states. (B) Cluster centroids for FC States 1–7 show patterns in connectivity that are not apparent from stationary models. Below each centroid is the number of occurrences (in percentage units) of the state as a function of time. Linear fits (dotted lines) suggest a prominent increase in the appearance of State 3 over time, and decreases in the appearance of States 2 and 7. Adapted with permission from Allen et al. (in press).
