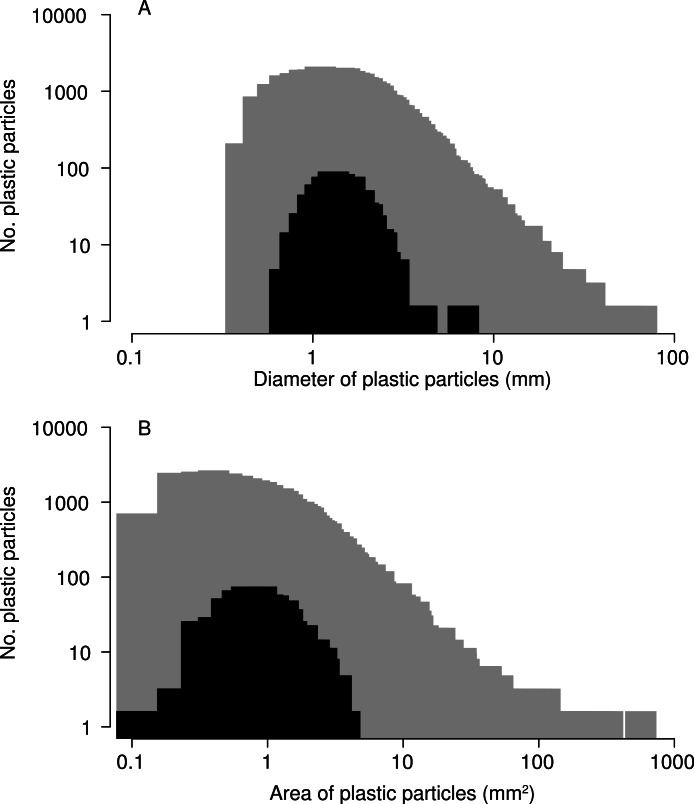
Figure 4. Size of microplastic particles ingested by barnacles.
Size–frequency distributions for (A) maximum diameter and (B) two-dimensional surface area of particles ingested by barnacles (black; N = 507) compared to of all microplastic particles collected in 2009 (grey; N = 30,518). Note: 518 microplastic particles were recovered from barnacles, but 11 were lost before they could be photographed for this analysis.

