

Abstract
The urine concentrating mechanism in the mammalian renal inner medulla (IM) is not understood, although it is generally considered to involve countercurrent flows in tubules and blood vessels. A possible role for the three-dimensional relationships of these tubules and vessels in the concentrating process is suggested by recent reconstructions from serial sections labelled with antibodies to tubular and vascular proteins and mathematical models based on these studies. The reconstructions revealed that the lower 60% of each descending thin limb (DTL) of Henle’s loops lacks water channels (aquaporin-1) and osmotic water permeability and ascending thin limbs (ATLs) begin with a prebend segment of constant length. In the outer zone of the IM (i) clusters of coalescing collecting ducts (CDs) form organizing motif for loops of Henle and vasa recta; (ii) DTLs and descending vasa recta (DVR) are arrayed outside CD clusters, whereas ATLs and ascending vasa recta (AVR) are uniformly distributed inside and outside clusters; (iii) within CD clusters, interstitial nodal spaces are formed by a CD on one side, AVR on two sides, and an ATL on the fourth side. These spaces may function as mixing chambers for urea from CDs and NaCl from ATLs. In the inner zone of the IM, cluster organization disappears and half of Henle’s loops have broad lateral bends wrapped around terminal CDs. Mathematical models based on these findings and involving solute mixing in the interstitial spaces can produce urine slightly more concentrated than that of a moderately antidiuretic rat but no higher.
Keywords: mathematical models, renal inner medulla, three-dimensional reconstructions, urine concentrating mechanism
Mammals, in general, are capable of producing urine hyperosmotic to their plasma, thereby conserving water while excreting solutes. This concentrating process is correlated with the generation of a gradient of increasing osmolality within the renal medulla from the corticomedullary junction to the tip of the papilla (Hai & Thomas 1969; Knepper 1982; Wirz et al. 1951). This corticopapillary gradient involves the increasing disposition of solutes, notably NaCl and urea, in cells, interstitial spaces, and tubular and vascular spaces (Atherton et al. 1971; Beck et al. 1985; Gottschalk & Mylle 1959). In the presence of antidiuretic hormone, the osmotic water permeability of the collecting ducts (CDs) increases, water moves from the CDs into the more concentrated surrounding interstitium, and the osmolality of the CD fluid also increases. During maximum antidiuresis, this CD osmolality nearly equals that of the surrounding interstitium.
The process by which this corticopapillary osmotic gradient is generated has been a central concern in understanding the urine concentrating mechanism. Theoretical and experimental studies performed between 1940 and 1960 (Gottschalk & Mylle 1959; Hargitay & Kuhn 1951; Kuhn & Ramel 1959; Kuhn & Ryffel 1942) indicated that a small osmotic pressure difference between the descending and ascending limbs of Henle’s loops, generated by net transport of solute, unaccompanied by water out of the thick ascending limbs (TALs), could be multiplied by countercurrent flow in the loops to generate the corticopapillary osmotic gradient. This concept, with minor modifications, has been widely accepted for the outer medulla (OM), for which active transport of NaCl out of the water-impermeable TAL has been well established experimentally (Burg & Green 1973, Rocha & Kokko 1973) and shown by modelling studies (Layton & Layton 2005) to be sufficient to generate the observed gradient.
However, a system of active solute transport out of ascending limbs multiplied by countercurrent flow cannot explain the osmotic gradient generated in the inner medulla (IM). Although the ascending thin limbs (ATLs) found in the IM are essentially impermeable to water (Imai & Kokko 1974, Chou & Knepper 1992, Yool et al. 2002), they display no active transepithelial transport of NaCl or any other solute (Marsh & Solomon 1965, Imai & Kokko 1974, Marsh & Azen 1975, Imai & Kusano 1982). Nevertheless, the IM is the region in which the steepest osmotic gradient is generated. For example, in rats producing maximally concentrated urine, the interstitial osmolality at the tip of the papilla is about nine times that of the cortex, whereas at the OM–IM border, it is only about twice that of the cortex. If this gradient cannot be generated by the same mechanism as in the OM, how then is it generated? It is probably fair to say that most scientists studying renal function believe that some form of countercurrent multiplication by the thin limbs of Henle’s loops is involved in generation of the gradient and that washout is delayed by countercurrent exchange in the vasa recta. However, there is no generally accepted mechanism for how a countercurrent multiplication system might work.
The most commonly cited and influential explanation of the concentrating process in the IM is the ‘passive mechanism’ hypothesis proposed independently in 1972 by Kokko & Rector (1972) and Stephenson (1972). They proposed that the separation of NaCl from urea by the active transport of NaCl (without water or urea) out of the TAL in the OM would provide a source of potential energy that could be used in the concentrating process in the IM. Urea that had been concentrated by NaCl and water absorption in the cortical and OM CDs could diffuse out of the IM CDs into the interstitium. Here, it would draw water from descending thin limbs (DTLs) and CDs, thus tending to reduce the interstitial concentration of NaCl. This would mean that the urea concentration in the interstitium would be greater than the urea concentration in the ATLs and the NaCl concentration in the ATLs would be greater than the NaCl concentration in the interstitium. Thus, NaCl will tend to diffuse passively out of the ATLs and urea will tend to diffuse passively into the ATLs. If the ATLs have a sufficiently high permeability to NaCl and a sufficiently low permeability to urea, then much NaCl will diffuse out of the ATLs into the interstitium while little urea will diffuse into the ATLs. If the concentration differences for NaCl and urea can be sustained, the interstitial fluid will be concentrated while the ATL fluid is diluted. The increased interstitial osmolality will, in turn, draw water from the CDs, thereby concentrating the urine. This mechanism is only ‘passive’ with regard to NaCl diffusion out of the ATLs and urea diffusion out of the CDs because it depends critically on active transport of NaCl out of the TALs and CDs. In a previous publication (Layton et al. 2004), we suggested that a better name for proposed mechanisms of this type would be a ‘solute-separation, solute-mixing’ mechanism: ‘solute-separation’ referring to the active NaCl reabsorption without urea in the TALs in the OM and ‘solute-mixing’ referring to mixing of urea diffusing from the CDs with NaCl diffusing from the ATLs in the IM.
Regardless of what this mechanism is termed, it is critically dependent on the NaCl and urea permeabilities of the loops of Henle. Using measured urea permeabilities, renal researchers have been unable to develop mathematical models that generate a significant osmotic gradient (Sands & Layton 2007). And if markedly reduced urea permeabilities are used, they have been unable to develop models that concentrate to maximum measured urine concentrations, as long as urine flow rate is maintained at physiological levels (Sands & Layton 2007).
The failure of the original ‘passive mechanism’ to describe the IM concentrating process using known physiological data has led to the formulation of a number of other hypothetical mechanisms and associated mathematical models. These have included (i) attempts to consider the three-dimensional structure of the medulla (Wexler et al. 1991, Wang & Wexler 1996, Wang et al. 1998), which has failed to provide the hoped for physiological levels of concentration when modelled mathematically; (ii) the muscular contractions of the pelvic wall, possibly acting through hyaluronan as a transducer to transform mechanical energy into a concentrating effect (Schmidt-Nielsen 1995, Knepper et al. 2003), which has not yet been shown to be thermodynamically feasible; and (iii) the accumulation of an external osmotically active substance in the IM (Jen & Stephenson 1994, Thomas 2000, Hervy & Thomas 2003), which has yet to be tested experimentally.
Whatever the mechanism by which the urine is concentrated in the IM, we believe that it must take into account the interactions between the various tubular and vascular elements in the IM. Although a previous attempt to take into account the three-dimensional relationships among the IM structures (Wexler et al. 1991) failed to provide the hoped for results, it was based on limited knowledge of the IM structure. Therefore, in the past few years, we have undertaken studies to determine in substantial detail the three-dimensional functional architecture of all tubular and vascular structures in the IM. In this paper, we review the results of these studies and their possible implications for the renal concentrating mechanism.
Approach to three-dimensional architecture
Kriz and his colleagues provided considerable insight into the three-dimensional structure of the IM through their classic light and electron micrographs of transverse sections (e.g. Kriz 1967, Jamison & Kriz 1982). However, technical limitations prevented full visualization of the three-dimensional relationships between the tubular and vascular structures. To overcome the problems inherent in earlier approaches, we have been using a computer-assisted process to reconstruct the tubular and vascular structures in the IM of the rat kidney (Pannabecker et al. 2004, Pannabecker & Dantzler 2004, 2006, 2007; Pannabecker et al. 2008b; Pannabecker 2008, Kim & Pannabecker 2010, Yuan & Pannabecker 2010). We chose the rat kidney for our reconstructions because of the enormous amount of experimental work on renal physiology that has involved the rat kidney, including most of the studies on the concentrating mechanism. However, our preliminary data suggest that the mouse kidney is similar and the reconstructions of single mouse nephrons by Christensen and co-workers (Zhai et al. 2003, 2006), although not examining the same structural relationships in the IM, are compatible with our work.
We base our functional reconstructions on serial sections of the rat renal IM in which the tubular and vascular elements are labelled and distinguished by antibodies to segment-specific channels and transporters (Pannabecker & Dantzler 2004, 2006, Pannabecker et al. 2004). We then use semiautomatic image acquisition in combination with graphical, volumetric modelling software to compile the serial sections into three-dimensional surface and volumetric representations of the tubules and vessels (Pannabecker & Dantzler 2004, 2006, 2007, Pannabecker et al. 2004). For the studies reported here, we used antibodies (Pannabecker & Dantzler 2004, 2006, Pannabecker et al. 2004) raised against: (i) the water channel aquaporin-1 (AQP1), for DTL identification and function; (ii) ClC-K1 chloride channel, for prebend and ATL identification and function; (iii) the water channel aquaporin-2 (AQP2), for CD identification and function; (iv) the urea transporter B (UT-B), for descending vasa recta (DVR) identification and function; (v) plasmalemmal vesicle-1 (PV-1), a protein of the fenestral diaphragms, for identification of ascending vasa recta (AVR) and those terminal DVR that do not express UT-B; and (vi) the heat shock-related protein αB-crystallin, for identification of those epithelial structures that do not express the other proteins.
Initial reconstructions of thin limbs of Henle’s loops
Our initial reconstructions led to some novel findings involving the thin limbs of Henle’s loops (Pannabecker et al. 2004). These features are shown for sample loops in Figure 1. First, the DTLs of those long loops that turn back within the first millimetre of the IM do not express AQP1 (Fig. 1a). Others later showed that 90% of the DTLs of short loops in the OM of mouse, rat, and human kidneys also lack AQP1 (Zhai et al. 2007). We assume that these DTLs have little or no osmotic water permeability.
Figure 1.

Computer-assisted reconstruction of loops of Henle from rat inner medulla (IM) showing expression of aquaporin-1 (AQP1; red) and chloride channel (ClC-K1; green); grey regions (αB-crystallin) express undetectable levels of AQP1 and ClC-K1. Loops are oriented along the corticomedullary axis, with the left edge of each image nearer the base of the IM. (a) Thin limbs that have their bends within the first millimetre beyond the OM–IM boundary. Descending segments lack detectable AQP1. ClC-K1 is expressed continuously along the prebend segment and the ATL. (b) Loops that have their bends beyond the first millimetre of the IM. AQP1 is expressed along the initial 40% of each descending thin limb (DTL) and is absent from the remainder of each loop. ClC-K1 is expressed continuously along the prebend segment and the ATL. Boxed area is enlarged in c. (c) Enlargement of near-bend regions of four thin limbs from box in b. ClC-K1 expression, corresponding to DTL prebend segment, begins, on average, 165 μm before the loop bend (arrows). Scale bars: 500 μm (a and b); 100 μm (c). From Layton et al. (2004), used with permission.
Second, those long loops that have their bends below the first millimetre of the IM express detectable AQP1 only for the first 40% of their length; the remaining 60% contains no detectable AQP1 (Fig. 1b). Thus, the longer the loop, the longer are the segments with and without detectable AQP1. There is no detectable AQP1 in the final 2.0–2.5 mm of the IM. We expect that the AQP1-expressing portion of these loops has high osmotic water permeability whereas the AQP1-null portion has little or no osmotic water permeability, as now indicated by preliminary studies with isolated, perfused segments of these DTLs (Dantzler et al. 2009).
Third, expression of the chloride channel ClC-K1 begins abruptly in the AQP1-null portion of each DTL, about 150–200 μm above the hairpin bend, thereby defining a prebend region of each loop (Fig. 1a–c). In contrast to the variable lengths of the AQP1-positive and AQP1-negative segments of the DTLs, which depend on loop length, the prebend segments have a nearly uniform length (average: about 165 μm) regardless of the length of the loop (Pannabecker et al. 2004). Following the bend, ClC-K1 expression continues uniformly along each ATL, apparently reflecting the extremely high chloride permeability determined in studies with isolated, perfused ATLs (Imai & Kokko 1974). There is no colocalization of AQP1 with ClC-K1 anywhere along the length of the ATLs (Pannabecker et al. 2004), apparently reflecting the lack of osmotic water permeability in these tubule segments (Imai & Kokko 1974, Chou & Knepper 1992, Yool et al. 2002). We assume that the prebend region, which, like the ATL, expresses ClC-K1 but lacks AQP1, also has high chloride permeability and essentially no osmotic water permeability.
Although Wade et al. (2000) and Kim et al. (2002) found evidence of a UT-A-type protein co-localizing with AQP1 in DTLs in the upper IM at the OM–IM boundary in rats, we have found little or no evidence to date of specific urea transporters (UT-A1, UT-A2, or UT-A4) along either DTLs or ATLs in the IM, even in dehydrated animals. This is interesting because experiments with isolated perfused thin limbs have revealed significant urea permeabilities in some segments of thin limbs in a number of species (Imai 1977, Chou & Knepper 1993, Liu et al. 2001). However, the magnitude of urea permeability in specific segments of rat thin limbs and the possible transporters that may explain that permeability currently remain unclear.
Initial mathematical models
Using the initial findings described above, we developed mathematical models for two modes of concentrating the urine (Layton et al. 2004). We termed these the ‘pipe’ mode and the ‘solute secretion’ mode. In the pipe mode, we assumed that the AQP1-null segment of the DTL (Fig. 1) is nearly impermeable to solutes and has a moderate permeability to water. Thus, it acts as a ‘pipe’ with regard to solutes, and need not equilibrate with the surrounding interstitium. In the solute secretion mode, we assumed that both thin limbs of the loops of Henle have large urea permeabilities, in accordance with measurements in isolated thin limbs from chinchilla (Chou & Knepper 1993), but that the AQP1-null segments of the DTLs have zero osmotic water permeability.
Modelling of both modes involved a number of common characteristics (Layton et al. 2004): (i) prebend segments and ATLs highly permeable to NaCl; (ii) loops with turns distributed densely along the corticopapillary axis to approximate loops turning back at all levels of the IM; (iii) epithelial area of CDs scaled to represent CD coalescences; (iv) significant transepithelial NaCl transport from the CD lumen to the interstitium; and (v) the central core concept of Stephenson (1972), in which the interstitium and vasculature are merged into a common compartment that carries absorbed fluid back to the OM. The transport equations embodied principles of mass conservation for both solutes and water. Transmural transport processes were described by single-barrier equations that approximate double-barrier transepithelial or transendothelial transport. Transmural solute active transport was approximated by a saturable expression having the form of Michaelis–Menten kinetics and solute diffusion was characterized by solute permeabilities.
Both the pipe mode and the solute secretion mode are versions of a ‘solute-separation, solute-mixing’ passive model and concentrate principally by the vigorous reabsorption of NaCl, unaccompanied by water, from the loop bends. However, in the solute secretion mode, the loop of Henle functions as a very effective countercurrent exchanger for urea. As shown in Table 1, the results for both modes predict urine osmolalities, Na+ and urea concentrations, and flow rates in good agreement with moderately antidiuretic rats (Pennell et al. 1974). Also both modes predict osmolalities of the fluid at the bends of the longest loops that approximate those in the final urine and that are in good agreement with those measured in moderately antidiuretic rats (Pennell et al. 1974) (Table 1). However, whereas the pipe mode predicts a Na+ concentration in fluid at the bend of the loop about twice as great as the urea concentration, in good agreement with the concentration ratios observed experimentally in moderately antidiuretic rats (Pennell et al. 1974) (Table 1), the solute secretion mode predicts exactly the opposite concentration ratio (urea concentration about twice that of the Na+ concentration) (Table 1). Therefore, the pipe mode appears to give a better approximation of the working of the urine concentrating mechanism than the solute secretion mode.
Table 1.
Comparison of model mode values with measurements in the rat
| Pipe mode | SS mode | Rat | |
|---|---|---|---|
| Urine | |||
| Osmolality | 1,265 | 1,031 | 1,216 |
| Na+ concentration | 254 | 110 | 100 |
| Urea concentration | 597 | 430 | 345 |
| Flow rate | 2.96 | 3.38 | 2.27 |
| Loop bend | |||
| Osmolality | 1,073 | 1,135 | 1,264 |
| Na+ concentration | 466 | 302 | 475 |
| Urea concentration | 233 | 598 | 287 |
Osmolality is expressed in mosmol kg H2O−1; Na+ and urea are in mM; urine flow rate is in μl min−1. Model loop bend values are given for the longest loop. Rat data are mean values or estimated mean values from Pennell et al. (1974). Table is modified from Layton et al. (2004), used with permission.
However, although both modes are much more successful than previous models in predicting urine concentrations and urine flow rates seen in moderately antidiuretic rats, neither is capable of generating urine concentrations anywhere near those seen in strongly antidiuretic rats. Moreover, as shown in the following, they do not, in any way, take into account the complexity of the three-dimensional relationships among tubular and vascular structures in the IM.
Three-dimensional lateral and vertical relationships of tubules and vessels in the IM
CD clusters form the organizing motif for loops of Henle and vasa recta in the outer zone of IM
Throughout the first 3.0–3.5 mm of the IM, which we have termed the ‘outer zone’ (Fig. 2) (Pannabecker et al. 2008a), clusters of CDs form the lateral organizing motif for loops of Henle and vasa recta (Pannabecker & Dantzler 2004, 2006, Pannabecker et al. 2008b). At the base of the IM (OM–IM border), groups of approx. 6–12 neighbouring CDs form primary CD clusters (see e.g. Figs 3 and 4). The CDs in each of these clusters coalesce as they descend through the IM to form a single CD deep in the outer zone of the IM. In turn, about five to six of these terminal CDs coalesce to form a single CD in the inner zone of the IM (final 1.5–2.0 mm of the IM; Fig. 2). Thus, five to six primary CD clusters from the OM–IM border form a single larger secondary cluster. The terminal CD from each of these secondary clusters then apparently joins with the terminal CD from one other secondary cluster within the inner zone to form a smaller number of CDs (e.g. 118 CDs found to be remaining 0.5 mm above the tip of the papilla in one kidney studied) (Pannabecker & Dantzler 2007). In that same kidney, these 118 CDs combined to form a final 13 ducts of Bellini at the papilla tip (Pannabecker & Dantzler 2007). Although the numbers will vary slightly, this basic pattern appears to be the same in kidneys from other rats (Pannabecker & Dantzler 2007).
Figure 2.
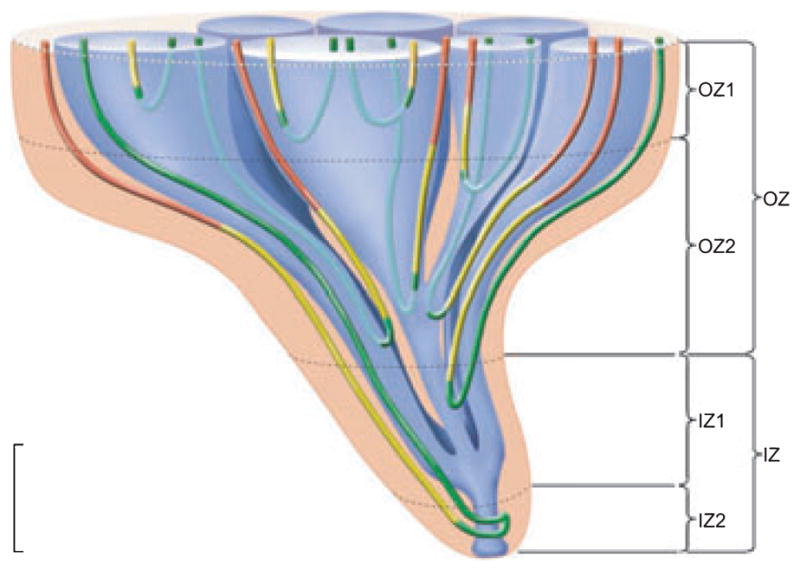
Four zones of the inner medulla (IM) are distinguishable based on data from Pannabecker, et al. (2008a). These include an outer zone (OZ) which encompasses the initial 3.0–3.5 mm below the OM/IM border and includes OZ1 and OZ2. Collecting duct (CD) clusters, which coalesce into single CDs, are shown in blue. Aquaporin-1 (AQP-1)-positive and AQP1-negative descending thin limbs (DTLs) are shown in red and yellow respectively. Prebend segments and ascending thin limbs are shown in green. In the OZ, CDs form the organizing motif around which loops of Henle and blood vessels (not shown) are arranged. OZ 1 includes those loops that express no detectable AQP1. Loops expressing AQP1 along their initial 40% are present in OZ1 and OZ2. An inner zone (IZ) encompasses the terminal 1.5–2.0 mm and includes IZ1 and IZ2. In the IZ the central organizing motif of CD clusters is diminished and no detectable AQP1 is expressed in DTLs. No detectable AQP1 or UT-B is expressed in blood vessels, and all vasa recta are fenestrated. IZ2 includes the terminal 500 μm of the papilla tip where transverse-running segments lie. See text for additional details. Scalebar, 1 mm along the axial dimension, lateral dimensions are not to scale. From Layton et al. (2009), used with permission.
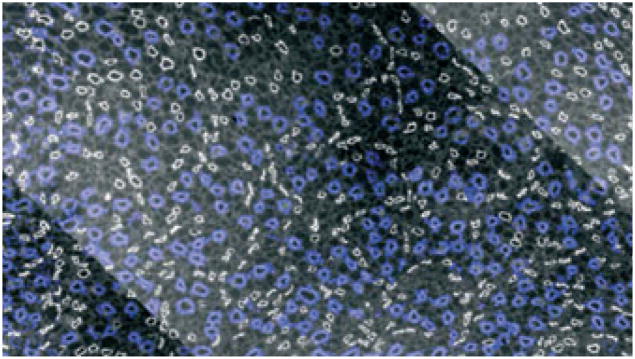
Figure 3.

Five primary clusters making up a single secondary collecting duct (CD) cluster that consists of 31 CDs (aquaporin- 2, blue) at the inner medulla (IM) base. Image taken from section at 400 μm below IM base. CD cluster boundaries (white) determined by Euclidean distance map technique. Polygons (red) delimit the intracluster interstitium for each of the five primary CD clusters. Scalebar, 100 μm. From Pannabecker et al. (2008b), used with permission.
Figure 4.
Transverse section of inner medulla (IM) taken approx. 40 μm below the OM–IM border (IM base) showing collecting duct (CD) clusters in blue surrounded by descending thin limbs in white. Scale bar: 100 μm. From Pannabecker and Dantzler (2004), used with permission.
To define more precisely the relationship of loops of Henle and vasa recta to each of the primary CD clusters, we established lateral boundaries for each primary CD cluster using the Euclidean distance map (EDM) technique (Russ 1999; Pannabecker et al. 2008b). This process, which involves assigning luminosity values to each pixel in the background equal to its distance from the nearest edge of any CD, can be used to generate a lateral boundary around each primary cluster, which corresponds to the linear array of points that are most distant from any CD in this or any neighbouring cluster (Pannabecker et al. 2008b). Such boundaries are illustrated for five primary CD clusters that make up a single secondary CD cluster by the white lines in Figure 3. To delimit the interstitium within each primary CD cluster, we connected the borders of the CDs to form an irregular polygon within the outer boundaries derived by the EDM technique. This border for each primary CD cluster is shown in Figure 3 by the red line. We term the area within the red border the ‘intracluster’ region and the area between that border and the cluster boundary set by the EDM technique the ‘intercluster’ region.
Distribution of DTLs and DVR with regard to the CD clusters in the outer zone of the IM
Throughout the outer zone of the IM, the DTLs and DVR are located laterally outside the CD clusters, as shown in transverse sections (Figs 4 and 5a) (Pannabecker & Dantzler 2004, 2006). This relationship continues in the corticopapillary direction as shown in a three-dimensional reconstruction in Figure 6. When the lateral relationship of the DTLs and DVR to the CD clusters is examined more precisely, most of the DTLs and DVR are found to lie along the boundaries of the primary CD clusters determined beforehand with the EDM technique (Figs 7 and 8) (Pannabecker et al. 2008b). DVR tend to be arranged in their own small clusters, the members of which are distributed nearly equally on either side of these predetermined CD cluster boundaries (Fig. 8). This pattern of DTL and DVR distribution along the cluster boundaries occurs transversely across the entire IM (Pannabecker et al. 2008b). The arrangement of DTLs and DVR on the predetermined boundaries of the primary CD clusters indicates that they are positioned at the maximum distance from any CD in this or any neighbouring cluster in the outer zone of the IM. The pattern of DTLs distant from CDs, although not defined in detail, appears to be similar in the IM of the mouse kidney (T. L. Pannabecker, personal observations; Zhai et al. 2006).
Figure 5.
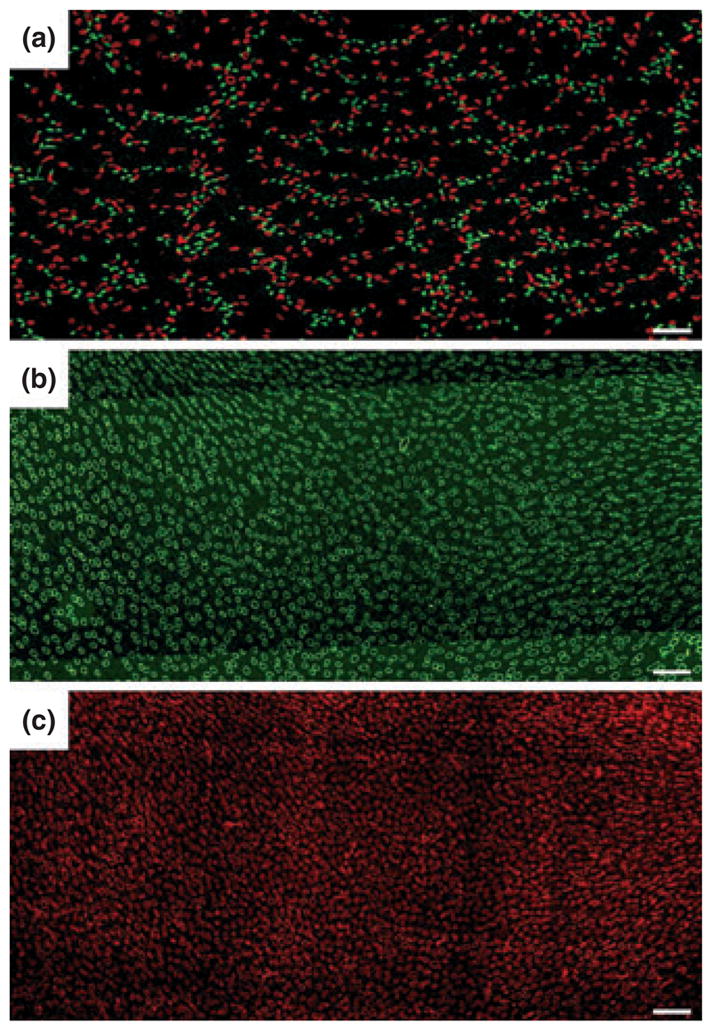
(a) Transverse section showing reticulated pattern formed by distribution of descending thin limbs (DTLs) [aquaporin-1 (AQP1); red] and descending vasa recta (DVR) (urea transporter B; green) across a single plane of the inner medulla (IM). Each void, or black space encompassed by DTLs and DVR, is filled by a single cluster of collecting ducts (CDs) that coalesce as a unit as the segments descend from the IM base toward the papilla. Section (a) is from approx. 900 μm below IM base. (b) and (c) show nearly uniform distribution of ascending thin limbs (ATLs) (chloride channel ClC-K1; green) and ascending vasa recta (PV-1; red) in adjacent transverse sections from the renal IM. Sections (b) and (c) are from approx. 1300 μm below the IM base. Unequal numbers of DTLs and ATLs reflect the prebend regions and AQP1-null DTLs. Scale bars: 100 μm. From Pannabecker and Dantzler (2006), used with permission.
Figure 6.

Three-dimensional reconstruction showing spatial relationships of descending vasa recta (DVR; green tubules) and descending thin limbs (DTLs; red tubules) to collecting ducts (CDs; blue tubules) for a single CD cluster. DTL segments that do not express aquaporin-1 were identified by their expression of αB-crystallin and are shown in grey. DVR and DTLs are spatially separate from the CDs and panels (a)–(d) show that this relationship continues along the entire axial length of the CD cluster. Tubules in panels (a)–(d) have been rotated forwards approx. 2°. Axial positions of panels (a)–(d) are shown in panel (e) with lower case letters. Tubules are oriented in a corticopapillary direction, with the upper edge of the image near the base of the IM. Scale bar, 500 μm. From Pannabecker and Dantzler (2006), used with permission.
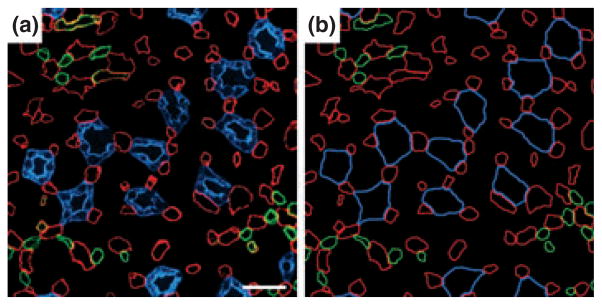
Figure 7.

Five primary clusters making up a single secondary collecting duct (CD) cluster that consists of 31 CDs at the inner medulla (IM) base. Image taken from section at 400 μm below IM base. CD cluster boundaries (white) determined by Euclidean distance map technique. Descending thin limb/aquaporin-1 (magenta), CD/aquaporin-2 (blue), ascending thin limb/chloride channel ClC-K1 (green). Scalebar, 100 μm. From Pannabecker et al. (2008b), used with permission.
Figure 8.

Five primary clusters making up a single secondary collecting duct (CD) cluster that consists of 31 CDs at the inner medulla (IM) base. Image taken from section at 400 μm below IM base. CD cluster boundaries (white) determined by Euclidean distance map technique. Descending vasa recta/urea transporter B (yellow), CD/aquaporin-2 (blue), ascending thin limb/chloride channel ClC-K1 (green). Scalebar, 100 μm. From Pannabecker et al. (2008b), used with permission.
Distribution of ATLs and AVR with regard to the CD clusters in the outer zone of the IM
In contrast to the arrangement of DTLs and DVR outside primary CD clusters, the ATLs and AVR are distributed transversely across the outer zone of the IM in a nearly uniform pattern (Fig. 5b,c), both inside and outside the CD clusters (Pannabecker & Dantzler 2004, 2006). This pattern continues in the corticopapillary direction as shown in a three-dimensional reconstruction in Fig. 9. In the IM of the mouse kidney, ATLs also appear to be closer than DTLs to CDs (T. L. Pannabecker, personal observations; Zhai et al. 2006).
Figure 9.

Three-dimensional reconstruction showing spatial relationships of ascending vasa recta (AVR; red tubules) and ascending thin limbs (ATLs; green tubules) to collecting ducts (CDs; blue tubules) for the same CD cluster shown in Fig. 6. AVR and ATLs are distributed relatively uniformly outside of and within the CD cluster and panels (a)–(d) show that this relationship continues along the entire axial length of the CD cluster. Tubules in panels (a)–(d) have been rotated forwards approx. 20°. Axial positions of panels (a)–(d) are shown in panel (e) with lower case letters. Tubules are oriented in a corticopapillary direction, with the upper edge of the image near the base of the inner medulla. Scale bar, 500 μm. From Pannabecker and Dantzler (2006), used with permission.
About 50% of the AVR, which we term ‘AVR1’ (Yuan & Pannabecker 2010), lie in the intracluster region in the outer zone of the IM, and these AVR1 are arranged in such a manner as to suggest that they have a function quite different from those AVR located in the intercluster region. Nearly all of these intracluster AVR1 closely abut a CD and lie parallel to it for some distance on the corticopapillary axis (Figs 10 and 11) (Pannabecker & Dantzler 2006). Throughout the outer zone of the IM, about four AVR1, on average, are arranged nearly symmetrically around each CD (Figs 10 and 11) so that about 55% of the surface area of the CD is closely apposed to the surface of AVR1 (Pannabecker & Dantzler 2006). However, as shown in the electron micrograph in Fig. 12 (Pannabecker & Dantzler 2006), the AVR1 are not fused to the surface of the CDs. Instead, the basal plasma membrane of each ascending vas rectum is positioned approx. 0.5–1.0 μm from the plasma membrane of the CD that it abuts. AVR1, although not fused to the CDs that they abut, are attached to them by small processes arising from vascular endothelial cells (Fig. 12c,d), which have been described previously and termed ‘microvilli’ (Bulger & Trump 1966, Takahashi-Iwanaga 1991). These intracluster AVR1 are highly branched as shown in the reconstructions in Figure 11 and indicated in the diagram in Figure 13. In general, these branches interconnect with other AVR1 abutting CDs, although a few branches, especially from the peripheral AVR1, form a sparse network connecting to the 50% of the AVR in the intercluster region, which we term ‘AVR2’ (Yuan & Pannabecker 2010), and to the DVR, which are only in the intercluster region (Fig. 13). AVR1 seem well suited to move absorbate from the CDs in a papillary-cortical direction.
Figure 10.
Transverse section from near the base of the inner medulla (IM). (a) Inner medullary ascending vasa recta and capillaries (red) are symmetrically positioned around collecting ducts (CDs; blue) and make intimate contact with adjacent CDs. This relationship extends from the base of the IM to the tip of the papilla for most collecting ducts. Inner medullary urea transporter B-expressing descending vasa recta (green) tend to be distant from collecting ducts. (b) Diagrammatic representation of tubules and vessels to facilitate pattern analysis. Scalebar, 30 μm. From Pannabecker and Dantzler (2006), used with permission.
Figure 11.

Three-dimensional reconstruction of single collecting duct segment (blue) with multiple ascending vasa recta (red) abutting it. Upper panel illustrates 90° axial rotation of segments shown in adjacent panels. Scalebar, 100 μm. From Pannabecker and Dantzler (2006), used with permission.
Figure 12.
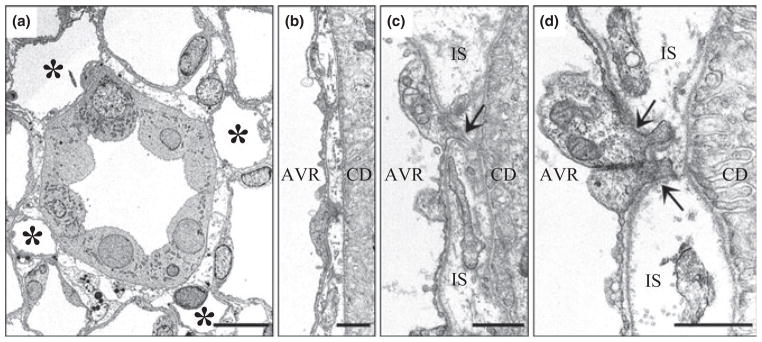
Electron micrographs showing transverse sections of collecting duct (CDs) and ascending vasa recta (AVR) from approx. 1.5 mm (panels a, b, d) and 4 mm (panel c) below the base of the inner medulla. (a) CD surrounded by four AVR (asterisks). Other tubular structures surrounding the CD are ascending thin limbs (ATLs). Interstitial nodal spaces are formed between CD, AVR and ATLs (marked with X). Scalebar, 10 μm. (b) AVR abuts CD with minimal direct contact. Scalebar, 1 μm. (c) AVR abuts CD with microvillus (arrow). IS, interstitium. Scalebar, 1 μm. (d) AVR abuts CD with microvilli (arrows). Scalebar, 1 μm. From Pannabecker and Dantzler (2006), used with permission.
Figure 13.

Diagram of vasa recta architecture in the outer zone of the inner medulla (IM). The urea transporter B (UT-B)- positive descending vas rectum (green) descends along the corticopapillary axis. The UT-B-positive segment overlaps with PV-1 (red and green, small bracket) and is continuous with a descending PV-1-positive (fenestrated) extension (red, large bracket). The PV-1 extension is continuous with AVR1, which lie within the collecting duct (CD) cluster (intracluster region). AVR1 then connect to AVR1 in vascular bundles of the intercluster region. A number of AVR1 ascend directly from the outermost IM into the innermost inner stripe. Arrows denote blood flow direction. AVR1, intracluster AVR and interconnecting capillaries that do abut CDs; AVR2, intercluster fenestrated vessels that do not abut CDs, and do or do not abut descending vasa recta (DVR). AVR2a are a subset of AVR2 that do abut DVR (Yuan & Pannabecker 2010). From Kim and Pannabecker (2010), used with permission.
AVR2, located in the intercluster region of the outer zone of the IM, are quite different from AVR1, located in the intracluster region. AVR2 tend to be unbranched for most of their length throughout the outer zone of the IM (Yuan & Pannabecker 2010). They do not abut CDs and run parallel to DVR in loosely organized vascular bundles within the intercluster region (Yuan & Pannabecker 2010). About one-half of AVR2 actually abut DVR and we term these ‘AVR2a’ (Yuan & Pannabecker 2010). They appear particularly well suited for countercurrent exchange. Indeed, the AVR2a/DVR ratio is about 1 : 1, whereas the ratio of all AVR2 to DVR is about 2 : 1 and the ratio of all AVR (both AVR1 and AVR2) to DVR is about 4 : 1 (Yuan & Pannabecker 2010). Thus, AVR2 appear capable of being involved with DVR in countercurrent exchange and the recycling of solutes and also of moving fluid, including that contributed to them by AVR1, to the OM. It is interesting that the AVR2 to DVR ratio of about 2 : 1 is essentially the AVR/DVR ratio found to be necessary to move excess fluid from the IM to the OM in the study of Zimmerhackl et al. (1985).
Interstitial nodal spaces and possible function as solute mixing chambers
Within the CD clusters in the outer zone of the IM, the arrangement of AVR1, ATLs, and CDs form interstitial compartments, which we have termed ‘interstitial nodal spaces’, when viewed in transverse sections (Figs 12 and 14) (Pannabecker & Dantzler 2006). As shown in these figures, the spaces are bounded on one side by a CD (in which axial flow is toward the tip of the papilla), on the opposite side by one or more ATLs (in which axial flow is toward the IM base) or prebend segments (in which axial flow is toward the loop bend), and on the other two sides by AVR1 (in which axial flow is also toward the IM base). Studies showing a ladder-like arrangement of interstitial cells along the corticopapillary axis (Lemley & Kriz 1991, Takahashi-Iwanaga 1991, Kneen et al. 1999) suggest that these spaces are discrete units approx. 1 μm thick in the corticopapillary direction, bordered above and below by transverse interstitial cells or their processes. Therefore, these interstitial nodal spaces, or microdomains, are probably arranged in stacks, not columns along the corticopapillary axis (Pannabecker & Dantzler 2006).
Figure 14.

One single collecting duct (CD) in transverse section showing interstitial nodal spaces (marked with X) between CD, ascending vasa recta (AVR) and ascending thin limbs (ATLs) in a composite image of two sections 3 μm apart, from near the inner medullary base. CD (blue), AVR (red), ATL (green). Open space in wall of central CD is the location of an intercalated cell, which does not label for aquaporin-2. Scalebar, 10 μm. From Pannabecker and Dantzler (2006), used with permission.
These interstitial nodal spaces appear well suited to facilitate mixing of solute (NaCl) from the ATLs or prebend segments with solute (primarily urea) and fluid from the CDs within a confined space (Pannabecker et al. 2008a). Moreover, the AVR1 bordering these spaces appear equally well suited to pick up and move the mixed absorbate in these spaces to higher levels, either within the CD cluster or, especially for AVR1 near the periphery of the cluster, towards the AVR2 in the intercluster region (Kim & Pannabecker 2010).
Organization of the inner zone of the IM
The organization of vessels and tubules changes substantially in the final 1.5–2.0 mm of the IM. We have thus termed this region the ‘inner zone’ (Fig. 2) (Pannabecker et al. 2008b). We have further subdivided the inner zone into ‘inner zone 1’, which encompasses the first 1.0–1.5 mm of the inner zone and ‘inner zone 2’, which encompasses the final 0.5 mm (Fig. 2) (Pannabecker et al. 2008b).
In inner zone 1, the organization determined by the CD clusters steadily diminishes as the remaining CDs continue to coalesce. Interstitial nodal spaces are still present, but they decrease steadily in number and increase in size as loops turn back (Pannabecker & Dantzler 2007). Almost all blood vessels are fenestrated and, except for those tightly abutting CDs, which can be clearly identified anatomically as AVR, ascending vessels cannot be discriminated from descending vessels without measurements of the direction of flow (Pannabecker & Dantzler 2007). There is no clear pattern of AVR and DVR arranged for countercurrent exchange. As CDs coalesce and increase in size, the number of AVR abutting them increases so that about 55% of the surface area of each CD is still closely apposed to AVR (Pannabecker & Dantzler 2007).
In inner zone 2, CD clusters can no longer be distinguished and the few remaining large CDs dominate the region as they coalesce to form the final ducts of Bellini (Fig. 15) (Pannabecker & Dantzler 2007). All blood vessels are fenestrated and primarily form a capillary network in which the direction of flow cannot be determined on anatomical grounds. Of particular significance in this region is the arrangement of the bends of the loops of Henle. Most of the bends of the loops of Henle along the corticopapillary axis in the IM resemble U-shaped hairpins, and about half of the bends of the remaining loops in inner zone 2 are also of this type (Fig. 15) (Pannabecker & Dantzler 2007). However, the other half of the loops in inner zone 2 have wide bends with 5- to 10-fold greater transverse length than the usual bends. These wide-bend loops exhibit boot-shaped bends that extend transversely, perpendicular to the corticopapillary axis, and that wrap very closely around the large CDs just before they merge with the papillary surface to form the ducts of Bellini (Fig. 15) (Pannabecker & Dantzler 2007). If NaCl efflux from thin limbs of Henle’s loops occurs primarily for a short distance around the loop bends (prebend and comparable distance on the ATL), then the presence of these wide bends suggests that significant efflux of NaCl may occur over a very small axial distance near the papilla tip. An earlier mathematical model had indicated that such delivery of NaCl at a single point would be most effective in producing highly concentrated urine (Layton & Davies 1993). To learn more about the possible significance of these wide-bend loops for this type of NaCl delivery, we determined their effect on the axial distribution of the loop surface area (Pannabecker et al. 2008b). We found that, compared to what would be the case in the absence of wide-bend loops, the presence of wide-bend loops leads to a striking increase in this apparently critical surface area relative to CD surface area over only approx. 50 μm of axial distance (from approx. 75 μm above the papilla tip to approx. 25 μm above the papilla tip) (Fig. 16) (Pannabecker et al. 2008b). These determinations suggest that the wide-bend architecture may play a significant role in the development of the high osmolality at the tip of the papilla (see below).
Figure 15.
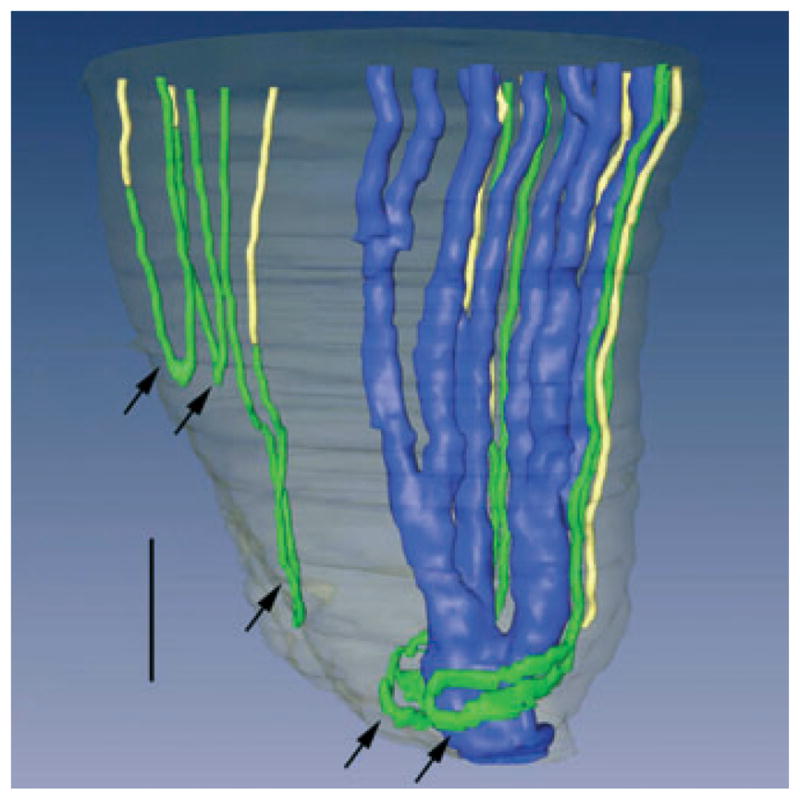
Three-dimensional reconstruction of several papillary collecting ducts (CDs) (aquaporin-2; blue), ascending thin limbs (ATLs) (chloride channel ClC K-1; green), and aquaporin- 1 (AQP1)-null descending thin limbs DTLs (αB-crystallin, yellow). Papillary surface epithelium is shown in grey. Tight narrow bends of loops of Henle (3 upper arrows) and wide transverse bends of loops of Henle (2 lower arrows) are shown. Wide transverse bends of two loops reaching to near the tip of the papilla almost completely encompass a final CD segment (blue) prior to its merging with the papillary wall (surface epithelium; translucent grey) to form a duct of Bellini. Relative diameters of loops and CDs in this image nearly approximate true dimensions. Scalebar, 200 μm. From Pannabecker and Dantzler (2007), used with permission.
Figure 16.

Cumulative loop of Henle bend surface area-to-collecting duct (CD) surface area ratio for all loops (including for each loop the area from the start of the prebend to an equal axial distance on the ascending thin limb). Ratios were determined at 5 μm intervals throughout the final 500 μm of the inner medulla (inner zone 2). This was first done for all native loops (wide-bend plus narrow-bend; open squares). Wide-bend loops were then converted into equivalent narrow-bend loops as described in Pannabecker et al. (2008b), and their three-dimensional surface area was determined. The cumulative loop surface area-to-CD surface area ratio was then computed for all converted wide-bend loops plus all native narrow-bend loops (solid triangles). From Pannabecker et al. (2008b), used with permission.
Summary of loop of Henle populations in relation to axial zones of IM
Based on our three-dimensional reconstructions of the IM loops of Henle discussed above, we have divided the total long loop population into three subpopulations (Pannabecker et al. 2008b) that are related to the axial zones of the IM. Subpopulation 1 encompasses those long loops that have their bends within the first approx. 1 mm of the IM. Based on the distribution of these loops, we term this first approx. 1.0 mm of the IM outer zone ‘outer zone 1’ (Fig. 2). These loops, which make up about 40% of the loops that enter the IM, lack any detectable AQP1 in their DTLs. We assume that these DTLs have little or no osmotic water permeability. Subpopulation 2 encompasses those long loops that have their bends more than 1 mm and less than 3.0–3.5 mm below the OM–IM border, an axial portion of the outer zone that we term ‘outer zone 2’ (Fig. 2). DTLs of these loops have detectable AQP1 for the first 40% of their length and lack any detectable AQP1 for the remaining 60%. Preliminary data indicate that the AQP1-positive portion has high osmotic water permeability, whereas the AQP1-negative portion has essentially no osmotic water permeability (Dantzler et al. 2009). Subpopulation 3 encompasses those long loops that have their bends in the last 1.5–2.0 mm of the IM (inner zone). Like DTLs of loops in Subpopulation 2, DTLs of loops in Subpopulation 3 express detectable AQP1 only in the first 40% of their length. Indeed, there appears to be no detectable AQP1 in the final 2.0–2.5 mm of the IM. The DTLs of these loops also appear to have high osmotic water permeability in the AQP1- positive portion and no osmotic water permeability in the AQP1-negative portion (Dantzler et al. 2009). Subpopulation 3 can be further subdivided into subpopulations 3a and 3b. The loops in subpopulation 3a end in any region of the inner zone (inner zone 1 or 2) and have standard hairpin bends, whereas the loops in subpopulation 3b terminate only in the final 0.5 mm of the papilla (inner zone 2) and have wide transverse bends (Figs 2 and 15).
Possible relation of three-dimensional structure to the concentrating process
Relation of concentrating process to lateral regions and axial zones
We believe that any process for concentrating the urine in the IM must take into account both the lateral regions and the axial zones defined in our three-dimensional functional reconstructions discussed above. Indeed, these regions and zones appear to define potential processes in the concentrating mechanism. Drawing upon these reconstructions, we have suggested that three countercurrent systems, two in the outer zone and one in the inner zone, may be involved in the urine concentrating mechanism in the IM (Pannabecker et al. 2008). The two countercurrent systems in the outer zone are specific for the lateral regions. One is located in the intracluster region and one, in the intercluster region.
Intracluster countercurrent system
The countercurrent system within the CD clusters functions much like the classical models, including the passive model, to raise the osmolality of the interstitium within the cluster, thereby promoting withdrawal of water from the CDs and increasing their osmolality. It involves the targeted delivery of NaCl absorbed from the prebend and equivalent postbend regions of loops of Henle to the intracluster region and confining it there with urea, NaCl, and water absorbed from CDs. The interstitial nodal spaces, or microdomains, described above (Figs 12 and 14) appear to be well suited to function as confining regions for the mixing of the NaCl from the loops and the urea from the CDs. These spaces thus provide isolated sites of high osmolality that promote withdrawal of water from CDs.
The AVR1 bordering two sides of these interstitial nodal spaces provide low resistance pathways to absorb the somewhat concentrated solutes and water in the spaces. The AVR1 then move this absorbate to higher levels within the cluster or, in the case of AVR1 bordering interstitial nodal spaces near the periphery of the cluster, to AVR2 in the intercluster region (Kim & Pannabecker 2010). Moving concentrated absorbate to higher levels within the CD cluster where the local absorbate is less concentrated can enhance the concentrating process in at least three ways. First, the more concentrated solutes can diffuse into the less concentrated interstitial nodal spaces. Second, the more concentrated solution in the AVR1 can withdraw water from less concentrated solution in these nodal spaces. Both of these processes would enhance the local concentrating effect. Third, diffusion of urea from AVR1 into interstitial nodal spaces at higher levels would tend to limit loss of urea from CDs at those levels, allowing them to carry more urea to lower levels. In summary, the structural arrangement which permits AVR1 to move concentrated fluid from interstitial nodal spaces at lower levels to less concentrated interstitial nodal spaces at higher levels tends to optimize the concentrating process.
The countercurrent system within the CD clusters consists of descending axial flows in the CDs and ascending axial flows in the AVR1. The DTLs tend to enter the CD clusters close to the beginning of the prebends and the prebend and equivalent postbend segments of the loops of Henle generally border interstitial nodal spaces for their entire length (Pannabecker 2008). However, this amounts to only about 200 μm. The additional length of each ATL above the portion equivalent to the prebend length that continues to border interstitial nodal spaces varies with the length of the loop (Pannabecker 2008). The shorter the loop, the greater is the proportion of its ATL that borders interstitial nodal spaces (Pannabecker 2008). But that also means that the absolute length of each ATL that borders interstitial nodal spaces before moving outside the cluster will be greater for the longer loops. These longer lengths would tend to be dissipative for the concentrating mechanism because equilibration of NaCl and urea concentrations between loop fluid and surrounding interstitium would be expected to occur in ATLs either below or just a short distance above the prebend-equivalent length.
For the 40% of the IM loops (subpopulation 1) that turn back within the first 1 mm below the OM–IM border (outer zone 1), essentially all of the ATL length above the prebend-equivalent length borders interstitial nodal spaces. However, this distance is short and need not be dissipative for the concentrating mechanism. Indeed, these loops would tend to enhance the concentrating process. Because so much of the length of these loops consists of highly NaCl-permeable prebend regions and ATLs and because they are likely to encounter relatively high concentrations of urea in the surrounding interstitium, both from the CDs (which even in this region have a permeability to urea of approx. 3 × 10⁻⁵ cm s−1) and AVR laden with urea from deeper in the IM, they would lose large amounts of NaCl by passive efflux. Therefore, if the ATLs of these loops (subpopulation 1) do not gain significant amounts of other solutes, such as urea, by passive influx, they would likely carry fluid significantly hypoosmotic to that in the corresponding DTLs back to the OM.
Intercluster countercurrent system
The second countercurrent system that we envision in the outer zone of the IM (Pannabecker et al. 2008) involves the vessels and tubule segments in the intercluster region. In this region, fluid in the DTLs and DVR flows toward the papillary tip and fluid in those ATLs and AVR (AVR2 and AVR2a) located in this region flows toward the OM. The ATLs in this region belong to loops in subpopulations 2, 3a, and 3b, whereas the DTLs belong to all loop populations. The portion of each ATL from loops in subpopulation 2 that lies in the intercluster region increases with the length of the loop (Pannabecker 2008). However, essentially all of each ATL from loops of subpopulations 3a and 3b, those that have their bends in the inner zone, lies in the intercluster region while it is in the outer zone (Fig. 2). We suggest that the principal role of the intercluster countercurrent system may be to remove water from the water-permeable portion of the DTLs (the AQP1-positive upper 40%). This would increase the NaCl concentration within the DTLs before they enter the CD clusters and begin to border the interstitial nodal spaces). The efflux of NaCl and urea from the intercluster ATLs as they move upward through areas of decreasing solute concentration and the upward flow of blood that is relatively concentrated both would tend to promote withdrawal of fluid from the water-permeable portion of the DTLs. AVR would then tend to move the absorbate from the ATLs into the OM. However, the latter role would be more important for AVR2 than for AVR2a because AVR2a would be significantly involved in countercurrent exchange with DVR, a process that reduces the rate at which solute is removed from the IM.
Two other points about the intercluster region in the concentrating process need to be noted. First, the lateral separation of the portions of the loops of Henle in the intercluster region from those in the intracluster region (particularly from those portions toward the centre of the CD clusters) may serve to shield the intercluster portions from the higher urea concentrations inside the CD clusters, thereby promoting efflux of NaCl and urea from the intercluster portions of the ATLs into the intercluster interstitium. Second, the absorption of NaCl and urea from ATLs in the intercluster region may ensure that the fluid that they carry to the OM has sufficiently low osmolality that it does not impair the overall concentrating function of the IM by unnecessary osmotic dissipation.
Inner zone countercurrent system
The third concentrating system that we envision lies in the inner zone (terminal 1.5–2.0 mm) of the IM where CD clusters are disappearing and clear lateral intracluster and intercluster regions can no longer be distinguished; all blood vessels are fenestrated, most are arranged in a capillary net work, and descending vessels cannot be readily distinguished from ascending vessels; DTLs are intermingled among all other tubules and vessels; and half the loops in the last 0.5 mm (inner zone 2) (Figs 2 and 15) have broad lateral bends. Along with its changes in three-dimensional architecture, the inner zone is the region of the IM where the highest osmolality and the steepest axial gradients and highest concentrations of NaCl and urea are found (Hai & Thomas 1969, Koepsell et al. 1974).
We envisage this region of the IM as being the focus of the two countercurrent processes (described above) taking place in the outer zone of the IM (Pannabecker et al. 2008). Because these two processes determine the solute concentrations and flow rates of the fluids in all vessels and tubules entering the inner zone, they must be a major factor in enabling the concentrating process in this region. First, the blood in the DVR entering this region will have an osmolality about equal to the maximum level attained in the interstitium of the outer zone. Second, the DTLs of loops entering the inner zone will have remained outside the CD clusters in the outer zone and will have had their NaCl concentration increased by the intercluster process described above. Also, our preliminary studies indicate that the DTLs reaching the inner zone are essentially impermeable to water (Dantzler et al. 2009). Third, fluid in the CDs entering the inner zone will not only be concentrated but will have its urea concentration enhanced relative to NaCl, thus favouring urea diffusion into the inner zone. Moreover, the CDs have their highest permeability to urea in the presence of vasopressin in the inner zone (Sands et al. 1987, Kato et al. 1998). Together, these observations suggest that the DTLs and CDs in the inner zone are well suited to deliver large amounts of NaCl and urea, respectively, for a solute mixing mechanism in this region. In this regard, the inner zone has nodal spaces that could act as mixing chambers for NaCl and urea, although as described above these spaces are larger and less regular than those in the intracluster region of the outer zone. Although most loops of Henle in the inner zone, like those in the outer zone, have narrow hairpin bends with NaCl-permeable prebend and corresponding postbend regions well suited for targeted delivery of NaCl to this region, the 50% of the loops in the last 0.5 mm of the papilla (inner zone 2) that have broad lateral bends tending to wrap around CDs appear to be uniquely suited for delivering NaCl to the interstitium over a very short axial distance (about 50 μm) at the very tip of the papilla (Pannabecker et al. 2008b). Mathematical models indicate that such localized delivery will optimize the concentrating process (Layton & Davies 1993, Layton et al. 2004, Marcano et al. 2006) and this loop configuration may play a significant role in achieving a peak osmolality at the tip of the papilla.
Mathematical model involving three-dimensional architecture
To better understand the functional implications of the three-dimensional lateral and axial architecture (described above) for the urine concentrating mechanism in the IM, we developed a new region-based mathematical model of that process (Layton et al. 2010). The region-based formulation was similar to that used in a previous model of the OM (Layton & Layton 2003, 2005). In the new model, the organization established by the CD clusters in the outer zone of the IM is represented by two concentric regions: an inner region (R1), representing the intracluster region, and an outer region (R2), representing the intercluster region (Fig. 17). This regional organization disappears in the inner zone of the IM (Deep IM in Fig. 17). Like our previous model (discussed above) (Layton et al. 2004), this model represents loops of Henle that turn at all levels and a composite CD, but, in addition, it represents a composite DVR and two composite AVR (AVR1 and AVR2) (Fig. 17). The model positions of these structures at each IM level are shown in Figure 17. The model also represents interstitial cells, interstitial spaces, and merged capillaries by the space in each concentric region that is not occupied by tubules or vasa recta (Fig. 17). We assume that at each medullary level each concentric region is a well-mixed compartment with which the tubules and vessels interact. To represent the break-up of DVR into capillaries, the model directs a fraction of the DVR flow at each medullary level, computed from the population distribution of the DVR at that level, into the interstitium. To represent the effect of the broad lateral loop bends in the inner zone of the IM on the concentrating process, the model increases the radii of both the DTL and ATL of each of these loops near the loop bend.
Figure 17.
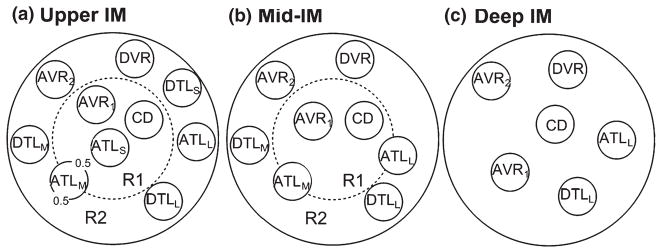
Schematic diagram of a cross section through the upper inner medulla (IM) (outer zone 1; a), mid-IM (outer zone 2; b) and deep IM (inner zone; c) showing concentric regions and relative positions of tubules and vessels. Decimal numbers in (a) indicate relative interaction weightings with regions. R1 represents intracluster region; R2 represents intercluster region. DTLS and ATLS are descending and ascending thin limbs of long loop of Henle that turns within the first 1.0 mm (outer zone 1) of the IM; DTLM and ATLM are descending and ascending thin limbs of long loop of Henle that turns within the mid-IM (outer zone 2); DTLL and ATLL are descending and ascending thin limbs of long loop of Henle that reaches into the deep IM (inner zone). CD, collecting duct; DVR, descending vas rectum; AVR1, ascending vas rectum within intracluster region; AVR2, ascending vas rectum within intercluster region. From Layton et al. (2010), used with permission.
As noted above, in the earlier ‘two modes’ model of the concentrating mechanism (Layton et al. 2004), the pipe mode provided results in better agreement with experimental data than the solute secretion mode provided. Therefore, we used only the transepithelial transport parameters compatible with the pipe mode for the base-case values in this new region-based model.
Like the previous pipe-mode model, this model is a version of a ‘solute-separation, solute-mixing’ model, which concentrates by vigorous absorption of NaCl, without water, around the bend of each loop (at least prebend portion of DTL and equivalent portion of ATL). As discussed above, we hypothesize that the mixing of NaCl from the loops and urea from the CDs occurs within the interstitial nodal spaces as part of the intracluster concentrating mechanism. The base-case predictions of this new model tend to support this suggestion as well as the ‘solute-separation, solute-mixing’ concept. They indicate that, in the upper portion (outer zone) of the IM, the intracluster region has a markedly higher osmolality and higher urea concentration and somewhat higher NaCl concentration than the intercluster region. These findings are consistent with a concentrating mechanism that depends on the mixing of NaCl from the loops and urea from the CDs and suggest that this mixing is confined primarily to the intracluster region, possibly to the interstitial nodal spaces.
With the base-case values, the new model predicts a somewhat more concentrated urine (approx. 1500 mosmol kg H2O−1) than the urine (approx. 1300 mosmol kg H2O−1) in the earlier pipe-mode model (Layton et al. 2004) with a similar urine flow rate and urea and NaCl concentrations. Therefore, like the earlier model, the predictions are compatible with the urine concentrating effect seen in a moderately antidiuretic rat. However, also like the earlier model, this model is incapable of producing the highly concentrated urine found under many circumstances in rats. This new model does not conform to expectations in other ways. The osmolality of the loop fluid at the tip of the bend (approx. 900 mosmol kg H2O−1) is far below that in the urine or surrounding interstitium and, therefore, does not agree with either experimental data (Pennell et al. 1974) or the previous pipe-mode model (Layton et al. 2004). Moreover, when representation of the broad lateral bends found in the inner zone of the IM is eliminated, there is only a modest decrease in urine osmolality. Even more disturbing is the prediction that when the regions are merged into a single region (by increasing the solute permeabilities of the region boundary), the urine concentrating ability is increased by 9%. This appears to cast doubt on the importance of regionalization for the urine concentrating mechanism. However, it must be noted that this new model, although vastly more complex and probably more realistic than many previous models, still gives only a very crude representation of the three-dimensional lateral and vertical relationships among tubules, vessels, and interstitium in the IM described above. A model that more accurately reflects these relationships and the microenvironments created by them may be necessary to determine whether a ‘solute-separation, solute-mixing’ process really can produce the experimentally observed flow rates and solute concentrations in the tubules and final urine. Finally, if future measurements of urea permeabilities in defined segments of the loops in the IM reveal values more compatible with a solute secretion mode, then these must be taken into consideration in any future model.
Conclusion
Recent studies have redefined the architecture of the renal IM, revealing complex lateral and axial relationships among tubules, vessels, and interstitium and eliminating the concept of the IM as single well-mixed compartment. These relationships produce microenvironments and suggest interactions of transport processes within them. It appears highly likely that these three-dimensional structural and functional relationships are critically involved in the urine concentrating mechanism in the IM, a mechanism that has defied explanation for over half a century. Recent mathematical models have utilized some of these new findings in attempts to explain this urine concentrating process. Although these models have been substantially more successful than previous ones in generating concentrated urine, they have still failed to produce results that are compatible with all experimental findings. It appears that a true solution to the enigma of the urine concentrating process in the IM will require even more detail on functional and structural relationships as well as models that reflect more accurately these relationships.
Acknowledgments
The work of the authors reviewed in this manuscript was supported by US National Institutes of Health Grants DK-16294 (to W. H. Dantzler) and DK-42091 (to H. E. Layton); ES-06694 (for the Southwest Environmental Health Sciences Center at the University of Arizona); and by US National Science Foundation Grant DMS-0701412 (to A. T. Layton).
Footnotes
Conflicts of interest
None.
References
- Atherton JC, Green R, Thomas S. Influence of lysine-vasopressin in dosage on the time course of changes in renal tissue and urinary composition in the conscious rat. Am J Physiol. 1971;213:291–309. doi: 10.1113/jphysiol.1971.sp009383. [DOI] [PMC free article] [PubMed] [Google Scholar]
- Beck F, Dorge A, Rick R, Thurau K. Osmoregulation of renal papillary cells. Pflugers Arch. 1985;405:S28–S32. doi: 10.1007/BF00581776. [DOI] [PubMed] [Google Scholar]
- Bulger RE, Trump BF. Fine structure of the rat renal papilla. Am J Anat. 1966;118:685–722. doi: 10.1002/aja.1001180302. [DOI] [PubMed] [Google Scholar]
- Burg MB, Green N. Function of thick ascending limb of Henle’s loop. Am J Physiol. 1973;224:659–668. doi: 10.1152/ajplegacy.1973.224.3.659. [DOI] [PubMed] [Google Scholar]
- Chou CL, Knepper MA. In vitro perfusion of chinchilla thin limb segments: segmentation and osmotic water permeability. Am J Physiol Renal, Fluid Electrolyte Physiol. 1992;263:F417–F426. doi: 10.1152/ajprenal.1992.263.3.F417. [DOI] [PubMed] [Google Scholar]
- Chou CL, Knepper MA. In vitro perfusion of chinchilla thin limb segments: urea and NaCl permeabilities. Am J Physiol Renal, Fluid Electrolyte Physiol. 1993;264:F337–F343. doi: 10.1152/ajprenal.1993.264.2.F337. [DOI] [PubMed] [Google Scholar]
- Dantzler WH, Evans KK, Pannabecker TL. Osmotic water permeabilities in specific segments of rat inner medullary thin limbs of Henle’s loops. FASEB J. 2009;23:970. [Google Scholar]
- Gottschalk CW, Mylle M. Micropuncture study of the mammalian urinary concentrating mechanism: evidence for the countercurrent hypothesis. Am J Physiol. 1959;196:927–936. doi: 10.1152/ajplegacy.1959.196.4.927. [DOI] [PubMed] [Google Scholar]
- Hai MA, Thomas S. The time-course of changes in renal tissue composition during lysine vasopressin infusion in the rat. Pflugers Arch. 1969;310:297–319. doi: 10.1007/BF00587241. [DOI] [PubMed] [Google Scholar]
- Hargitay B, Kuhn W. Das Muliplikationsprinzip als Grundlage der Harnkonzentrierung in der Niere. Z Electrochem u ang Physical Chem. 1951;55:539–558. [Google Scholar]
- Hervy S, Thomas SR. Inner medullary lactate production and urine-concentrating mechanism: a flat medullary model. Am J Physiol Renal Physiol. 2003;284:F65–F81. doi: 10.1152/ajprenal.00045.2002. [DOI] [PubMed] [Google Scholar]
- Imai M. Function of the thin ascending limb of henle of rats and hamsters perfused in vitro. Am J Physiol. 1977;232:F201–F209. doi: 10.1152/ajprenal.1977.232.3.F201. [DOI] [PubMed] [Google Scholar]
- Imai M, Kokko JP. Sodium chloride, urea, and water transport in the thin ascending limb of henle. Generation of osmotic gradients by passive diffusion of solutes. J Clin Invest. 1974;53:393–402. doi: 10.1172/JCI107572. [DOI] [PMC free article] [PubMed] [Google Scholar]
- Imai M, Kusano E. Effects of arginine vasopressin on the thin ascending limb of henle’s loop of hamsters. Am J Physiol. 1982;243:F167–F172. doi: 10.1152/ajprenal.1982.243.2.F167. [DOI] [PubMed] [Google Scholar]
- Jamison RL, Kriz W. Urinary Concentrating Mechanism. Oxford University Press; New York: 1982. [Google Scholar]
- Jen JF, Stephenson JL. Externally driven countercurrent multiplication in a mathematical model of the urinary concentrating mechanism of the renal inner medulla. Bull Math Biol. 1994;56:491–514. doi: 10.1007/BF02460468. [DOI] [PubMed] [Google Scholar]
- Kato A, Naruse M, Knepper MA, Sands JM. Long-term regulation of inner medullary collecting duct urea transport in rat. J Am Soc Nephrol. 1998;9:737–745. doi: 10.1681/ASN.V95737. [DOI] [PubMed] [Google Scholar]
- Kim J, Pannabecker TL. Two-compartment model of inner medullary vasculature supports dual modes of vasopressin-regulated inner medullary blood flow. Am J Physiol Renal Physiol. 2010;299:F273–F279. doi: 10.1152/ajprenal.00072.2010. [DOI] [PMC free article] [PubMed] [Google Scholar]
- Kim YH, Kim DU, Han KH, Jung JY, Sands JM, Knepper MA, Madsen KM, Kim J. Expression of urea transporters in the developing rat kidney. Am J Physiol Renal Physiol. 2002;282:F530–F540. doi: 10.1152/ajprenal.00246.2001. [DOI] [PubMed] [Google Scholar]
- Kneen MM, Harkin DG, Walker DL, Alcorn D, Harris PJ. Imaging of renal medullary interstitial cells in situ by confocal fluorescence microscopy. Anat Embryol. 1999;200:117–121. doi: 10.1007/s004290050265. [DOI] [PubMed] [Google Scholar]
- Knepper MA. Measurement of osmolality in kidney slices using vapor pressure osmometry. Kidney Int. 1982;21:653–655. doi: 10.1038/ki.1982.73. [DOI] [PubMed] [Google Scholar]
- Knepper MA, Saidel GM, Hascall VC, Dwyer T. Concentration of solutes in the renal inner medulla: interstitial hyaluronan as a mechano-osmotic transducer. Am J Physiol Renal Physiol. 2003;284:F433–F446. doi: 10.1152/ajprenal.00067.2002. [DOI] [PubMed] [Google Scholar]
- Koepsell H, Nicholson WAP, Kriz W, Höhling T. Measurements of exponential gradients of sodium and chloride in the rat kidney medulla using the electron microprobe. Pflügers Arch. 1974;350:167–184. doi: 10.1007/BF00586235. [DOI] [PubMed] [Google Scholar]
- Kokko JP, Rector FC. Countercurrent multiplication system without active transport in inner medulla. Kidney Int. 1972;2:214–223. doi: 10.1038/ki.1972.97. [DOI] [PubMed] [Google Scholar]
- Kriz W. Der architektonische und funktionelle Aufbau der Rattenniere. Z Zellforsch. 1967;82:495–535. [PubMed] [Google Scholar]
- Kuhn W, Ryffel K. Herstellung konzentrierter Losüng aus verdünten durch blosse Membranwirkung: ein Modellversuch zur Funktion der Niere. Hoppe-Seylers Z Physiol Chem. 1942;276:145–178. [Google Scholar]
- Kuhn W, Ramel A. Activer Salztransport als möglicher (und wahrscheinlicher) Einzeleffekt bei der Harnkonzentrierung in der Niere. Helv Chim Acta. 1959;42:628–660. [Google Scholar]
- Layton HE, Davies JM. Distributed solute and water reabsorption in a central core model of the renal medulla. Math Biosci. 1993;116:169–196. doi: 10.1016/0025-5564(93)90065-i. [DOI] [PubMed] [Google Scholar]
- Layton AT, Layton HE. A region-based model framework for the rat urine concentrating mechanism. Bull Math Biol. 2003;65:859–901. doi: 10.1016/S0092-8240(03)00045-4. [DOI] [PubMed] [Google Scholar]
- Layton AT, Layton HE. A region-based mathematical model of the urine concentrating mechanism in the rat outer medulla. I. Formulation and base-case results. Am J Physiol. 2005;289:F1346–F1366. doi: 10.1152/ajprenal.00346.2003. [DOI] [PubMed] [Google Scholar]
- Layton AT, Pannabecker TL, Dantzler WH, Layton HE. Two modes for concentrating urine in rat inner medulla. Am J Physiol Renal Physiol. 2004;287:F816–F839. doi: 10.1152/ajprenal.00398.2003. [DOI] [PubMed] [Google Scholar]
- Layton AT, Layton HE, Dantzler WH, Pannabecker TL. The mammalian urine concentrating mechanism: hypotheses and uncertainties. Physiology. 2009;24:250–256. doi: 10.1152/physiol.00013.2009. [DOI] [PubMed] [Google Scholar]
- Layton AT, Pannabecker TL, Dantzler WH, Layton HE. Functional implications of the three-dimensional architecture of the rat renal inner medulla. Am J Physiol Renal Physiol. 2010;298:F973–F987. doi: 10.1152/ajprenal.00249.2009. [DOI] [PMC free article] [PubMed] [Google Scholar]
- Lemley KV, Kriz W. Anatomy of the renal interstitium. Kidney Int. 1991;39:370–381. doi: 10.1038/ki.1991.49. [DOI] [PubMed] [Google Scholar]
- Liu W, Morimoto T, Kondo Y, Iinuma K, Uchida S, Imai M. “Avian-type” renal medullary tubule organization causes immaturity of urine-concentrating ability in neonates. Kidney Int. 2001;60:680–693. doi: 10.1046/j.1523-1755.2001.060002680.x. [DOI] [PubMed] [Google Scholar]
- Marcano M, Layton AT, Layton HE. An optimization algorithm for a distributed-loop model of an avian urine concentrating mechanism. Bull Math Biol. 2006;68:1625–1660. doi: 10.1007/s11538-006-9087-1. [DOI] [PubMed] [Google Scholar]
- Marsh DJ, Azen SP. Mechanism of NaCl reabsorption by hamster thin ascending limbs of Henle’s loop. Am J Physiol. 1975;228:71–79. doi: 10.1152/ajplegacy.1975.228.1.71. [DOI] [PubMed] [Google Scholar]
- Marsh DJ, Solomon S. Analysis of electrolyte movement in thin henle’s loops of hamster papilla. Am J Physiol. 1965;208:1119–1128. doi: 10.1152/ajplegacy.1965.208.6.1119. [DOI] [PubMed] [Google Scholar]
- Pannabecker TL. Loop of Henle interaction with interstitial nodal spaces in the renal inner medulla. Am J Physiol Renal Physiol. 2008;295:F1744–F1751. doi: 10.1152/ajprenal.90483.2008. [DOI] [PMC free article] [PubMed] [Google Scholar]
- Pannabecker TL, Dantzler WH. Three-dimensional lateral and vertical relationships of inner medullary loops of Henle and collecting ducts. Am J Physiol Renal Physiol. 2004;287:F767–F774. doi: 10.1152/ajprenal.00122.2004. [DOI] [PubMed] [Google Scholar]
- Pannabecker TL, Dantzler WH. Three-dimensional architecture of inner medullary vasa recta. Am J Physiol Renal Physiol. 2006;290:F1355–F1366. doi: 10.1152/ajprenal.00481.2005. [DOI] [PubMed] [Google Scholar]
- Pannabecker TL, Dantzler WH. Three-dimensional architecture of collecting ducts, loops of Henle, and blood vessels in the renal papilla. Am J Physiol Renal Physiol. 2007;293:F696–F704. doi: 10.1152/ajprenal.00231.2007. [DOI] [PubMed] [Google Scholar]
- Pannabecker TL, Abbott DE, Dantzler WH. Three-dimensional functional reconstruction of inner medullary thin limbs of Henle’s loop. Am J Physiol Renal Physiol. 2004;286:F38–F45. doi: 10.1152/ajprenal.00285.2003. [DOI] [PubMed] [Google Scholar]
- Pannabecker TL, Dantzler WH, Layton HE, Layton AT. Role of three-dimensional architecture in the urine concentrating mechanism of the rat renal inner medulla. Am J Physiol Renal Physiol. 2008a;295:F1271–F1285. doi: 10.1152/ajprenal.90252.2008. [DOI] [PMC free article] [PubMed] [Google Scholar]
- Pannabecker TL, Henderson C, Dantzler WH. Quantitative analysis of functional reconstructions reveals lateral and axial zonation in the renal inner medulla. Am J Physiol Renal Physiol. 2008b;294:1306–1314. doi: 10.1152/ajprenal.00068.2008. [DOI] [PubMed] [Google Scholar]
- Pennell JP, Lacy FB, Jamison RL. An in vivo study of the concentrating process in the descending limb of Henle’s loop. Kidney Int. 1974;5:337–347. doi: 10.1038/ki.1974.49. [DOI] [PubMed] [Google Scholar]
- Rocha AS, Kokko JP. Sodium chloride and water transport in the medullary thick ascending limb of Henle. J Clin Invest. 1973;52:612–623. doi: 10.1172/JCI107223. [DOI] [PMC free article] [PubMed] [Google Scholar]
- Russ JC. The Image Processing Handbook. CRC Press; Boca Raton, FL: 1999. [Google Scholar]
- Sands JM, Layton HE. The urine concentrating mechanism and urea transporters. In: Alpern RJ, Hebert SC, editors. The Kidney: Physiology and Pathophysiology. Elsevier; Philadelphia: 2007. pp. 1143–1177. [Google Scholar]
- Sands JM, Nonoguchi H, Knepper MA. Vasopressin effects on urea and H2O transport in inner medullary collecting duct subsegments. Am J Physiol. 1987;253:F823–F832. doi: 10.1152/ajprenal.1987.253.5.F823. [DOI] [PubMed] [Google Scholar]
- Schmidt-Nielsen B. The renal concentrating mechanism in insects and mammals: a new hypothesis involving hydrostatic pressures. Am J Physiol Regul Integr Comp Physiol. 1995;268:R1087–R1100. doi: 10.1152/ajpregu.1995.268.5.R1087. [DOI] [PubMed] [Google Scholar]
- Stephenson JL. Concentration of urine in a central core model of the renal counterflow system. Kidney Int. 1972;2:85–94. doi: 10.1038/ki.1972.75. [DOI] [PubMed] [Google Scholar]
- Takahashi-Iwanaga H. The three-dimensional cytoarchitecture of the interstitial tissue in the rat kidney. Cell Tissue Res. 1991;264:269–281. doi: 10.1007/BF00313964. [DOI] [PubMed] [Google Scholar]
- Thomas SR. Inner medullary lactate production and accumulation: a vasa recta model. Am J Physiol Renal Physiol. 2000;279:F468–F481. doi: 10.1152/ajprenal.2000.279.3.F468. [DOI] [PubMed] [Google Scholar]
- Wade JB, Lee AJ, Liu C, Ecelbarger C, Mitchell C, Bradford AD, Terris J, Kim GH, Knepper MA. UT-A2: a 55-kDa urea transporter in thin descending limb whose abundance is regulated by vasopressin. Am J Physiol Renal Physiol. 2000;278:F52–F62. doi: 10.1152/ajprenal.2000.278.1.F52. [DOI] [PubMed] [Google Scholar]
- Wang XQ, Wexler AS. The effects of collecting duct active NaCl reabsorption and inner medulla anatomy on renal concentrating mechanism. Am J Physiol Renal, Fluid Electrolyte Physiol. 1996;270:F900–F911. doi: 10.1152/ajprenal.1996.270.5.F900. [DOI] [PubMed] [Google Scholar]
- Wang X, Thomas SR, Wexler AS. Outer medullary anatomy and the urine concentrating mechanism. Am J Physiol Renal Physiol. 1998;274:F413–F424. doi: 10.1152/ajprenal.1998.274.2.F413. [DOI] [PubMed] [Google Scholar]
- Wexler AS, Kalaba RE, Marsh DJ. Three-dimensional anatomy and renal concentrating mechanism. I. Modeling results. Am J Physiol Renal, Fluid Electrolyte Physiol. 1991;260:F368–F383. doi: 10.1152/ajprenal.1991.260.3.F368. [DOI] [PubMed] [Google Scholar]
- Wirz H, Hargitay B, Kuhn W. Lokalisation des Konzentrierungsprozesses in der Niere durch direkte Kryoskopie. Helv Physiol Acta. 1951;9:196–207. [PubMed] [Google Scholar]
- Yool AJ, Brokl OH, Pannabecker TL, Dantzler WH, Stamer WD. Tetraethylammonium block of water flux in Aquaporin-1 channels expressed in kidney thin limbs of Henle’s loop and a kidney-derived cell line. BMC Physiol. 2002;2:4. doi: 10.1186/1472-6793-2-4. [DOI] [PMC free article] [PubMed] [Google Scholar]
- Yuan J, Pannabecker TL. Architecture of inner medullary descending and ascending vasa recta: pathways for countercurrent exchange. Am J Physiol Renal Physiol. 2010;299:F265–F272. doi: 10.1152/ajprenal.00071.2010. [DOI] [PMC free article] [PubMed] [Google Scholar]
- Zhai XY, Birn H, Jensen KB, Thomsen JS, Andreasen A, Christensen EI. Digital three-dimensional reconstruction of the mouse proximal tubule. J Am Soc Nephrol. 2003;14:611–619. doi: 10.1097/01.asn.0000051725.00406.0c. [DOI] [PubMed] [Google Scholar]
- Zhai XY, Thomsen JS, Birn H, Kristoffersen IB, Andreasen A, Christensen EI. Three-dimensional reconstruction of the mouse nephron. J Am Soc Nephrol. 2006;17:77–88. doi: 10.1681/ASN.2005080796. [DOI] [PubMed] [Google Scholar]
- Zhai XY, Fenton RA, Andreasen A, Thomsen JS, Christensen EI. Aquaporin-1 is not expressed in descending thin limbs of short-loop nephrons. J Am Soc Nephrol. 2007;18:2937–2944. doi: 10.1681/ASN.2007010056. [DOI] [PubMed] [Google Scholar]
- Zimmerhackl B, Robertson CR, Jamison RL. Fluid uptake in the renal papilla by vasa recta estimated by two methods simultaneously. Am J Physiol. 1985;248:F347–F353. doi: 10.1152/ajprenal.1985.248.3.F347. [DOI] [PubMed] [Google Scholar]