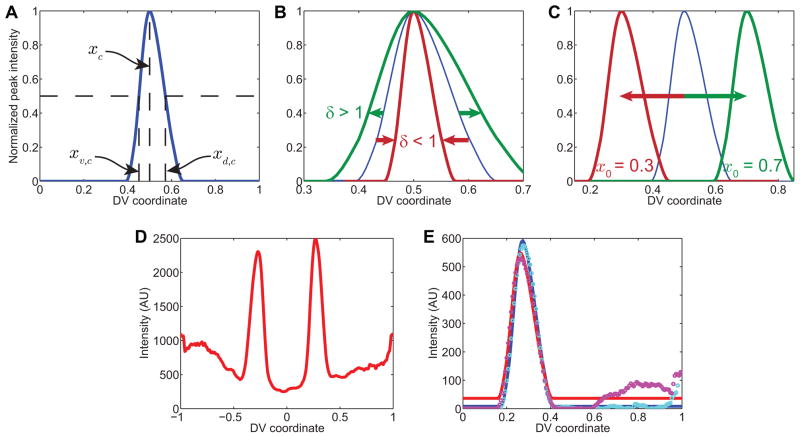
Figure 6. Peak fitting.
(A) Example of canonical gene expression pattern, using vnd. Horizontal dotted lines: half-maximal intensity. xc is the location of the peak in intensity of the canonical pattern, xv,c is the location of the ventral border of the canonical pattern, and xd,c is the location of the dorsal border of the canonical pattern.
(B) Effect of changing the stretching factor, δ. When δ < 1, the pattern shrinks about its peak location (rust-colored curve), and when δ > 1, the pattern expands (green curve). The blue curve is the unstretched canonical pattern for vnd.
(C) Effect of changing the peak location, x0. When x0 is set to 0.3, the pattern shifts ventrally (rust-colored curve), while increasing x0 causes the pattern to shift dorsally (green curve).
(D) Secondary data of vnd pattern from embryo in Figure 1A.
(E) Fits of the stretched and shifted canonical peak of vnd expression to the two peaks in vnd from part (D). Cyan and magenta circles are the right and left halves of (D), respectively. The blue and red solid curves are the fits of the canonical pattern to the measured right- and left-side patterns, respectively.

