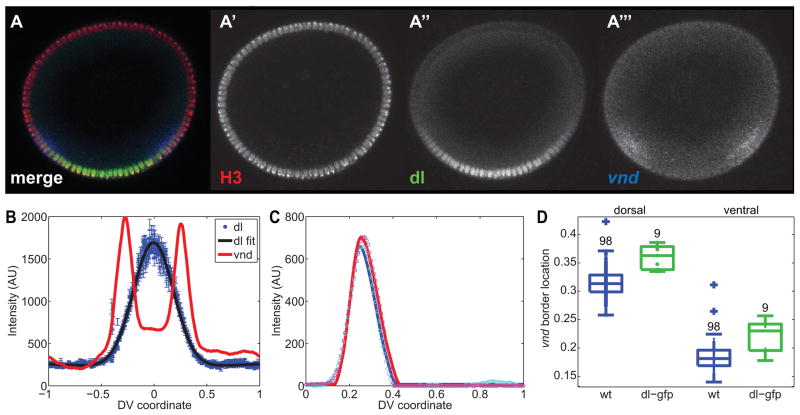
Figure 9. Expansion of the vnd dorsal border in embryos with expanded dl gradients.
(A) dl-gfp embryo stained with anti-histone H3 antibody (red; A′) and anti-dl antibody (green; A″), and hybridized with a vnd antisense RNA probe (blue; A‴).
(B) Plot of the secondary data from the dl-gfp embryo shown in (A).
(C) Fits of the vnd peaks for this embryo. Cyan and magenta circles are the right and left halves of (B), respectively. The blue and red solid curves are the fits of the canonical pattern to the measured right- and left-side patterns, respectively.
(D) Boxplot of vnd dorsal and ventral border locations in wildtype embryos (blue) and dl-gfp embryos (green). Each dot represents an embryo. Plus signs indicate outliers. Numbers indicate embryo sample size. For whether the dorsal border of vnd is the same between wt and dl-gfp, the p-val is 10^−4, and for the ventral borders being the same, p = 0.005.

