

Abstract
Amino acid changes due to non-synonymous variation are included as annotations for individual proteins in UniProtKB/Swiss-Prot and RefSeq which present biological data in a protein- or gene-centric fashion. Unfortunately, proteome-wide analysis of non-synonymous single-nucleotide variations (nsSNVs) is not easy to perform because information on nsSNVs and functionally important sites are not well integrated both within and between databases and their search engines. We have developed SNVDis that allows evaluation of proteome-wide nsSNV distribution in functional sites, domains and pathways. More specifically, we have integrated human-specific data from major variation databases (UniProtKB, dbSNP and COSMIC), comprehensive sequence feature annotation from UniProtKB, Pfam, RefSeq, Conserved Domain Database (CDD) and pathway information from Protein ANalysis THrough Evolutionary Relationships (PANTHER) and mapped all of them in a uniform and comprehensive way to the human reference proteome provided by UniProtKB/Swiss-Prot. Integrated information of active sites, pathways, binding sites, domains, which are extracted from a number of different sources, provides a detailed overview of how nsSNVs are distributed over the human proteome and pathways and how they intersect with functional sites of proteins. Additionally, it is possible to find out whether there is an over- or under-representation of nsSNVs in specific domains, pathways or user-defined protein lists. The underlying datasets are updated once every 3 months. SNVDis is freely available at http://hive.biochemistry.gwu.edu/tool/snvdis.
Keywords: Active site, Binding site, N-linked glycosylation, nsSNP, nsSNV, Variation
Introduction
One of the most common uses of high-throughput sequencing is single-nucleotide variations (SNVs) discovery, resulting in increasingly large numbers of SNVs. Variations that results in a different amino acid belong to the non-synonymous single-nucleotide variation (nsSNV) category. The three major publicly-available resources that compile such variation data are UniProtKB [1], dbSNP [2] and Catalog Somatic Mutations in Cancer (COSMIC) (http://www.sanger.ac.uk/genetics/CGP/cosmic/). Projects like the 1000 Genomes Project [3] are already available in dbSNP and it is expected that these three databases will continue integrating other large-scale SNV data as they become available.
Variation data in itself has very little biological meaning. Integration of complimentary information on sequence features such as those available from UniProtKB, RefSeq [4], Pfam [5], Conserved Domain Database (CDD) [6] and Protein ANalysis THrough Evolutionary Relationships (PANTHER) [7] is necessary to analyze the effects of these variations on active sites, binding sites, protein domains, glycosylation sites, pathways and overall protein and proteome function. Several services are available to identify the effect of nsSNVs on individual protein function which is done mainly through sequence conservation analysis and/or through mapping of sequence and structure features to individual proteins [8–10]. To the best of our knowledge none of them allow proteome-wide analysis of integrated data similar to the work on proteome-wide analysis on the effect of nsSNVs on N-glycosylation sites [11]. SNVDis is a web tool that addresses this by integrating variation data with curated sequence feature annotations in a protein-centric fashion. More specifically, the tool can be used to find nsSNVs inside specific sites (active and binding), protein domains and pathways in user-defined set of proteins or in the entire proteome. SNVDis can also be used to statistically evaluate if there is an over- or under-representation of nsSNVs in specific domains and pathways and user defined protein sets.
Methods
Architecture
All the datasets required for the analysis are collected, updated and stored, on a regular basis, in a database in the High-performance Integrated Virtual Environment (HIVE) server [12]. The datasets are organized in a database with all data mapped to nsSNV ids (Figure 1).
Figure 1.
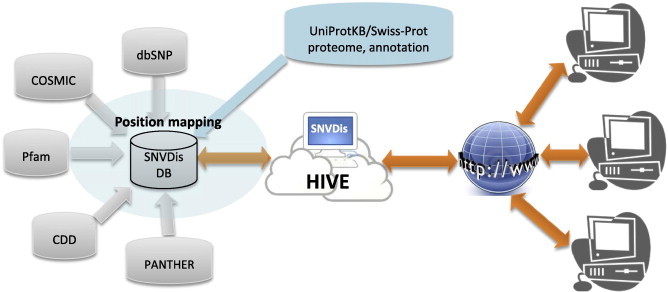
SNVDis data integration model Additional data can be easily integrated into the database if they are mapped to any sequence database accession numbers or identifiers.
Datasets
The complete human proteome is obtained from UniProtKB/Swiss-Prot using the complete proteome keyword. Then sSNV variation data is extracted from UniProtKB/Swiss-Prot, RefSeq which provides dbSNP data and COSMIC. Information on pathways is collected from PANTHER, protein domain information is obtained from Pfam and information on active and binding sites and N-linked glycosylation sites is collected from UniProtKB and CDD. Apart from UniProtKB data which is downloaded using UniProtJAPI, the rest of the datasets are extracted from files provided in ftp servers of each database.
Position mapping
Since both Pfam and PANTHER provide their datasets mapped to UniProtKB, there is no need to perform any additional mapping. In contrast, ID mapping [13] is necessary in the case of dbSNP, CDD and COSMIC data. Pairs already mapped between these databases are extracted from ID mapping files and the Needleman-Wunsch algorithm [14] is used to align sequence pairs to confirm mappings.
Expected nsSNVs
The tool returns the number of nsSNVs that are present inside a domain, site (active, binding or N-glycosylation) or a group of proteins and also provides the number of nsSNVs that should be expected on the assumption of uniform distribution. The number of expected nsSNVs is calculated using the following equation:
where and depend on the type of the analysis. In the case of domains or custom domains analysis, is the number of nsSNVs found inside the domain. is the sum of sizes of that domain found in various proteins and is the sum of sizes of these proteins that contain the domain. In the case of protein set analysis, is the number of nsSNVs found inside the proteins of this protein set. is the sum of sizes of all the proteins in this protein set and is the size of the entire proteome. In the case of site analysis, is the number of nsSNVs found inside the sites. is the sum of sizes of these sites found in various proteins and is the sum of sizes of these proteins that contain these sites. P value is calculated based on methodology described earlier [15].
Computational environment
HIVE provides computational infrastructure for storage and analysis for this project. Resources include two Dell servers, an integrated computational powerhouse private cloud, 10Gb 48-port Ethernet switch and cloud control servers.
Results and discussion
Users can perform queries using different combinations of nsSNV datasets from UniProtKB, dbSNP, COSMIC and NCI-60 cell lines and analyze their effect on active sites, binding sites, N-linked glycosylation sites, protein domains and pathways. As a first step, the user selects the sources of nsSNV data and the UniProtKB accessions that are included in the search. The accession numbers can only be a subset of UniProtKB/Swiss-Prot’s human proteome set or the entire human proteome. At the time of writing of this paper, there were almost 780,000 nsSNVs collected from COSMIC (including NCI-60), UniProtKB and dbSNP. Out of them, about 670,000 were mapped successfully to UniProtKB/Swiss-Prot human proteome. Finally, due to duplications inside individual datasets and between different data sources, more than 450,000 distinct variations were mapped to the human proteome. Distinct variations are defined as those that occur at different positions or lead to different amino acid changes.
Analysis of nsSNVs in functional sites
Functionally important amino acid sites such as active sites and binding sites are based on manually-curated annotations available from UniProt [1] and CDD [6]. In Figure 2A, we can easily see that the three data sources from which we get our variation data, namely UniProtKB, dbSNP and COSMIC, have very different coverage. In fact, in the example of active sites there are no nsSNVs that come from all three sources and the overlap of COSMIC with UniProtKB and dbSNP is quite low (Figure 2A), while there is some overlap for binding sites (Figure 2B). We intend to continue including other sources of high-quality variation data based on user requests.
Figure 2.
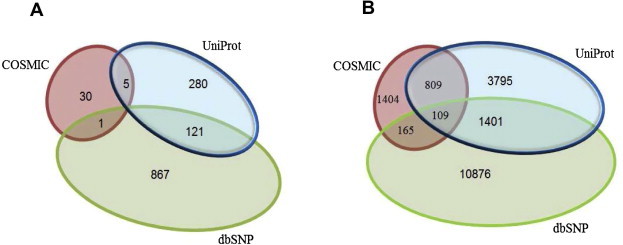
Distribution of nsSNVs A. The total number of nsSNVs from different databases that fall inside active sites as annotated by UniProt or CDD. B. Similarly, the number of nsSNVs that can be found inside binding site regions defined by UniProt or CDD. Notice that in both cases, all databases have a large percentage of unique entries.
One of the major advantages of this service is the ability to query and analyze integrated datasets. For example, integrating active site and binding site information from the two major sources of curated sequence features (UniProtKB/Swiss-Prot and CDD) with data from three variation databases can quickly provide a comprehensive view of the potential effect of variation on protein function. For example, we find 559 enzymes which possibly are inactive in certain populations or cells due to variations in their active site. Based on UniProtKB/Swiss-Prot keyword and Gene Ontology analysis, enzymes involved in carbohydrate and lipid metabolism are over-represented in the dataset while proteins involved in transcription and transport are highly under-represented. Clustering of these 559 enzymes reveals that kinases and proteases form the two largest protein families that are impacted by nsSNVs on their active sites.
Analysis of nsSNVs in protein domains
Users can also find which protein domains and/or pathways have significantly higher numbers of nsSNVs. Pfam domains Trypsin (PF00089), Tyrosine kinase (PF07714) and SET (PF00856) are examples of such domains with significantly higher than expected numbers of nsSNVs. Users can select to retrieve nsSNV distribution results for all the PFAM domains by selecting no P value cut-off, or alternatively they can select a stringent P value cut-off to retrieve only those domains that have significantly higher than expected number of nsSNVs. Users can also select to investigate just one domain by using the ‘Select a domain’ option.
Analysis of nsSNVs in pathways
The tool makes it easy to find pathways that have significantly higher numbers of nsSNVs than what is expected. Examples of such pathways include p53 pathways and ubiquitin proteasome pathway. Users can also have a list of accessions, representing a user-defined pathway, which they can upload and check to see if there is an over- or under-representation of nsSNVs in their dataset. For example, the user can perform a search in the UniProt database to retrieve all proteins involved in Alzheimer’s disease and they can then upload these accessions to see if there are significantly higher or lower numbers of nsSNVs in these proteins compared to the normal distribution expected. From the results page users can also explore the variations further through hyperlinks to databases such as UniProt, RefSeq and dbSNP.
Analysis of nsSNVs in user-defined regions of proteins
Users may have a list of proteins with regions in these proteins; such as domain boundaries that are of specific interest. Such a dataset consisting of UniProtKB accession (one per line) followed by comma separated amino acid ranges (e.g., Q8WXI7, 1–10,000, and 10,001–20,000) can be investigated to see if there are more nsSNVs in specific regions of the proteins.
Usage and utility
We provide an elegant yet simple tool that allows proteome-wide analysis of variation data. Although analysis of single proteins is possible using this tool, the main emphasis of the tool is to provide a comprehensive view of the effect of nsSNV on the entire proteome or pathways or all proteins that have a specific domain. The tool is flexible and allows users to define which proteins constitute the proteome or pathway. Users can also define custom domain boundaries. Below are some use-cases that highlight several tool features.
Identify proteins in the human proteome that has loss of glycosylation sites due to nsSNVs
The glycoproteome is variable. It is clear that to get a comprehensive view of the glycoproteome, we need to factor in gain/loss of glycosylation sites due to SNVs [11]. Such novel sites can be present in some populations or in cancer cells. List of proteins that are affected at the N-linked glycosylation site due to variation can be retrieved by selecting UniProtKB/Swiss-Prot proteome and all the variation datasets shown in the tool home page and clicking ‘Submit’. This will take the user to the next page which has several types of nsSNV analysis options. In the ‘Functional sites’ analysis box, select ‘N-linked glycosylation sites’ and then unclick ‘or not’ check box and then select ‘Submit’. The results page will be generated which provides tables and graphical representation of the sites, proteins and the type of amino acids (polar, negatively charged, neutral and positively charged) involved in the variation.
Retrieve proteins with nsSNVs at active sites or binding sites
Users can choose to find out the effect in the entire proteome or just a set of proteins (for example, a set of proteins found to be down-regulated in some experiment). Such a list of proteins can be retrieved by following the same workflow as described above except, instead of selecting ‘N-linked glycosylation sites’, the user would need to select ‘Active sites’ and/or ‘Binding sites’. By merging data from several extant databases and using the tool, we find that there are 934 unique nsSNVs that occur at the active sites of 559 unique proteins. Follow up pathway and functional analysis using Ingenuity Pathway Analysis® (IPA) tools, a web based interface for Ingenuity Knowledge Base (Ingenuity® Systems, http://www.ingenuity.com) shows several pathways over- or under-represented in the active site nsSNV dataset, with the most significantly affected pathways involved in carbohydrate metabolism. Disease-propensity analysis shows a significant over-representation of glycogen storage diseases (GSD) and various neurodegenerative diseases. Such results are interesting because in follow-up studies one can try to see what products or substrates would be altered if such a variation was to be found. Genotyping chips, which can scan thousands of people, can be used to see if any of these variations do exist and if such variations lead to metabolic disorders or other phenotypes. These observations are useful in the planning and execution of future studies relating active/binding site nsSNVs to protein dysfunction and human disease. These examples provide data that can be used to generate simple hypotheses, demonstrating predictive utility of this method.
Determine if a particular Pfam domain has over-representation of nsSNVs
To perform this analysis, user selects UniProtKB/Swiss-Prot proteome and all the variation datasets in the tools home page and clicks ‘Submit’. This will take the user to the next page which has several types of nsSNV analysis options. In the ‘Protein domains’ analysis box, click on ‘Select a domain’ and enter ‘PF00856’. For this domain (SET domain), we do see that there is an over-representation of the nsSNVs. This could be due to the fact that this protein has been heavily researched, or it could be also due to the fact that this protein is indeed prone to variation. Additional research would be necessary to investigate these hypotheses.
Enrichment analysis of nsSNVs in custom protein/gene sets
Given a list of proteins/genes that are up-regulated in an experiment, user can find out if these genes are more or less prone to nsSNV compared to the rest of the genes from humans. Such analysis can be done by selecting UniProtKB/Swiss-Prot proteome and all the variation datasets in the home page for the tools and clicking ‘Submit’. This will take the user to the next page which has several types of nsSNV analysis that the user can perform. In the ‘Protein sets’ analysis box, select ‘Select a pathway or provide your set’ and then from the pull-down menu select ‘Provide your own pathway’ and paste UniProtKB accession numbers and click on ‘Submit’. The results page provides tables and graphical representation of the sites, variation and proteins and statistical evaluation of over- or under-representation of the nsSNV in the dataset. In this workflow, user can also choose to use one single protein, although information on one single protein can also be obtained directly by going to the respective databases. The only additional information in this case would be the statistical evaluation of the distribution of the nsSNVs in that particular protein.
Enrichment analysis of nsSNVs in user-defined protein boundaries
Given a list of proteins and regions within these proteins, the ‘Custom domain’ functionality can be used to find out if these regions are more or less prone to nsSNVs. For example, this functionality can be used to determine if there is more variation in the beta-sheets or loops.
There are many more such use-cases which are being compiled and provided on our website. Although the service returns tables with details on each nsSNV, there are also pre-computed datasets available from the website. These datasets were generated based on user requests. Currently the following files are available: all nsSNVs in the human proteome, all nsSNVs in the human proteome that lead to gain of N-linked glycosylation motif and all nsSNVs in the human proteome that lead to loss of N-linked glycosylation.
Conclusion
The tool provides a list of proteins that are affected by variations in annotated functional sites. Such integration of variation data with functional annotation can allows users to perform proteome-wide analysis and hypothesis generation as described in the use-cases above. Although the main focus of the tool is not to report if a variation in a single gene/protein is deleterious, this type of analysis can still be performed to estimate if the amount of variation identified in the protein is over- or under-represented when compared to the rest of the proteome.
Authors’ contributions
RM conceived, designed and coordinated the study, developed a general outline for the algorithm and participated in the writing of the manuscript. KK developed the specific algorithm, was responsible for software design and implementation and participated in the writing of the manuscript. VS participated in the design of the software infrastructure. All authors read and approved the final manuscript.
Competing interests
The authors have declared that no competing interests exist.
Acknowledgements
All computations were performed at High-performance Integrated Virtual Environment (HIVE) located at The George Washington University and co-developed by Drs. Mazumder and Simonyan. Support for this work came from The George Washington University funds to RM. This project is also supported in part by NIH (Grant No. U01 CA168926) and an appointment to the Research Participation program at the Center for Biologics Evaluation and Research administered by the Oak Ridge Institute for Science and Education through an interagency agreement between the U.S. Department of Energy and the U.S. Food and Drug Administration. We would like to thank Dr. Radoslav Goldman and Jing Wu for providing useful comments.
Footnotes
Peer review under responsibility of Beijing Institute of Genomics, Chinese Academy of Sciences and Genetics Society of China.

References
- 1.The UniProt Consortium. Reorganizing the protein space at the Universal Protein Resource (UniProt). Nucleic Acids Res 2012;40:D71–5. [DOI] [PMC free article] [PubMed]
- 2.Sherry S.T., Ward M.H., Kholodov M., Baker J., Phan L., Smigielski E.M. DbSNP: the NCBI database of genetic variation. Nucleic Acids Res. 2001;29:308–311. doi: 10.1093/nar/29.1.308. [DOI] [PMC free article] [PubMed] [Google Scholar]
- 3.The 1000 Genomes Project Consortium. A map of human genome variation from population-scale sequencing. Nature 2010;467:1061–73. [DOI] [PMC free article] [PubMed]
- 4.Pruitt K.D., Tatusova T., Brown G.R., Maglott D.R. NCBI Reference Sequences (RefSeq): current status, new features and genome annotation policy. Nucleic Acids Res. 2012;40:D130–D135. doi: 10.1093/nar/gkr1079. [DOI] [PMC free article] [PubMed] [Google Scholar]
- 5.Punta M., Coggill P.C., Eberhardt R.Y., Mistry J., Tate J., Boursnell C. The Pfam protein families database. Nucleic Acids Res. 2012;40:D290–D301. doi: 10.1093/nar/gkr1065. [DOI] [PMC free article] [PubMed] [Google Scholar]
- 6.Derbyshire MK, Lanczycki CJ, Bryant SH, Marchler-Bauer A. Annotation of functional sites with the Conserved Domain Database. Database (Oxford) 2012;2012:bar058. [DOI] [PMC free article] [PubMed]
- 7.Mi H., Dong Q., Muruganujan A., Gaudet P., Lewis S., Thomas P.D. PANTHER version 7: improved phylogenetic trees, orthologs and collaboration with the Gene Ontology Consortium. Nucleic Acids Res. 2010;38:D204–D210. doi: 10.1093/nar/gkp1019. [DOI] [PMC free article] [PubMed] [Google Scholar]
- 8.Medina I., De Maria A., Bleda M., Salavert F., Alonso R., Gonzalez C.Y. VARIANT: command line, web service and web interface for fast and accurate functional characterization of variants found by next-generation sequencing. Nucleic Acids Res. 2012;40:W54–W58. doi: 10.1093/nar/gks572. [DOI] [PMC free article] [PubMed] [Google Scholar]
- 9.Ramensky V., Bork P., Sunyaev S. Human non-synonymous SNPs: server and survey. Nucleic Acids Res. 2002;30:3894–3900. doi: 10.1093/nar/gkf493. [DOI] [PMC free article] [PubMed] [Google Scholar]
- 10.Schaefer C., Meier A., Rost B., Bromberg Y. SNPdbe: constructing an nsSNP functional impacts database. Bioinformatics. 2012;28:601–602. doi: 10.1093/bioinformatics/btr705. [DOI] [PMC free article] [PubMed] [Google Scholar]
- 11.Mazumder R., Morampudi K.S., Motwani M., Vasudevan S., Goldman R. Proteome-wide analysis of single-nucleotide variations in the N-glycosylation sequon of human genes. PLoS One. 2012;7:e36212. doi: 10.1371/journal.pone.0036212. [DOI] [PMC free article] [PubMed] [Google Scholar]
- 12.Simonyan V, Mazumder R. High-performance Integrated Virtual Environment clouds (HIVE) for extra-large (XL) data analysis. In: The 2011 international conference on bioinformatics and computational biology, Las Vegas, Nevada, 2011.
- 13.Huang H., McGarvey P.B., Suzek B.E., Mazumder R., Zhang J., Chen Y. A comprehensive protein-centric ID mapping service for molecular data integration. Bioinformatics. 2011;27:1190–1191. doi: 10.1093/bioinformatics/btr101. [DOI] [PMC free article] [PubMed] [Google Scholar]
- 14.Needleman S.B., Wunsch C.D. A general method applicable to the search for similarities in the amino acid sequence of two proteins. J Mol Biol. 1970;48:443–453. doi: 10.1016/0022-2836(70)90057-4. [DOI] [PubMed] [Google Scholar]
- 15.Mi H., Thomas P. PANTHER pathway: an ontology-based pathway database coupled with data analysis tools. Methods Mol Biol. 2009;563:123–140. doi: 10.1007/978-1-60761-175-2_7. [DOI] [PMC free article] [PubMed] [Google Scholar]