

Abstract
Objectives
This study sought to determine the relationship of cardiovascular magnetic resonance (CMR) measures of tissue composition to age in the Multi-Ethnic Study of Atherosclerosis (MESA).
Background
Animal and human studies have demonstrated increased collagen deposition in senescent hearts. New CMR indices of tissue composition by using T1 mapping are sensitive to the presence of myocardial fibrosis.
Methods
A total of 1,231 study participants (51% women; age range 54 to 93 years) of the MESA cohort were evaluated with T1 mapping by using 1.5-T CMR scanners. None of the participants had focal scar on delayed enhancement CMR. Single-slice T1 mapping was performed at the midventricular level before and at 12- and 25-min delay after administration of gadolinium contrast by using a modified Look-Locker inversion recovery sequence. The partition coefficient was determined by the slope of the linear relationship of (1/T1myo vs. 1/T1blood). The extracellular volume fraction (ECV) was derived accounting for the hematocrit level. Multivariable regression analyses were performed, adjusting for traditional risk factors and left ventricular structure.
Results
Women had significantly greater partition coefficient, ECV, and precontrast T1 than men, as well as lower post-contrast T1 values (all p < 0.05). In general, linear regression analyses demonstrated that greater partition coefficient, pre-contrast T1 values, and ECV were associated with older age in men (multivariate regression coefficients = 0.01; 5.9 ms; and 1.04% per 10 years’ change; all p < 0.05). ECV was also significantly associated with age in women after multivariable adjustments.
Conclusions
CMR parameters that have been associated with myocardial fibrosis were related to older age in the MESA study. Women had higher ECV than men but less ECV change over time.
Keywords: aging, magnetic resonance imaging, myocardial fibrosis, T1 mapping
Age is a leading risk factor for the development of heart failure in humans. The incidence of heart failure increases more than 5-fold during the seventh and eighth decades of life (1). Because the number of people aged >65 years in North America is expected to double over the next 25 years, more elderly patients will develop heart failure, which is the most common hospital discharge diagnosis and among the most expensive Medicare expense items (2). Cardiac aging is linked with the development of left ventricular (LV) hypertrophy and fibrosis, leading to diastolic dysfunction (3,4) and heart failure with preserved systolic function. Evolving evidence suggests that aging-associated alterations in inflammatory and fibrogenic pathways may be critically involved in the pathogenesis of heart failure in elderly subjects (5–7). Normal aging has also been associated with increased interstitial fibrosis that reduces the reserve capacity of the heart to respond to stress (8). Moreover, animal models of aging have also shown age-related alterations in collagen deposition (9,10). Studies involving human subjects and postmortem examinations have documented increased fibrosis in the conduction system (11) and atria with aging, but the true incidence of global myocardial fibrosis that can be expected in the general elderly population is not known.
Emerging experimental and clinical investigations hold promise for the detection of myocardial fibrosis derived from noninvasive myocardial viability assessment by using contrast-enhanced magnetic resonance (MR) imaging techniques (12–14). Late gadolinium (Gd) enhancement MR protocols use a T1-weighted inversion recovery–prepared fast gradient echo with imaging performed 10 to 20 min after the intravenous administration of an extracellular Gd-based contrast agent (13). Late Gd enhancement CMR is based on the difference of the principal tissue property, the longitudinal spin-lattice relaxation time (T1), to generate the signal contrast between the regional myocardial fibrosis and the normal myocardium. With this T1-weighted imaging technique, infarcted regions in the myocardium, having undergone scar formation with collagen deposition, have a much slower washout rate of Gd-based contrast than healthy myocardium, leading to markedly decreased T1 values (15).
Diffusely fibrotic myocardium accumulates contrast in a fashion similar to regional scarring, but calculation of the T1 time is required for its quantification. The MR imaging techniques, known generically as T1 mapping (16–18), directly measure the longitudinal magnetization recovery (T1) relaxation times of the myocardium at high resolution. T1 mapping enables the characterization of myocardial structure on a scale, which may be standardized and that is particularly useful in evaluating diffusely fibrotic myocardium. CMR T1 measurements have also been strongly correlated with myocardial fibrosis by histological assessment of collagen content (16,19). A novel imaging technique, the modified Look-Locker inversion recovery (MOLLI) sequence developed by Messroghli et al. (17,20–23), allows the measurement of myocardial T1 within 1 breath hold. MOLLI has been proven to be a reproducible method for quantitative tissue characterization and measurement of myocardial fibrosis.
In the current study, we used the MOLLI T1 mapping MR imaging technique to characterize myocardial fibrosis in a large epidemiological population-based study and to determine whether the T1-mapping–derived indices were related to the human aging process. The target study population included 1,231 male and female participants of the Multi-Ethnic Study of Atherosclerosis (MESA) (24) aged 54 to 93 years with T1-mapping measurements obtained between 2010 and 2012 as part of the fifth study examination of MESA.
Methods
Study population
MESA was initiated by the National Heart, Lung, and Blood Institute in 2000 to further understanding of the pathogenesis of atherosclerosis and other cardiovascular diseases. In the longitudinal follow-up of the fifth examination of each subject in the MESA study from April 2010 to February 2012, a total of 3,015 participants underwent CMR imaging. Of these, 1,391 from 5 clinical sites (Johns Hopkins University, Baltimore, Maryland; University of Minnesota, Minneapolis, Minnesota; Northwestern University, Chicago, Illinois; Wake Forest University, Winston-Salem, North Carolina; and University of California, Los Angeles, Los Angeles, California) received T1 mapping by using the MOLLI sequence. From these subjects, 1,231 studies with no findings of myocardial scar were included in the current analyses. Institutional review boards at each center approved the study protocol, and all participants gave written informed consent.
Study procedures: CMR imaging
MESA participants without contraindications underwent CMR examinations by using 1.5-T scanners (Avanto and Espree, Siemens Medical Systems, Erlangen, Germany) with a 6-channel anterior phased array torso coil and corresponding posterior coil elements. LV function, dimensions, and myocardial mass were assessed by a cine steady-state free precession sequence. Twelve short axis slices, one 4-chamber view, and one 2-chamber view were acquired. Participants undergoing CMR scans were screened for Gd eligibility. The major inclusion criteria were the glomerular filtration rates (GFRs). Participants with a GFR ≥45 ml/min (60 ml/min for the site at Northwestern University) and with no history of allergic reaction to contrast agents were qualified to receive Gd. Delayed contrast enhancement images were obtained 15 min after an intravenous bolus injection of Gd–diethylene triamine pentaacetic acid (0.15 mmol/kg [Magnevist®, Bayer Healthcare Pharmaceuticals, Montville, New Jersey]) to identify regional fibrosis. Twelve short axis slices, 1 horizontal long axis, and 1 vertical long axis at the same positions as the LV function cine images were acquired.
For evaluation of diffuse fibrosis, 1 short axis pre-contrast MOLLI image at the mid-slice position was acquired, repeated at 12 and 25 min after contrast injection. The timing was chosen to be comparable with previous studies (16,25,26) and also to accommodate the design of the entire CMR protocol. The MOLLI sequence acquired a set of 11 source images in 17 heartbeats. It consisted of 3 consecutively inversion recovery–prepared electrocardiography-synchronized Look-Locker trains. Each of the 3 trains began with an inversion pulse at specific inversion time (T1 = 100, 200, and 350 ms), after which multiple single-shot, steady-state free precession images were acquired in consecutive heartbeats. All images were acquired with the same trigger delay time in end diastole. The exact scanning parameters were as follows: flip angle = 35°; repetition time = 2.2 ms; echo time = 1.1 ms; field of view = 360 × 360 mm; matrix = 192 × 183; slice thickness = 8 mm; generalized autocalibrating partially parallel acquisitions factor = 2.
Data and statistical analysis
T1 maps were constructed offline by using MASS research software (Department of Radiology, Leiden University Medical Center, Leiden, the Netherlands). A 3-parameter curve fit of the MOLLI source images according to the Levenberg-Marquardt algorithm were performed with automatic calculation of T1 values for each pixel. On each T1 map (pre-contrast and post-contrast), a region of interest was manually drawn around the core myocardium to exclude the blood pool and epicardial fat to calculate the myocardial T1 time for each subject. The partition coefficient was determined by the slope of the linear relationship of (1/T1myo vs. 1/T1blood) at 3 time points. Fraction of extracellular volume (ECV [%]) was derived accounting for the hematocrit level (ECV = 100 × partition coefficient × [1 – hematocrit]). The Gd clearance rate (ΔT1/Δt [ms/min]) was also calculated by subtracting the T1 changes of the 2 post-contrast time points divided by the acquisition time difference. Values were all expressed as mean ± SD. Univariable linear regression analyses were performed to determine if the T1 indices were subject to a mild systematic heart rate dependency (17).
The cohort was stratified according to sex in all analyses. The 10-year risk of all coronary heart disease events was estimated by using the Framingham equation (27). Smoking, diabetes, hypertension (systolic/diastolic blood pressure ≥140/90 mm Hg), and metabolic syndrome (defined according to National Cholesterol Education Program guidelines) (28) were treated as binary variables (yes/no) and compared between groups (men/women) by using the chi-square test. For global cardiac function, LV ejection fraction as well as the LV myocardial mass to volume ratio were used as dependent variables. Sex-specific distributions of T1 indices were categorized into quartiles across subjects aged 54 to 93 years in 10-year increments and reported as mean ± SD. To determine the association to the aforementioned measured/calculated T1 indices, age was treated as a continuous variable. Linear regressions with multivariate adjustments for demographic characteristics and risk factors were performed: model 1 adjusted for race/ethnicity, weight, and heart rate; model 2 adjusted for the variables in model 1 in addition to systolic blood pressure, estimated GFR, and current smoking status; and model 3 included the variables from model 2 and also further adjusted for smoking pack years, diabetes mellitus, taking medication for hypertension, low-density lipoprotein, high-density lipoprotein, LV mass to volume ratio, and highest education level completed. Regression coefficient (B) was reported per 10 years’ change, and a p value < 0.05 was used for significance for all analyses.
In addition to adjusting for major risk factors, we evaluated the relationship of age and T1 indices for participants with a body mass index (BMI) between 18 and 30 kg/m2, never smokers, without hypertension or diabetes. Sex-specific linear regressions with multivariate adjustments for race, weight, estimated GFR, and heart rate were performed in this “healthy” subcohort.
Results
Baseline characteristics of participants stratified according to sex are summarized in Table 1; there were 625 women and 606 men with T1 mapping CMR measures. Age, BMI, and the distributions of race/ethnicity did not differ between women and men. The race/ethnic distribution globally was 51.7% white, 22.5% African American, 14.1% Hispanic, and 11.7% Chinese American. Only 6.8% were current smokers, 52.1% had hypertension, and 15% had diabetes. Women had a slightly but significantly higher heart rate than men during CMR T1 mapping acquisitions (p = 0.005). Sex-related differences were shown in cardiac function measurements, in which LV mass, volume, stroke volume (all indexed according to body surface area), and mass-to-volume ratio were greater in men than in women. However, the ejection fraction was higher in women than in men. Compared with women, men also had significantly higher total calcium scores as well as Framingham risk scores. Univariable linear regression analyses did not show significant heart rate dependence for any of the T1 indices.
Table 1.
Characteristics of the Study Population
| Women (n = 625) |
Men (n = 606) |
p | |
|---|---|---|---|
| Age (yrs) | 67 ± 9 | 67 ± 9 | 0.94 |
| Height (cm) | 160 ± 6.6 | 174 ± 7.5 | <0.001 |
| Weight (lb) | 161 ± 36 | 188 ± 35 | <0.001 |
| BMI (kg/m2) | 28 ± 6 | 28 ± 5 | 0.24 |
| White/African/Chinese/Hispanic (%) | 54/23/11/12 | 50/22/12/16 | 0.13 |
| Heart rate (beats/min) | 65.3 ± 9.5 | 63.8 ± 10 | 0.005 |
| Systolic blood pressure (mm Hg) | 122 ± 20 | 121 ± 18 | 0.49 |
| Diastolic blood pressure (mm Hg) | 65 ± 9 | 71 ± 9 | <0.001 |
| Current smokers | 41 (6.6) | 43 (7.1) | <0.001 |
| Hypertension | 343 (54.9) | 298 (49.2) | 0.045 |
| Diabetes | 87 (13.9) | 98 (16.2) | 0.002 |
| Metabolic syndrome* | 233 (37.3) | 182 (30) | 0.001 |
| HDL cholesterol (mg/dl) | 60.2 ± 16.9 | 49.1 ± 13.1 | <0.001 |
| LDL cholesterol (mg/dl) | 110.8 ± 31.2 | 100.6 ± 30.4 | <0.001 |
| Total cholesterol (mg/dl) | 193.2 ± 34.6 | 171.5 ± 34 | <0.001 |
| Triglycerides (mg/dl) | 111.8 ± 58.7 | 110 ± 69 | 0.78 |
| Total calcium score | 108 ± 260 | 345 ± 593 | <0.001 |
| eGFR (ml/min/1.73 m2) | 85 ± 21 | 85 ± 17 | 0.52 |
| Framingham risk score | 0.06 ± 0.04 | 0.13 ± 0.07 | <0.001 |
| LV end-diastolic volume index (ml/m2) | 61.7 ± 11.2 | 68.3 ± 14.7 | <0.001 |
| LV end-systolic volume index (ml/m2) | 22.2 ± 5.9 | 27.3 ± 8.2 | <0.001 |
| LV mass index (g/m2) | 68.2 ± 2.6 | 82.9 ± 2.5 | <0.001 |
| LV stroke volume index (ml/m2) | 39.5 ± 7.7 | 40.9 ± 9.3 | 0.003 |
| LV ejection fraction (%) | 64.1 ± 6.2 | 60.2 ± 6.7 | <0.001 |
| LV mass-to-volume ratio (g/ml) | 0.96 ± 0.19 | 1.08 ± 0.24 | <0.001 |
| Partition coefficient | 0.46 ± 0.04 | 0.44 ± 0.04 | <0.001 |
| Pre-contrast myocardial T1 (ms) | 986 ± 45 | 968 ± 38 | <0.001 |
| Post-contrast myocardial T1 (ms) | |||
| 12-min | 442 ± 42 | 471 ± 33 | <0.001 |
| 25-min | 505 ± 41 | 535 ± 34 | <0.001 |
| ΔT1/Δt (ms/min)† | 4.84 ± 1.31 | 4.79 ± 1.30 | 0.51 |
| Hematocrit (%)‡ | 38.4 ± 2.9 | 41.6 ± 3.5 | <0.001 |
| Extracellular volume fraction (%)‡ | 28.1 ± 2.8 | 25.8 ± 2.9 | <0.001 |
Values are mean ± SD, %, or no. (%).
Defined according to National Cholesterol Education Program guidelines.
ΔT1/Δt = T1 changes per min between 12 and 25 min after contrast.
n = 321 for women; n = 287 for men.
BMI = body mass index; eGFR = estimated glomerular filtration rate; HDL = high-density lipoprotein; LDL = low-density lipoprotein; LV = left ventricular.
All T1 indices were significantly different between women and men, except the Gd clearance rate (ΔT1/Δt). Hematocrit was not available for some MESA participants because of the logistics of handling laboratory specimens in 2 recruiting centers. Women had significantly higher pre-contrast T1 values, partition coefficient, and ECV, as well as lower post-contrast T1 times, compared with men. Table 2 displays the sex dependence of mean ± SD T1 indices according to age quartiles. The box plots in Figure 1 demonstrate the mean partition coefficient and ECV in each age category stratified according to sex. The partition coefficient increased significantly with age quartiles for men (p trend <0.001), but it remained relatively intact for women (p trend = 0.36). Women had significantly higher partition coefficients than men in the first and the second quartiles (p < 0.01 for both). However, partition coefficients reached the same level for women and men in the third quartile (p = 0.996) and tended to be lower but not statistically significant for women in the last quartile (p = 0.356). When taking into account the hematocrit in the calculation of ECV for a subset of the MESA participants, we found that sex differences were further amplified because women had lower hematocrit levels compared with men (Table 1). Furthermore, hematocrit was also inversely related to age (in all participants, univariable regression coefficient B = −2.11 per 10 years; p = 0.034). Altogether, these factors made the age dependence of ECV stronger than that of partition coefficients. Indeed, women had higher ECV than men in all age categories.
Table 2.
T1 Indices in Each Age Category
| 54-63 Years | 64-73 Years | 74-83 Years | ≥84 Years | p Trend | ||
|---|---|---|---|---|---|---|
| Partition coefficient | Women | 0.455 ± 0.039 | 0.454 ± 0.042 | 0.457 ± 0.044 | 0.465 ± 0.025 | 0.36 |
| Men | 0.436 ± 0.035* | 0.442 ± 0.039* | 0.457 ± 0.044 | 0.473 ± 0.039 | <0.001 | |
| Pre-contrast myocardial T1 (ms) | Women | 984.4 ± 42.7 | 984.6 ± 46.5 | 988.9 ± 47.5 | 988.4 ± 45.3 | 0.38 |
| Men | 962.1 ± 36.7* | 969.0 ± 35.4* | 973.1 ± 43.4* | 985.7 ± 31.9 | <0.001 | |
| 12-min post-contrast myocardial T1 (ms) | Women | 441.9 ± 41.1 | 442.3 ± 43.2 | 442.4 ± 42.1 | 440.5 ± 40.6 | 0.986 |
| Men | 475.2 ± 30.8* | 471.3 ± 31.7* | 467.7 ± 37.4* | 454.9 ± 31.7 | 0.001 | |
| 25-min post-contrast myocardial T1 (ms) | Women | 507.0 ± 42.3 | 505.3 ± 41.6 | 503.1 ± 41.1 | 500.5 ± 35.6 | 0.3 |
| Men | 540.9 ± 33* | 534.2 ± 32.8* | 528.2 ± 36.7* | 512.4 ± 31.2 | <0.001 | |
| ΔT1/Δt (ms/min) | Women | 5.02 ± 1.33 | 4.8 ± 1.32 | 4.6 ± 1.22 | 4.52 ± 1.25 | 0.001 |
| Men | 4.96 ± 1.17 | 4.74 ± 1.2 | 4.64 ± 1.17 | 4.29 ± 1.44 | 0.002 | |
| Extracellular volume fraction (%) | Women | 27.80 ± 2.47 | 28.04 ± 3.00 | 28.24 ± 3.06 | 29.19 ± 1.83 | 0.071 |
| Men | 25.19 ± 2.52* | 25.55 ± 2.57* | 26.52 ± 3.14* | 28.28 ± 3.58 | <0.001 |
Values are mean ± SD.
p < 0.05 between women and men in that age category.
Figure 1. Partition Coefficient and ECV in Age Categories.

The mean (A) partition coefficient and (B) extracellular volume (ECV) fraction in each age category stratified according to sex. *p < 0.05 between women and men.
For the relationship of age with T1 indices, Table 3 displays the regression coefficients (B) derived from multivariate linear regression analyses stratified according to sex. Age was significantly associated with T1 indices for men in all adjusted models. The partition coefficient, pre-contrast T1 times, and ECV were positively correlated with age. Moreover, post-contrast T1 times and Gd clearance rate ΔT1/Δt decreased with age among male MESA participants. For women, Gd clearance rate ΔT1/Δt also decreased with age in all models, and ECV also decreased with age in the adjusted models (p = 0.03 and 0.01 in models 2 and 3, respectively). Figure 2 displays the regression plot between age and ECV for the entire cohort after adjustment for all covariables in model 3. ECV increased with age, and there were no differences of T1 indices among different ethnicities with the same trend for age dependence for all race/ethnic categories.
Table 3.
Regression Models for Association of T1 Indices With Age Across Sex (Regression Coefficients B/p)
| Model 1 |
Model 2 |
Model 3 |
|||||
|---|---|---|---|---|---|---|---|
| B | p | B | p | B | p | ||
| Partition coefficient | Women | 0.001 | 0.958 | 0.001 | 0.601 | 0.001 | 0.504 |
| Men | 0.01 | <0.001 | 0.01 | <0.001 | 0.01 | <0.001 | |
| Pre-contrast myocardial T1 (ms) | Women | 2.8 | 0.19 | 2.81 | 0.231 | 4.36 | 0.087 |
| Men | 6.49 | <0.001 | 5.74 | 0.004 | 4.83 | 0.018 | |
| 12-min post-contrast myocardial T1 (ms) | Women | −1.21 | 0.508 | 1.69 | 0.391 | 2.2 | 0.304 |
| Men | −5.32 | 0.001 | −4.69 | 0.004 | −4.17 | 0.013 | |
| 25-min post-contrast myocardial T1 (ms) | Women | −3.61 | 0.044 | −1.19 | 0.534 | −0.37 | 0.585 |
| Men | −7.88 | <0.001 | −6.67 | <0.001 | −6.28 | 0.001 | |
| ΔT1/Δt (ms/min) | Women | −0.2 | 0.001 | −0.22 | 0.001 | −0.19 | 0.012 |
| Men | −0.18 | 0.004 | −0.17 | 0.016 | −0.19 | 0.007 | |
| Extracellular volume fraction (%) | Women | 0.16 | 0.379 | 0.39 | 0.048 | 0.49 | 0.023 |
| Men | 0.91 | <0.001 | 1.15 | <0.001 | 1.04 | <0.001 | |
Model 1 = multivariable analysis accounting for race/ethnicity, weight, and heart rate; Model 2 = adjusted for the variables in model 1 in addition to systolic blood pressure, estimated glomerular filtration rate, and current smoking status; Model 3 = adjusted for the variables in model 2 in addition to smoking pack years, diabetes mellitus, taking medication for hypertension, low-density lipoprotein, high-density lipoprotein, left ventricular mass-to-volume ratio, and education (highest level completed).
Figure 2. Associations Between Age and ECV.
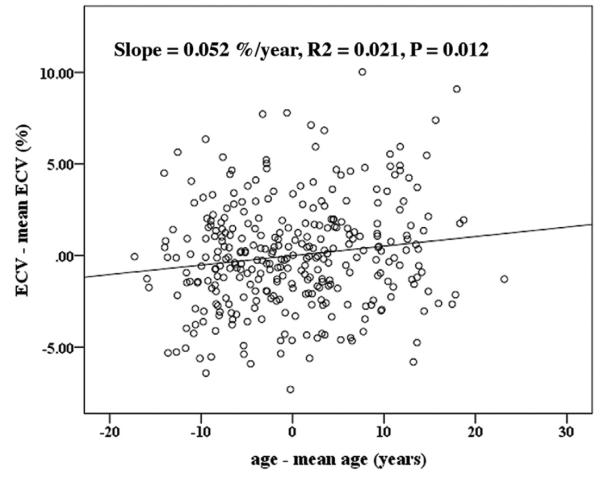
Regression plot between age and extracellular volume fraction (ECV) in all cohorts after adjustments for all covariables in model 3.
The age dependence of T1 indices was also examined in the subcohort of MESA participants with a BMI between 18 and 30 kg/m2, who were never smokers, and had no history of hypertension or diabetes; 92 women and 143 men were included in this subanalysis. In this subgroup of participants without risk factors, the mean BMI was 25 ± 4 kg/m2, and their mean age was slightly less than for the full cohort (65 ±8 and 67 ± 9 years; p < 0.0001). The partition coefficient and ECV did not differ between men and women in this subgroup, but after adjustment for race, body weight, estimated GFR, and heart rate, post-contrast T1 at 25 min (p = 0.005) and the Gd clearance rate (p = 0.03) remained significantly correlated with age in women.
Discussion
Myocardial fibrosis is commonly found in association with cardiac hypertrophy and failure, and it is associated with worsening ventricular systolic function, abnormal cardiac remodeling, and increased ventricular stiffness in animal models (9,11,29). Although endomyocardial biopsy is the most specific procedure for measuring myocardial fibrosis, it is invasive, and its sensitivity is low due to sampling error (30). In the current study, we evaluated myocardial tissue composition by using CMR T1 mapping in a large multiethnic, population-based study. Our results found a consistent specific correlation between T1 indices and age. All CMR indices in men indicated a higher degree of diffuse myocardial fibrosis with greater age, but in women, similar relations were only found in models fully adjusted for cardiovascular risk factors and markers of subclinical cardiovascular diseases.
Previous studies have focused on volunteers and patients with cardiac diseases. Among these, Ugander et al. (26) recruited 60 patients between age 20 and 80 years with cardiovascular disease but without abnormalities on late Gd enhancement images. They found a significant correlation between age and ECV in these subjects. A study conducted by Schelbert et al. (25) also showed significantly increased ECV with age in 10 volunteers with a wide age range (20 to 81 years). Pre-contrast T1 mapping has gained attention recently because it is obviously easier to perform. Noncontrast T1 mapping was able to assess the extent of myocardial damage in acute infarction (31) and to detect acute myocardial edema with high diagnostic accuracy compared with conventional T2-weighted sequences (32). Age-associated changes of pre-contrast T1 values have also been examined in 231 normal controls (age 11 to 85 years) (33) in which pre-contrast T1 decreased slightly with age but with large variations probably secondary to small sample sizes within each age group. In addition, the investigators demonstrated higher pre-contrast T1 in women than in men, which was consistent with our results. The MESA participants in our study were older and were not volunteers, having been selected for participation as part of a population-based design; hence, a direct comparison is difficult.
Our data demonstrated a stronger age dependence of the T1 indices in men than in women. The associations in men remained significant after adjustments for demographic characteristics, estimated GFR, cardiovascular risk factors, and cardiac function, including the LV mass-to-volume ratio. However, in women, only the Gd clearance rate ΔT1/Δt (all models) and ECV (adjusted models) showed significant correlations with age. It is widely recognized that male and female hearts are different in structure and function as well as in response to numerous stimuli (34,35). Olivetti et al. (36) investigated the changes in myocyte size and number that occur with aging in human hearts. They showed that myocyte cell loss and cellular reactive hypertrophy were greater in the senescent male heart, but the number and size of myocytes of the female heart were not altered in the aging process. Female hearts demonstrated better preservation of myocardial structure with aging. These pathological examinations in autopsies confirmed our sex-specific difference in the age dependence of the T1 indices. In addition, LV mass is lower in older men compared with younger men, as shown by CMR (37); this relationship to age is less pronounced in women. The current study extends these observations, suggesting that increased extracellular space becomes more pronounced in older men.
Sex interactions with cardiovascular risk vary with age, and women outnumber men in cardiovascular death rates by 20% after age 65 years (38). In general, male hearts respond less well to pressure or volume overload, to myocardial infarction, and to aging (34). However, it is also notable that women are approximately twice as likely as men to develop heart failure with preserved LV ejection fraction (39,40). In our data, partition coefficients as well as ECV were all greater for women than men. Sado et al. (41) measured ECV by using CMR methods in 81 normal volunteers (median age 43 years; age range 24 to 81 years) and found higher ECV in women than in men. One of the possible explanations suggested in the paper was that the partial volume effects due to the consequence of their measurement techniques (CINE-IR) in the hearts of thinner women could potentially lead to higher ECV. Our study implemented the T1-mapping techniques with higher resolution and gated at the end-diastolic cardiac phase. T1 measurements were carefully restricted to the core myocardium to avoid partial voluming at the wall–blood borders. Using our data, univariate analysis showed that the partition coefficient was inversely correlated to myocardial wall thickness (p = 0.001), but this correlation disappeared after adjustment for age and sex (p = 0.12). Unlike the direct evidence of age association differences in myocardial structure between women and men, to the best of our knowledge, there are no previous population-based studies documenting sex differences in the cardiac extracellular space, particularly involving individuals of diverse race and ethnicity.
For the subgroup of “healthy” participants with reduced exposure to cardiovascular risk factors in our cohort (never smokers, no hypertension, no diabetes, and normal BMI [among other factors]), there was no ECV differences between women and men. As shown in Figure 1, the difference between sexes diminished with age. Compared with the study by Sado et al. (41), our study population was older; hence, a larger sample size might be required to show statistical differences between sexes. Second, there was no correlation between age and myocardial ECV, which is consistent with their findings. We note that the sample size of this healthier cohort is smaller, and we risk emphasizing certain characteristics in this selection process compared with a more general model in which risk factors are included as model covariates. However, we also cannot exclude the possibility that there is a sex-specific response to myocyte cell loss and cellular reactive hypertrophy in diseased hearts, although such difference is minimal in healthy hearts.
Our study also demonstrated higher ejection fractions in women than in men, in agreement with previous reports in a community-based multiethnic study (37). The ejection fractions in the participants of the current study were mostly normal; only 3.6% (n = 45) had ejection fractions <50%. There was no difference in all T1 indices between groups with ejection fractions >50% and <50% even after adjustment for age, sex, and race. Hence, the relation of heart failure to T1 indices cannot be inferred from our study.
Although T1 mapping has gained in popularity and availability in clinical CMR settings, the diagnostic potential of this technique in specific patient groups requires further elucidation. One of the key factors for the differentiation between normal and pathological states is the range of the normal T1 values as well as the ECV. For example, in normal subjects ages 20 to 40 years, the observed range of ECV values (0.22 to 0.32) was relatively large (42). Nevertheless, CMR T1 mapping was able to discriminate between normal subjects and patients with cardiomyopathy and fibrosis by using endomyocardial biopsy and no myocardial scar by using CMR (43).
Study limitations
Our data indicate that age and sex should be taken into consideration when comparing T1 indices cross-sectionally. Based on ample multiethnic population sizes, our results provide the distribution of expected T1 indices categorized by age and sex in a population of apparently normal older individuals. A limitation of the T1 CMR methods is that these indices may vary depending on the MRI technique, field strength, Gd contrast agent, and dose used for the T1 measurement (42,44–47). The partition coefficient and ECV account for blood T1 that should be robust against some of the aforementioned sources of variation, but multiple measurements are required. The generalization of our results may be limited due to the nature of the cross-sectional design; as such, there is a bias toward including in the study individuals with more favorable survivorship. Our study also did not include persons <54 years of age. Finally, the effects of age on the cardiovascular system are probably inseparable from multifactorial events accumulated over a lifetime, including both known and unknown factors that affect the myocardium.
Conclusions
Our study documents a systematic analysis of the distribution of in vivo measurements of myocardial T1 indices obtained with clinical 1.5-T MR systems. CMR parameters that are associated with fibrosis in experimental models were related to older age in the MESA study after taking into account demographic characteristics and cardiovascular risk factors. These indices of interstitial myocardial fibrosis suggest greater age-related changes in men than in women.
Acknowledgments
The authors thank the other investigators, the staff, and the participants of the MESA study for their valuable contributions. A full list of participating MESA investigators and institutions can be found at http://www.mesa-nhlbi.org. We thank Bayer HealthCare, which provided Magnevist for the MESA magnetic resonance imaging study.
This research was supported by contracts N01-HC-95159 through N01-HC-95168 from the National Heart, Lung, and Blood Institute. Dr. van der Geest reports that he has served as a consultant for Medis Medical Imaging Systems. Dr. Lima reports a relationship with Bayer HealthCare. All other authors have reported that they have no relationships relevant to the contents of this paper to disclose. Deborah Kwon, MD, acted as Guest Editor for this paper.
Abbreviations and Acronyms
- BMI
body mass index
- CMR
cardiovascular magnetic resonance
- ECV
extracellular volume
- GFR
glomerular filtration rate
- Gd
gadolinium
- LV
left ventricular
- MOLLI
modified Look-Locker inversion recovery
- MR
magnetic resonance
REFERENCES
- 1.Kannel WB, Belanger AJ. Epidemiology of heart failure. Am Heart J. 1991;121:951–7. doi: 10.1016/0002-8703(91)90225-7. [DOI] [PubMed] [Google Scholar]
- 2.Schappert SM, Rechtsteiner EA. Ambulatory medical care utilization estimates for 2006. Natl Health Stat Report. 2008;8:1–29. [PubMed] [Google Scholar]
- 3.Brilla CG, Janicki JS, Weber KT. Impaired diastolic function and coronary reserve in genetic hypertension. Role of interstitial fibrosis and medial thickening of intramyocardial coronary arteries. Circ Res. 1991;69:107–15. doi: 10.1161/01.res.69.1.107. [DOI] [PubMed] [Google Scholar]
- 4.Reed AL, Tanaka A, Sorescu D, et al. Diastolic dysfunction is associated with cardiac fibrosis in the senescence-accelerated mouse. Am J Physiol Heart Circ Physiol. 2011;301:H824–31. doi: 10.1152/ajpheart.00407.2010. [DOI] [PMC free article] [PubMed] [Google Scholar]
- 5.Chen W, Frangogiannis NG. The role of inflammatory and fibrogenic pathways in heart failure associated with aging. Heart Fail Rev. 2010;15:415–22. doi: 10.1007/s10741-010-9161-y. [DOI] [PMC free article] [PubMed] [Google Scholar]
- 6.de Souza RR. Aging of myocardial collagen. Biogerontology. 2002;3:325–35. doi: 10.1023/a:1021312027486. [DOI] [PubMed] [Google Scholar]
- 7.Kajstura J, Gurusamy N, Ogorek B, et al. Myocyte turnover in the aging human heart. Circ Res. 2010;107:1374–86. doi: 10.1161/CIRCRESAHA.110.231498. [DOI] [PubMed] [Google Scholar]
- 8.Lakatta EG. Cardiovascular regulatory mechanisms in advanced age. Physiol Rev. 1993;73:413–67. doi: 10.1152/physrev.1993.73.2.413. [DOI] [PubMed] [Google Scholar]
- 9.Pfeffer JM, Pfeffer MA, Fishbein MC, Frohlich ED. Cardiac function and morphology with aging in the spontaneously hypertensive rat. Am J Physiol. 1979;237:H461–8. doi: 10.1152/ajpheart.1979.237.4.H461. [DOI] [PubMed] [Google Scholar]
- 10.Eghbali M, Robinson TF, Seifter S, Blumenfeld OO. Collagen accumulation in heart ventricles as a function of growth and aging. Cardiovasc Res. 1989;23:723–9. doi: 10.1093/cvr/23.8.723. [DOI] [PubMed] [Google Scholar]
- 11.Pfeffer MA, Pfeffer JM, Frohlich ED. Pumping ability of the hyper-trophying left ventricle of the spontaneously hypertensive rat. Circ Res. 1976;38:423–9. doi: 10.1161/01.res.38.5.423. [DOI] [PubMed] [Google Scholar]
- 12.Kim RJ, Wu E, Rafael A, et al. The use of contrast-enhanced magnetic resonance imaging to identify reversible myocardial dysfunction. N Engl J Med. 2000;343:1445–53. doi: 10.1056/NEJM200011163432003. [DOI] [PubMed] [Google Scholar]
- 13.Simonetti OP, Kim RJ, Fieno DS, et al. An improved MR imaging technique for the visualization of myocardial infarction. Radiology. 2001;218:215–23. doi: 10.1148/radiology.218.1.r01ja50215. [DOI] [PubMed] [Google Scholar]
- 14.Wu KC, Lima JA. Noninvasive imaging of myocardial viability: current techniques and future developments. Circ Res. 2003;93:1146–58. doi: 10.1161/01.RES.0000103863.40055.E8. [DOI] [PubMed] [Google Scholar]
- 15.Mewton N, Liu CY, Croisille P, Bluemke D, Lima JA. Assessment of myocardial fibrosis with cardiovascular magnetic resonance. J Am Coll Cardiol. 2011;57:891–903. doi: 10.1016/j.jacc.2010.11.013. [DOI] [PMC free article] [PubMed] [Google Scholar]
- 16.Iles L, Pfluger H, Phrommintikul A, et al. Evaluation of diffuse myocardial fibrosis in heart failure with cardiac magnetic resonance contrast-enhanced T1 mapping. J Am Coll Cardiol. 2008;52:1574–80. doi: 10.1016/j.jacc.2008.06.049. [DOI] [PubMed] [Google Scholar]
- 17.Messroghli DR, Radjenovic A, Kozerke S, Higgins DM, Sivananthan MU, Ridgway JP. Modified Look-Locker inversion recovery (MOLLI) for high-resolution T1 mapping of the heart. Magn Reson Med. 2004;52:141–6. doi: 10.1002/mrm.20110. [DOI] [PubMed] [Google Scholar]
- 18.Song T, Stainsby JA, Ho VB, Hood MN, Slavin GS. Flexible cardiac T1 mapping using a modified look-locker acquisition with saturation recovery. Magn Reson Med. 2012;67:622–7. doi: 10.1002/mrm.24137. [DOI] [PubMed] [Google Scholar]
- 19.Flett AS, Hayward MP, Ashworth MT, et al. Equilibrium contrast cardiovascular magnetic resonance for the measurement of diffuse myocardial fibrosis: preliminary validation in humans. Circulation. 2010;122:138–44. doi: 10.1161/CIRCULATIONAHA.109.930636. [DOI] [PubMed] [Google Scholar]
- 20.Messroghli DR, Bainbridge GJ, Alfakih K, et al. Assessment of regional left ventricular function: accuracy and reproducibility of positioning standard short-axis sections in cardiac MR imaging. Radiology. 2005;235:229–36. doi: 10.1148/radiol.2351040249. [DOI] [PubMed] [Google Scholar]
- 21.Messroghli DR, Niendorf T, Schulz-Menger J, Dietz R, Friedrich MG. T1 mapping in patients with acute myocardial infarction. J Cardiovasc Magn Reson. 2003;5:353–9. doi: 10.1081/jcmr-120019418. [DOI] [PubMed] [Google Scholar]
- 22.Messroghli DR, Plein S, Higgins DM, et al. Human myocardium: single-breath-hold MR T1 mapping with high spatial resolution—reproducibility study. Radiology. 2006;238:1004–12. doi: 10.1148/radiol.2382041903. [DOI] [PubMed] [Google Scholar]
- 23.Messroghli DR, Walters K, Plein S, et al. Myocardial T1 mapping: application to patients with acute and chronic myocardial infarction. Magn Reson Med. 2007;58:34–40. doi: 10.1002/mrm.21272. [DOI] [PubMed] [Google Scholar]
- 24.Bild DE, Bluemke DA, Burke GL, et al. Multi-Ethnic Study of Atherosclerosis: objectives and design. Am J Epidemiol. 2002;156:871–81. doi: 10.1093/aje/kwf113. [DOI] [PubMed] [Google Scholar]
- 25.Schelbert EB, Testa SM, Meier CG, et al. Myocardial extravascular extracellular volume fraction measurement by gadolinium cardiovascular magnetic resonance in humans: slow infusion versus bolus. J Cardiovasc Magn Reson. 2011;13:16. doi: 10.1186/1532-429X-13-16. [DOI] [PMC free article] [PubMed] [Google Scholar]
- 26.Ugander M, Oki AJ, Hsu LY, et al. Extracellular volume imaging by magnetic resonance imaging provides insights into overt and sub-clinical myocardial pathology. Eur Heart J. 2012;33:1268–78. doi: 10.1093/eurheartj/ehr481. [DOI] [PMC free article] [PubMed] [Google Scholar]
- 27.Wilson PW, D’Agostino RB, Levy D, Belanger AM, Silbershatz H, Kannel WB. Prediction of coronary heart disease using risk factor categories. Circulation. 1998;97:1837–47. doi: 10.1161/01.cir.97.18.1837. [DOI] [PubMed] [Google Scholar]
- 28.Grundy SM, Brewer HB, Jr., Cleeman JI, Smith SC, Jr., Lenfant C. Definition of metabolic syndrome: report of the National Heart, Lung, and Blood Institute/American Heart Association conference on scientific issues related to definition. Circulation. 2004;109:433–8. doi: 10.1161/01.CIR.0000111245.75752.C6. [DOI] [PubMed] [Google Scholar]
- 29.Mirsky I, Pfeffer JM, Pfeffer MA, Braunwald E. The contractile state as the major determinant in the evolution of left ventricular dysfunction in the spontaneously hypertensive rat. Circ Res. 1983;53:767–78. doi: 10.1161/01.res.53.6.767. [DOI] [PubMed] [Google Scholar]
- 30.From AM, Maleszewski JJ, Rihal CS. Current status of endomyocardial biopsy. Mayo Clin Proc. 2011;86:1095–102. doi: 10.4065/mcp.2011.0296. [DOI] [PMC free article] [PubMed] [Google Scholar]
- 31.Dall’Armellina E, Piechnik SK, Ferreira VM, et al. Cardiovascular magnetic resonance by non contrast T1-mapping allows assessment of severity of injury in acute myocardial infarction. J Cardiovasc Magn Reson. 2012;14:15. doi: 10.1186/1532-429X-14-15. [DOI] [PMC free article] [PubMed] [Google Scholar]
- 32.Ferreira VM, Piechnik SK, Dall’armellina E, et al. Non-contrast T1-mapping detects acute myocardial edema with high diagnostic accuracy: a comparison to T2-weighted cardiovascular magnetic resonance. J Cardiovasc Magn Reson. 2012;14:42. doi: 10.1186/1532-429X-14-42. [DOI] [PMC free article] [PubMed] [Google Scholar]
- 33.Piechnik SK, Ferreira VM, Lewandowski AJ, et al. Age and gender dependence of pre-contrast T1-relaxation times in normal human myocardium at 1.5T using ShMOLLI. J Cardiovasc Magn Reson. 2012;14:221. [Google Scholar]
- 34.Konhilas JP, Leinwand LA. The effects of biological sex and diet on the development of heart failure. Circulation. 2007;116:2747–59. doi: 10.1161/CIRCULATIONAHA.106.672006. [DOI] [PubMed] [Google Scholar]
- 35.Masoudi FA, Havranek EP, Smith G, et al. Gender, age, and heart failure with preserved left ventricular systolic function. J Am Coll Cardiol. 2003;41:217–23. doi: 10.1016/s0735-1097(02)02696-7. [DOI] [PubMed] [Google Scholar]
- 36.Olivetti G, Giordano G, Corradi D, et al. Gender differences and aging: effects on the human heart. J Am Coll Cardiol. 1995;26:1068–79. doi: 10.1016/0735-1097(95)00282-8. [DOI] [PubMed] [Google Scholar]
- 37.Cheng S, Fernandes VR, Bluemke DA, McClelland RL, Kronmal RA, Lima JA. Age-related left ventricular remodeling and associated risk for cardiovascular outcomes: the Multi-Ethnic Study of Atherosclerosis. Circ Cardiovasc Imaging. 2009;2:191–8. doi: 10.1161/CIRCIMAGING.108.819938. [DOI] [PMC free article] [PubMed] [Google Scholar]
- 38.Luczak ED, Leinwand LA. Sex-based cardiac physiology. Annu Rev Physiol. 2009;71:1–18. doi: 10.1146/annurev.physiol.010908.163156. [DOI] [PubMed] [Google Scholar]
- 39.Borlaug BA, Redfield MM. Diastolic and systolic heart failure are distinct phenotypes within the heart failure spectrum. Circulation. 2011;123:2006–13. doi: 10.1161/CIRCULATIONAHA.110.954388. [DOI] [PMC free article] [PubMed] [Google Scholar]
- 40.Scantlebury DC, Borlaug BA. Why are women more likely than men to develop heart failure with preserved ejection fraction? Curr Opin Cardiol. 2011;26:562–8. doi: 10.1097/HCO.0b013e32834b7faf. [DOI] [PubMed] [Google Scholar]
- 41.Sado DM, Flett AS, Banypersad SM, et al. Cardiovascular magnetic resonance measurement of myocardial extracellular volume in health and disease. Heart. 2012;98:1436–41. doi: 10.1136/heartjnl-2012-302346. [DOI] [PubMed] [Google Scholar]
- 42.Kawel N, Nacif M, Zavodni A, et al. T1 mapping of the myocardium: intra-individual assessment of post-contrast T1 time evolution and extracellular volume fraction at 3T for Gd-DTPA and Gd-BOPTA. J Cardiovasc Magn Reson. 2012;14:26. doi: 10.1186/1532-429X-14-26. [DOI] [PMC free article] [PubMed] [Google Scholar]
- 43.Sibley CT, Noureldin RA, Gai N, et al. T1 mapping in cardiomyopathy at cardiac MR: comparison with endomyocardial biopsy. Radiology. 2012;265:724–32. doi: 10.1148/radiol.12112721. [DOI] [PMC free article] [PubMed] [Google Scholar]
- 44.Gai N, Turkbey EB, Nazarian S, et al. T1 mapping of the gadolinium-enhanced myocardium: adjustment for factors affecting interpatient comparison. Magn Reson Med. 2011;65:1407–15. doi: 10.1002/mrm.22716. [DOI] [PMC free article] [PubMed] [Google Scholar]
- 45.Kawel N, Nacif M, Santini F, et al. Partition coefficients for gadolinium chelates in the normal myocardium: comparison of gadopentetate dimeglumine and gadobenate dimeglumine. J Magn Reson Imaging. 2012;36:733–7. doi: 10.1002/jmri.23651. [DOI] [PMC free article] [PubMed] [Google Scholar]
- 46.Kawel N, Nacif M, Zavodni A, et al. T1 mapping of the myocardium: intra-individual assessment of the effect of field strength, cardiac cycle and variation by myocardial region. J Cardiovasc Magn Reson. 2012;14:27. doi: 10.1186/1532-429X-14-27. [DOI] [PMC free article] [PubMed] [Google Scholar]
- 47.Lee JJ, Liu S, Nacif MS, et al. Myocardial T1 and extracellular volume fraction mapping at 3 tesla. J Cardiovasc Magn Reson. 2011;13:75. doi: 10.1186/1532-429X-13-75. [DOI] [PMC free article] [PubMed] [Google Scholar]