Abstract
In the present work we describe the principles of operation, versatility and applicability of a trapped ion mobility spectrometer (TIMS) analyzer for fast, gas-phase separation of molecular ions based on their size-to-charge ratio. Mobility-based separation using a TIMS device is shown for a series for isobar pairs. In a TIMS device, mobility resolution depends on the bath gas velocity and analysis scan speed, with the particularity that the mobility separation can be easily tuned from low to high resolution (R>50) in accordance with the analytical challenge. In contrast to traditional drift tube IMS analyzer, a TIMS device can be easily integrated in a mass spectrometer without a noticeable loss in ion transmission or sensitivity, thus providing a powerful separation platform prior to mass analysis.
Keywords: Radial focusing, Ion trapping, Mobility separation
Introduction
Over the last decades, there has been an increasing use of Ion Mobility Spectrometry (IMS) for a wide variety of applications (e.g., see review [1]). This is partially caused by the developments of new types of IMS analyzers (e.g., periodic focusing DC ion guide, [2, 3] segmented quadrupole drift cell, [4] multistage IMS, [5] field asymmetric IMS [6] and transient wave ion guide [7]). A common pursuit has been the increase in the mobility separation and ion transmission. Several groups have shown the advantage of coupling IMS to mass spectrometry (MS), thus achieving two dimensional separations based on the ion-neutral collision cross section (Ω/z) and the mass-to-charge, respectively [8–11]. In particular, IMS-MS has the capability of separating ions of different classes along characteristic mobility trend lines (e.g., fullerenes, peptides, nucleotides, lipids, etc.); the IMS-MS separation in chemical classes is of great utility in the analysis of complex mixtures in the field of proteomics, [12, 13] glycomics, [14] metabolomics [15] and petroleomics [16]. Further on, it has been shown that IMS-MS coupled with Collision Induced Dissociation (IMS-CID-MS) has the unique advantage that pre-selection of the parent ions is not necessary, since they are already separated in the IMS space [17, 18]. Combined with theoretical calculations of the conformational space of molecular ions, IMS permits the determination of candidate structures that give the best description of a given molecular system (e.g., electronic states, clusters, peptides, protein complexes) [19–21].
Several research groups have focused on achieving high resolution IMS separation (R>50) [22–25]. In this pursuit, radial ion diffusion and low conductances in the high-to-low pressure interface have been hindrances to guarantee high sensitivity, while maintaining the high mobility separation. Here, with a new approach, a Trapped Ion Mobility Spectrometer (TIMS) is described, which is capable of producing high resolution IMS separation that can be easily integrated into a mass spectrometer (MS) for IMS-MS analyses. The present paper will focus on the principles of operation, versatility and advantage of a TIMS device over traditional drift tube configurations. In particular, a series of examples showing the ability to distinguish molecular isobars will be shown.
Experimental methods
The concept behind TIMS is the use of an electric field to hold ions stationary against a moving gas, so that the drift force is compensated by the electric field and ion packages are separated based on their size-to-charge ratio. This concept follows the idea of a parallel flow ion mobility analyzer (see more details in [26, 27]), with the main difference that ions are also confined radially to guarantee higher ion transmission and sensitivity.
In the present work, the TIMS analyzer is incorporated into the ion funnel of a micrOTOF-Q™, quadrupole orthogonal time-of-flight mass spectrometer (Bruker Daltonics Inc., MA). The TIMS funnel is comprised of three main regions: the entrance funnel, the mobility analyzer section, and the exit funnel. The same RF (950 kHz and 200–400 Vpp) is applied to all electrodes including the entrance funnel, the mobility separating section, and the exit funnel. Each funnel electrode is divided into four electrically insulated segments, which are used to create a dipole field in the entrance and exit section to focus the ions downstream and a quadrupolar field in the separation region to radially confine the ions during the ion trapping and analsis. That is, in the entrance and exit region the RF between adjacent plates are 180° out phase, while in the analyzer region the RF phase only alternates between adjacent segments. Only the inner diameter and electrode spacing varies between the three sections from 20 to 8 to 1 mm in the entrance, analyzer, and exit region respectively.
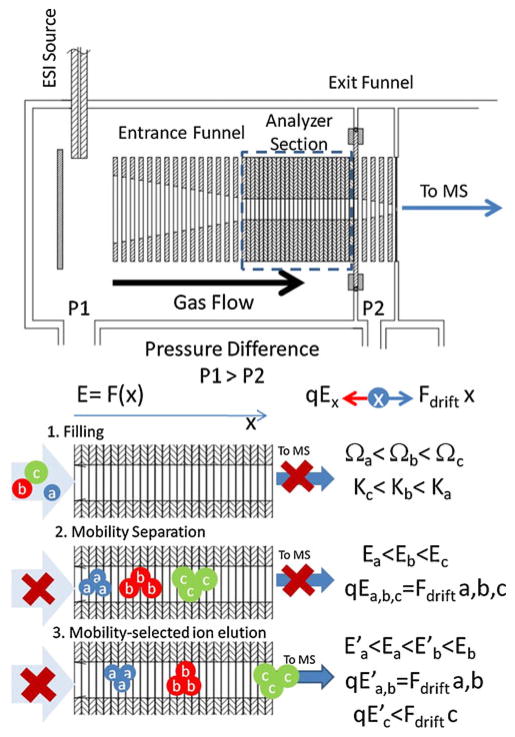
A simple schematic and operation sequence are shown in Fig. 1. Briefly, ions are generated using the Apollo II Electrospray Ion Source (Bruker Daltonics Inc., MA), and in a first step, are pushed through the entrance funnel and trapped in the mobility analyzer section. The weak electric field (E/p<10 Vcm−1 Torr−1) in the mobility separation section increases along the axial section while an RF applied to the electrodes confines the ions radially. Thus, the electric field compensates the gas drift force for a Ω/z range. Ions with Ω/z that are too large to be trapped will exit the analyzing section and are not considered in the separation. After ions are injected and thermalized (fill time), the electric field in the mobility separating section is slowly decreased (ramp time), and ions elute as a function of their mobility, from high to low Ω/z values. The axial electric field in the mobility analyzer section is define by the voltage difference between the entrance and exit electrodes (ΔVramp), where all intermediate electrodes are electrically connected through a resistive dividor that creates an increasing electric field across the analyzer axis.
Fig. 1.
Schematics of a TIMS device and operation. Ions are injected using a heated capillary orthogonal and focus towards the mobility separation section by ion funnel 1 (step 1, filling). Ion packages are separated as a function of their size-to charge ratio and will be trapped in regions where the drift force is compensated by the electric field force (step 2, separation). Noticed that the electric field increases along the device axis; i.e., ions with different size-to charge ratios are trapped at different axial positions. When the electric field is decreased, ions packages will elute from high to small size-to-charge ratios (step 3, elution)
Once ions elute from the mobility separation section, they pass through the exit funnel and on towards the QTOF mass analyzer. As the voltage on the mobility analyzer section is being ramped, the oTOF analyzer is used to acquire a series of mass spectra—one mass spectrum every 0.2 ms. Each of these mass spectra correspond to a given elution voltage in the voltage ramp and therefore to a specific ion mobility. After emptying the separation section, a new cycle starts. The results of several successive TIMS analyses may be co added in order to produce a statistically meaningful TIMS-MS spectrum.
The TIMS funnel was controlled using in-house software, written in National Instruments Lab VIEW, and synchronized with the micrOTOF-Q acquisition program. In particular, TIMS voltages were defined using National Instruments data acquisition cards (NI-PXI-6704, NI-PXI-6289, NI-PXI-6361) and a 1 GHz digitizer (NI-PXI-5154) was used for the MS data acquisition. Separation was performed using nitrogen as a bath gas at ca. 300 K and typical P1 and P2 values are 2.6–3.4 and 2.6 mbar, respectively. The difference between P1 and P2 defines the bath gas flow velocity (typically few m/s). P1 and P2 pressure values are achieved by varying the pumping impedance at P1 and P2 inlet/outlets with a butterfly-like valve.
Ion-neutral collision cross sections (CCS) were theoretically calculated for comparison purposes for the here separated model targets following the methodology described in ref [20]. Candidate structures were optimized and submitted to a series of annealing cycles to generate the total conformational space and CCS were calculated at the end of each cycle. In particular, CCS values were determined for helium as a bath gas and at a temperature of ca. 300 K using the MOBCAL software [28, 29].
Sample material used in this study were purchased from Sigma (St. Louis, MO) and used as received. Samples were dissolved in a 1:1 (v/v) water/methanol solution at concentrations of 1–10 μmolar. Solutions were infused at a rate of 3 μl/min using a conventional pneumatically assisted ESI sprayer.
Results and discussion
The separation in a TIMS device can be described in the center of mass frame using the same principles as in a conventional drift tube [30, 31]. That is, in conventional drift cells ions are pushed through a stationary gas whereas in the TIMS analyzer ions are held in place against a moving gas. Since mobility separation is related to the number of ion-neutral collisions (or drift time in traditional cells), the mobility separation in a TIMS device depends on the bath gas drift velocity, ion confinement and ion elution parameters. For example, the mobility range of analysis is directly related to the ratio of the gas velocity and the axial electric field range (ΔK=vg/ΔEx). The quadrupolar field in the analyzer section does not have any axial component; that is, the RF is responsible for keeping the ion radially confined and has little or no role in the mobility separation.
The TIMS funnel can be operated in “transmission” mode or in “IMS” mode. In transmission mode the DC potentials on all the funnel elements are set to continually push ions downstream—i.e. without a mobility separation. In transmission mode the analyzer entrance potential is set higher—i.e. more repulsive to the ions—than that of the analyzer exit. Similarly, the funnel entrance, and deflection plate are set to successively higher potentials when operating in transmission mode. In transmission mode ions elute continuously from the TIMS analyzer and MS spectra can be collected. In IMS mode, each MS spectrum is correlated to the elution voltage at which the ion package exits the TIMS analyzer. Mass spectra obtained in transmission mode, were similar in intensity and mass range to those obtained in the instrument with a conventional funnel.
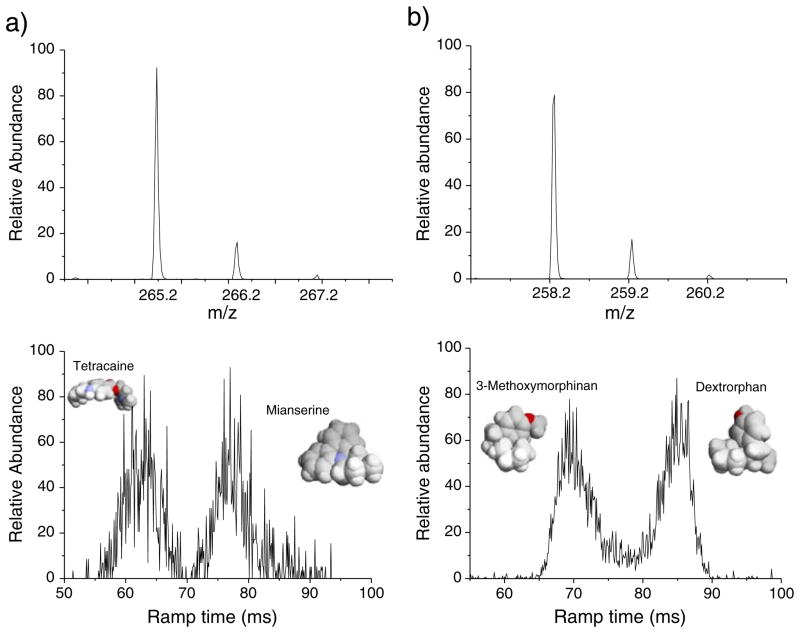
To illustrate the capabilities of a TIMS device, mobility separations were performed for a series of model isobar pairs. Figure 2 contains the mass spectra for Tetracain and Mianserin isobar pairs (Δm/z = 20 mDa) and 3-Methodymorphinam and Dextrorphan (Δm/z=0) isobar pairs. Theoretical calculations showed that larger mobility differences are expected between Tetracain (KHe = 4.68 cm2 V−1s−1) and Mianserin (KHe=5.74 cm2 V−1s−1) isobar pairs compared to 3-Methodymorphinam (KHe = 5.44 cm2 V−1s−1) and Dextrorphan (KHe=5.67 cm2 V−1s−1) isobar pairs (see 3D molecular representation in Fig. 2). Although the mobility separation varies with the bath gas type (helium vs nitrogen), a high mobility resolution is necessary to particularly separate the second pair. When mobility separation is performed, baseline mobility separation can be achieved with the TIMS analyzer when R>50 (e.g., R=52 and 55 for data shown in Fig. 2a and b, respectively).
Fig. 2.
ToF spectra and IMS profiles obtained using a TIMS device for isobar mixtures. a Tetracaine (C15H24N2O2, [M+H]+ m/z=265.183) and Mianserine (C18H20N2, [M+H]+ m/z=265.162), and b 3-Methodymorphinam(C17H23NO, [M+H]+ m/z=258.177) and Dextrorphan(C17H23NO, [M+H]+ m/z=258.177). Isotopic distributions are shown in the MS spectra (top) while baseline mobility separation is obtained (bottom). In the insets, representation of the isobar pairs 3D structure, color by the element type
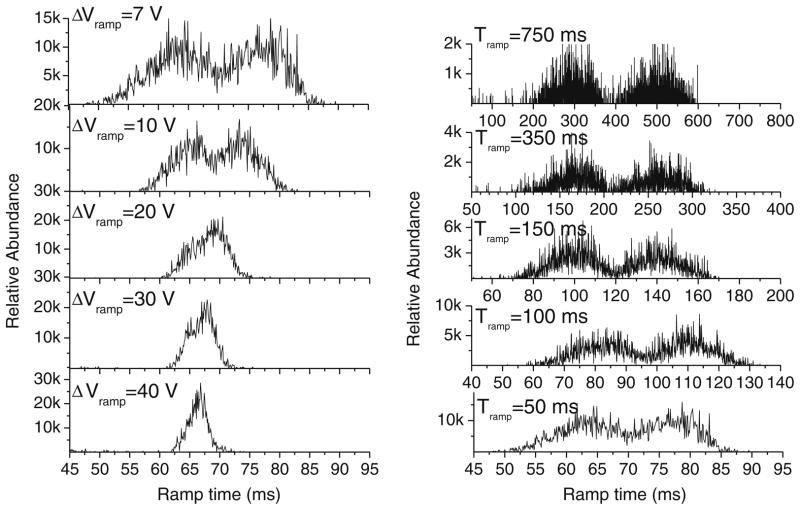
In a simplistic view, the mobility separation and resolution depends on the electric field increase (ramp rate) for a constant pressure drop (bath gas velocity). Figure 3 shows the variation of the mobility separation as a function of the ramp rate for the case of 3-Methodymorphinam and Dextrorphan (Δm/z=0) isobar pair. In the instrument, the potential at the exit of the analyzer section is held constant while that at the entrance is ramped. In these experiments, the ramp range (i.e. a starting and ending potential) and ramp duration are individually addressed. The ramp rate is thus set as a range divided by a duration. The mobility separation at a constant bath gas velocity is directly related to the ramp speed; that is, a decrease in the ramp speed leads to an increase in the mobility resolution. In practice, the mobility resolution can be increased by decreasing the ramp range (see Fig. 3a) and/or by increasing the ramp duration (see Fig. 3b).
Fig. 3.
Influence of the electric field ramp speed on the mobility separation for the case of 3-Methodymorphinam (left peak signal) and Dextrorphan(right peak signal). a Dependence on the ramp voltage range (ΔVramp) for a fixed ramp time (Tramp=50 ms and 0.1 ms step) and b Variation with Tramp for a fixed ΔVramp=7 Vand 0.1 ms step
In a TIMS device, the mobility resolution is defined as R = K/(ΔK =(Vout − Velution)/ΔV, where Velution and Vout are the potentials at the entrance and exit, respectively, of the analyzer at the time of elution and ΔV is the width of the peak at half height. Notice that the resolution equation indirectly depends on the bath gas velocity, i.e., the resolution is defined for a given field strength and a mobility value that is related to a bath gas velocity value. An increase in the velocity of the gas will lead to an increase in the mobility resolution. Experimental conditions (e.g., pumping impedance, electric breakdown of the bath gas, etc.) will in practice limit the maximum resolution that can be achieved. For experiments represented in Fig. 3a, as the potential difference across the analyzer section decreases from 40 V to 7 V for a fixed ramp time (50 ms and 500 ramp steps), the mobility resolution increases from 20 to 40, respectively. In Fig. 3b, while keeping a constant potential difference across the separation region (7 V), the increase in the ramp time from 50 to 750 ms resulted in an increase in mobility resolution from 40 to 70, respectively. A forthcoming paper will contain more detailed descriptions of the mobility resolution and ion transmission dependence on the bath gas velocity, electrodes geometry and applied RF.
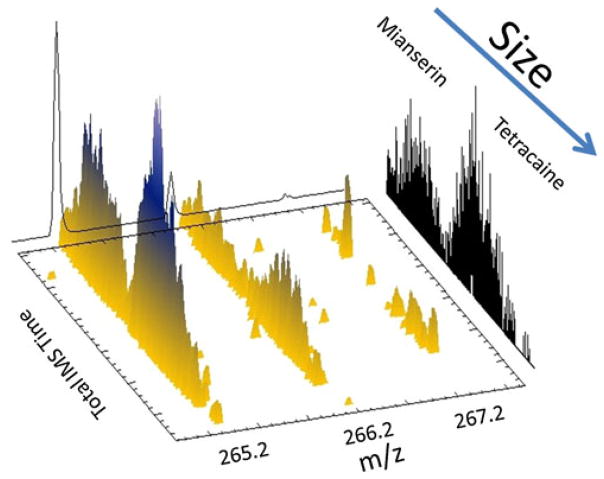
The TIMS device can be easily coupled to a MS analyzer. In the configuration used in the present paper, the mobility separation was complemented with MS by using the quadrupole and oToF analyzer of the micrOTOF-Q instrument. Mobility and mass are considered to be orthogonal to one another, leading to plots like the one in Fig. 4 [17, 18]. Fig. 4 shows a 3D- IMS—MS projection plot for the case of mianserin and tetracaine isobars. In the TIMS-oTOF coupling, the only limitation is that MS analysis has to be performed for each electric field step (elution voltage value) to guarantee that IMS separation is not compromised. Moreover, since TIMS separation is only electric field dependent (time-independent), ions transfer time between the TIMS exit and the oToF analyzer does not affect the mobility separation. In addition to simple IMS–MS experiments like that of Fig. 4, our TIMS-Q-OTOF instrument can be used to perform, for example, IMS-CID-MS or IMS-MS-CID-MS experiments.
Fig. 4.
3D-IMS-MS projection plots for Mianserin and Tetracaine separation in a TIMS-oToF instrument. Notice the mobility separation for the different isotopes
Conclusions
The use of a TIMS device for fast, gas-phase separation is demonstrated for a series of molecular isobar pairs. A mobility resolution of more than 50 was demonstrated in a device of less than 10 cm length. Results showed that the mobility resolution is inversely dependent on the mobility separation ramp speed. TIMS-MS coupling provides a powerful separation platform, where the mobility separation is not time dependent but rather is dependent on the elution potential. Thus, the TIMS mobility analysis can be tailored for resolution and mobility range as a function of the application.
Acknowledgments
This work was supported by the National Institute of Health (Grant No. 1K99RR030188-01) and a 2010&2011 Bruker Daltonics, Inc. Fellowship.
Contributor Information
Francisco Fernandez-Lima, Email: ffernandez@chem.tamu.edu, Department of Chemistry, Texas A&M University, MS 3144, College Station, TX 77843–3144, USA.
Desmond A. Kaplan, Bruker Daltonics, Inc., Billerica, MA, USA
J. Suetering, Bruker Daltonik gmbH, Bremen, Germany
Melvin A. Park, Bruker Daltonics, Inc., Billerica, MA, USA
References
- 1.Kanu AB, Dwivedi P, Tam M, Matz L, Hill HH. Ion mobility–mass spectrometry. J Mass Spectrom. 2008;43:1. doi: 10.1002/jms.1383. [DOI] [PubMed] [Google Scholar]
- 2.Gillig KJ, Russell DH. Int Appl WO0165589. The Texas A & M University System; 2001. In Patent cooperation treaty; p. 36. [Google Scholar]
- 3.Gillig KJ, Ruotolo BT, Stone EG, Russell DH. An electrostatic focusing ion guide for ion mobility-mass spectrometry. Int J Mass Spectrom. 2004;239:43. [Google Scholar]
- 4.Guo Y, Wang J, Javahery G, Thomson BA, Siu KWM. Ion mobility spectrometer with radial collisional focusing. Anal Chem. 2004;77:266. doi: 10.1021/ac048974n. [DOI] [PubMed] [Google Scholar]
- 5.Koeniger SL, Merenbloom SI, Valentine SJ, Jarrold MF, Udseth HR, Smith RD, Clemmer DE. An IMS-IMS analogue of MS-MS. Anal Chem. 2006;78:4161. doi: 10.1021/ac051060w. [DOI] [PubMed] [Google Scholar]
- 6.Kolakowski BM, Mester Z. Review of applications of high-field asymmetric waveform ion mobility spectrometry (FAIMS) and differential mobility spectrometry (DMS) Analyst. 2007;132:842. doi: 10.1039/b706039d. [DOI] [PubMed] [Google Scholar]
- 7.Pringle SD, Giles K, Wildgoose JL, Williams JP, Slade SE, Thalassinos K, Bateman RH, Bowers MT, Scrivens JH. An investigation of the mobility separation of some peptide and protein ions using a new hybrid quadrupole/travelling wave IMS/oa-ToF instrument. Int J Mass Spectrom Ion Process. 2007;261:1. [Google Scholar]
- 8.Kemper PR, Bowers MT. A hybrid double-focusing mass spectrometer–high-pressure drift reaction cell to study thermal energy reactions of mass-selected ions. J Am Soc Mass Spectrom. 1990;1:197. [Google Scholar]
- 9.Wu C, Siems WF, Asbury GR, Hill HH. Electrospray ionization high-resolution ion mobility spectrometry–mass spectrometry. Anal Chem. 1998;70:4929. doi: 10.1021/ac980414z. [DOI] [PubMed] [Google Scholar]
- 10.Liu Y, Clemmer DE. Characterizing oligosaccharides using injected-ion mobility/mass spectrometry. Anal Chem. 1997;69:2504. doi: 10.1021/ac9701344. [DOI] [PubMed] [Google Scholar]
- 11.Jarrold MF, Constant VA. Silicon cluster ions: evidence for a structural transition. Phys Rev Lett. 1991;67:2994. doi: 10.1103/PhysRevLett.67.2994. [DOI] [PubMed] [Google Scholar]
- 12.McLean JA, Ruotolo BT, Gillig KJ, Russell DH. Ion mobility-mass spectrometry: a new paradigm for proteomics. Int J Mass Spectrom. 2005;240:301. [Google Scholar]
- 13.Liu X, Valentine SJ, Plasencia MD, Trimpin S, Naylor S, Clemmer DE. Mapping the human plasma proteome by SCX-LC-IMS-MS. J Am Soc Mass Spectrom. 2007;18:1249. doi: 10.1016/j.jasms.2007.04.012. [DOI] [PMC free article] [PubMed] [Google Scholar]
- 14.Hoaglund CS, Valentine SJ, Clemmer DE. An Ion trap interface for ESI–ion mobility experiments. Anal Chem. 1997;69:4156. [Google Scholar]
- 15.Dwivedi P, Wu P, Klopsch S, Puzon G, Xun L, Hill H. Metabolic profiling by ion mobility mass spectrometry (IMMS) Metabolomics. 2008;4:63. [Google Scholar]
- 16.Fernandez-Lima FA, Becker C, McKenna AM, Rodgers RP, Marshall AG, Russell DH. Petroleum crude oil characterization by IMS–MS and FTICR MS. Anal Chem. 2009;81:9941. doi: 10.1021/ac901594f. [DOI] [PubMed] [Google Scholar]
- 17.Fernandez-Lima FA, Becker C, Gillig KJ, Russell WK, Tichy SE, Russell DH. Ion mobility-mass spectrometer interface for collisional activation of mobility separated ions. Anal Chem. 2009;81:618. doi: 10.1021/ac801919n. [DOI] [PubMed] [Google Scholar]
- 18.Hoaglund-Hyzer CS, Lee YJ, Counterman AE, Clemmer DE. Coupling ion mobility separations, collisional activation techniques, and multiple stages of MS for analysis of complex peptide mixtures. Anal Chem. 2002;74:992. doi: 10.1021/ac010837s. [DOI] [PubMed] [Google Scholar]
- 19.Fernandez-Lima FA, Becker C, Gillig K, Russell WK, Nascimento MAC, Russell DH. Experimental and theoretical studies of (CsI)nCs+cluster ions produced by 355 nm laser desorption ionization. J Phys Chem A. 2008;112:11061. doi: 10.1021/jp8047086. [DOI] [PubMed] [Google Scholar]
- 20.Fernandez-Lima FA, Wei H, Gao YQ, Russell DH. On the structure elucidation using IMS and molecular dynamics. J Phys Chem A. 2009;113:8221. doi: 10.1021/jp811150q. [DOI] [PubMed] [Google Scholar]
- 21.Fernandez-Lima FA, Blase RC, Russell DH. A study of ion-neutral collision cross-section values for low charge states of peptides, proteins, and peptide/protein complexes. Int J Mass Spectrom Ion Process. 2010;298:111. doi: 10.1016/j.ijms.2009.10.009. [DOI] [PMC free article] [PubMed] [Google Scholar]
- 22.Dugourd P, Hudgins RR, Clemmer DE, Jarrold MF. High-resolution ion mobility measurements. Rev Sci Instrum. 1997;68:1122. [Google Scholar]
- 23.Merenbloom SI, Glaskin RS, Henson ZB, Clemmer DE. High-resolution ion cyclotron mobility spectrometry. Anal Chem. 2009;81:1482. doi: 10.1021/ac801880a. [DOI] [PMC free article] [PubMed] [Google Scholar]
- 24.Kemper PR, Dupuis NF, Bowers MT. A new, higher resolution, ion mobility mass spectrometer. Int J Mass Spectrom Ion Process. 2009;287:46. [Google Scholar]
- 25.Blase RC, Silveira JA, Gillig KJ, Gamage CM, Russell DH. Increased ion transmission in IMS: a high resolution, periodic-focusing DC ion guide ion mobility spectrometer. Int J Mass Spectrom Ion Process. 2011;301:166. [Google Scholar]
- 26.Zeleny J. On the ratio of velocities of the two ions produced in gases by Röngten radiation, and on some related phenomena. Philos Mag. 1898;46:120. [Google Scholar]
- 27.Park MA (2010) Vol. 7838826, Bruker Daltonics, Inc. (Billerica, MA, US), United States
- 28.Mesleh MF, Hunter JM, Shvartsburg AA, Schatz GC, Jarrold MF. Structural information from ion mobility measurements: effects of the long-range potential. J Phys Chem. 1996;100:16082. [Google Scholar]
- 29.Shvartsburg AA, Jarrold MF. An exact hard-spheres scattering model for the mobilities of polyatomic ions. Chem Phys Lett. 1996;261:86. [Google Scholar]
- 30.McDaniel EW, Mason EA. Mobility and diffusion of ions in gases. Wiley; New York: 1973. [Google Scholar]
- 31.Viehland LA, Mason EA. Gaseous lon mobility in electric fields of arbitrary strength. Ann Phys. 1975;91:499. [Google Scholar]


