

Abstract
The RAG1/RAG2 endonuclease ("RAG") initiates the V(D)J recombination reaction that assembles Ig heavy (IgH) and light (IgL) chain variable region exons from germline gene segments to generate primary antibody repertoires1. IgH V(D)J assembly occurs in progenitor (pro-) B cells followed by that of IgL in precursor (pre-) B cells. Expression of IgH μ and IgL (Igκ or Igλ) chains generates IgM, which is expressed on immature B cells as the B cell antigen-binding receptor ("BCR"). Rag expression can continue in immature B cells2, allowing continued Igκ V(D)J recombination that replaces the initial VκJκ exon with one that generates a new specificity3–5. This “receptor editing” process, which also can lead to Igλ V(D)J recombination and expression3,6,7, provides a mechanism whereby antigen-encounter at the Rag-expressing immature B cell stage helps shape pre-immune BCR repertoires. As the major site of post-natal B cell development, the bone marrow is the principal location of primary Ig repertoire diversification in mice. Here, we report that early B cell development also occurs within the mouse intestinal lamina propria (LP), where the associated V(D)J recombination/receptor editing processes modulate primary LP Ig repertoires. At weanling age in normally housed mice, the LP contains a population of Rag-expressing B lineage cells that harbor intermediates indicative of ongoing V(D)J recombination and which contain cells with pro-B, pre-B, and editing phenotypes. Consistent with LP-specific receptor editing, Rag-expressing LP B-lineage cells have similar VH repertoires, but significantly different Vκ repertoires, compared to those of Rag2-expressing BM counterparts. Moreover, colonization of germ-free mice leads to an increased ratio of Igλ-expressing versus Igκ-expressing B cells specifically in the LP. We conclude that B cell development occurs in the intestinal mucosa, where it is regulated by extra-cellular signals from commensal microbes that influence gut Ig repertoires.
Pre-immune Ig diversification occurs within the gut or gut associated structures in several vertebrate species, including sheep, rabbits, cattle, pigs and chicken8–10. In these species, cells harboring a limited RAG-mediated V(D)J repertoire migrate to gut-associated structures to undergo further diversification through somatic mutation and/or gene conversion to generate a full pre-immune Ig repertoire11. These examples raise the notion that the gut environment may provide some benefit to the process of primary Ig diversification. In this regard, commensal bacteria are required for primary antibody repertoire diversification in pigs and rabbits8,12, and may play an important role in stimulating this process in cattle, sheep and chickens shortly after birth11. In contrast to the above species, RAG-mediated V(D)J recombination is the major driver of pre-immune diversification in mice and humans. In this context, stimulated by our prior finding of mouse B-lineage tumors that arise in mesenteric lymph nodes from apparent receptor-editing B cells13,14, we hypothesized that B cell development might occur in the mouse gut and, thereby, allow Rag expression to diversify gut B cell pre-immune repertoires.
To test for RAG expression, we used our Rag2 reporter mice, which contain a functional Rag2-Gfp fusion gene within the endogenous Rag2 locus that provides Rag2 expression functionally equivalent to that of the endogenous Rag2 gene15,16. We employed flow cytometry to test for RAG2-GFP in lymphocytes from mesenteric lymph nodes (mLN), small intestinal (SI) lamina propria (LP), and intraepithelial lymphocytes (IEL) of 3 wk-old mice. Cells were gated on the CD19 pan-B lineage marker, and GFP was plotted against the B220 pan-B lineage marker. Staining with dual B cell markers was done to optimize true GFP signal over background auto-fluorescence, which in wild-type controls was approximately 0.1% (Fig. 1a). With this method, we found essentially no Rag2-expressing B lineage cells in the IEL and mLN (Fig. 1a). However, we did find a population of Rag2-expressing, CD19+ B220low cells within the LP that comprised approximately 3% of total CD19+ cells (Fig. 1a). Quantitative PCR revealed Rag1 and Rag2 expression in wild type small intestinal LP at a level of about 1–10% that of total bone marrow (BM), but little or no Rag1 or Rag2 expression in mLN or IEL cells (Supplementary Fig. 1), confirming the flow cytometry results found with the Rag2-Gfp reporter mice. Large intestinal LP contained GFP+ B lineage cells as well, but at a lower level compared to that in the SI LP (Supplementary Fig. 2). We did not find RAG2-GFP in Peyer’s patch B cells (Supplementary Fig. 3) or mucosal T cells (Supplementary Fig. 4).
Figure 1. Gut LP RAG2+ B Lineage Cells in Weanling Age Mice.

a, FACS plots of CD19+ cells from the indicated tissues taken from wild type (WT) (top) or homozygous Rag2-Gfp knock-in (bottom) mice. B220 expression is plotted against GFP fluorescence. Numbers denote percentage of CD19+ B220low RAG2-GFP+ cells. b–d, dot plots showing percentage of RAG2-GFP+ cells in listed tissues from indicated post-natal ages. Each point represents one mouse. Horizontal bars indicate mean values ± s.e.m. e, Immunohistochemistry of paraffin-embedded sections from bone marrow (BM) and small intestine (SI) stained with an anti-TdT antibody. Dark brown indicates TdT-reactivity.
We examined various stages of early post-natal development to determine if levels of RAG2+ B lineage cells in the gut LP change over time. The proportion of LP RAG2-GFP+ cells among total CD19+ cells was low (<0.5%) in the first week of life; however, after that it gradually increased with levels peaking at approximately 4% at age 18–23 days before decreasing to undetectable levels by post-natal day 35 (Fig. 1b). In contrast, the CD19+ B cell population of peripheral blood contained 20–40% RAG2-GFP+ cells during the first week of life, which then decreased over time to undetectable levels over the next 4 weeks (Fig. 1c). Similarly, RAG2-GFP+ cell levels in the spleen appeared highest (10–15%) in the first week of life before decreasing to undetectable levels (Fig. 1d). The finding of low (<0.5%) levels of RAG2-GFP+ cells in the gut LP in the first week of life, despite the presence of substantial proportions of RAG2-GFP+ cells in the peripheral blood and spleen suggests that the mechanism responsible for the later emergence of RAG2+ cells in the gut may not be due to non-specific dissemination driven by high levels of these cells in the blood. As RAG2+ LP B lineage cells do not express proteins known to promote gut lymphocyte tropism such as the α4β7 integrin or the CCR9 chemokine receptor (Supplementary Fig. 5), mechanisms underlying their appearance in the gut remain to be determined.
Sixteen days following intraperitoneal (i.p.) alum injection, RAG2-GFP+ cells accumulate in the peripheral blood and spleens of adult mice due to increased bone marrow output following initial alum-mediated bone marrow suppression17,18. To determine if the gut LP in adult mice maintains ability to support RAG2+ B lineage cells, we injected 4–6 month-old Rag2-Gfp mice with i.p. alum and examined gut tissues on day 16. Following alum injection, low levels of RAG2-GFP+ B lineage cells appeared in IEL, mLN and PP; however, the most striking accumulation was in the LP, where RAG2-GFP+ cells made up about 2.5% of total CD19+ cells (Supplementary Fig. 6a, b). Appearance of RAG+ B lineage cells in the spleen and blood following alum injection is mediated by tumor necrosis factor alpha (TNFα)19. To determine whether appearance of RAG+ B lineage cells in the small intestinal LP at weaning age is also TNFα-dependent, we measured LP Rag1 and Rag2 expression by qPCR in 3 wk-old Tnfα knock-out and WT control mice and found no differences (Supplementary Fig. 6c, d). Thus, the mechanism of gut LP RAG+ B lineage cell accumulation at weaning age appears distinct from that of peripheral RAG+ cell accumulation that occurs after alum immunization.
RAG-expressing B lineage cells in the BM comprise a heterogeneous population of early developmental subsets including pro-B, pre-B, and immature B cells undergoing receptor editing20. The expression patterns of Igμ and Igκ (which accounts for ~95% of mouse IgL) can be used to distinguish these groups5,21. In this context, productive assembly of Igh V(D)J exons in pro-B cells leads to the cytoplasmic Igμ+ pre-B cell stage21. Assembly of Igκ VJ exons in pre-B cells leads to formation of IgM and differentiation to the surface IgM+ immature B cell stage. Rag-expressing cells with cytoplasmic Igκ and low or absent surface IgM have been defined as immature B cells undergoing receptor editing2,5,17. Staining of fixed/permeabilized CD19+ B220low RAG2-GFP+ LP B cells for cytoplasmic Igμ and Igκ revealed similar relative levels of pro-B cells (Igμ−, Igκ−), pre-B cells (Igμ+, Igκ−) and editing B cells (Igμ+, Igκ+, RAG2+), respectively, to those of the BM (Fig. 2a and Supplementary Fig. 7). Live CD19+ B220low RAG2-GFP+ LP B cells that were surface IgM+ also had similarly low IgM levels to those of this putative editing B-lineage subset in BM (Fig. 2a and Supplementary Fig. 7). In addition, ligation-mediated qPCR further showed that sorted RAG2-GFP+ LP B cells had a similar level of RAG-dependent DNA double-strand breaks at Jκ as RAG2-GFP+ BM B lineage cells (Fig. 2b), demonstrating that Igκ V(D)J recombination takes place in the RAG2+ LP B cells at levels similar to that in RAG2+ BM B lineage cells. Finally, microarray analysis of RAG2+ B lineage cells in weanling age gut LP revealed no significant differences in general transcript expression profiles in RAG2+ LP and RAG2+ BM B lineage cells (Supplementary Fig. 8), demonstrating a strong similarity between RAG2+ cells in these two sites. Overall, these data indicate that the LP Rag2-expressing B lineage cells contain early B lineage developmental subsets representative of those found in the BM, supporting the occurrence of B cell development in the LP.
Figure 2. RAG2-GFP+ LP B lineage developmental subsets.

a, Plots show the relative percentage Rag2-expressing pro-B cells, pre-B cells, editing B cells and surface IgM+ B cells (see text for definition of each) in the bone marrow (blue bars) and lamina propria (red bars). Plotted are mean values ± s.e.m. and each are derived from experiments of 4 independent mice at post-natal day 17–24 (see Supplementary Fig. 7 for more details). b, Plots show quantitative ligation-mediated PCR of RAG2+ BM B cells and RAG2+ LP B cells normalized to genomic DNA. BM cells from RAG2−/− mice were a negative control. Values on the y-axis are units relative to the signal obtained from a RAG2+ BM B cell samples.
We performed immunohistochemistry (IHC) to confirm the LP localization of early B lineage cells in mice at post-natal day 18–23. The terminal deoxynucleotidyl transferase (TdT) enzyme is present in pro-B cells and mediates addition of random nucleotides to IgH V(D)J DNA ends during V(D)J recombination to increase IgH V(D)J junctional diversity22. Staining for TdT, which is expressed similarly in BM and LP RAG2+ B lineage cells (Supplementary Fig. 8), revealed a dense nuclear expression pattern (brown) in SI LP cells similar to TdT+ cells in the bone marrow (BM) (Fig. 1e). SI sections were also subjected to dual staining for B220 plus TdT, which showed that the TdT+ cells were also faintly B220-positive, analogous to TdT+ cells in the BM (Supplementary Fig. 9). There were also cells in the SI lamina propria that stained strongly for B220 but were TdT−, representing more mature B cell populations (Supplementary Fig. 9, black arrows). TdT+ cells were distributed throughout the LP, including within villi; however, they generally appeared to be more proximal to bases of villi, closer to the serosal (antiluminal) intestinal surface compared to B220high TdT− B cells (Supplementary Fig. 10). These data indicate that gut-resident early B lineage cells inhabit a generally distinct location within the LP compared to more mature B cells. IHC studies of human fetal intestine also identified serosally-positioned pre-B cells in the intestinal LP, suggesting similar early B cell development may occur in the human gut23.
Given our finding of primary B cell development in the mouse intestinal LP, we asked whether this process contributes to differential diversification of pre-immune repertoires in developing RAG2+ LP B lineage cells versus those from BM. To test this, we isolated RNA from sorted RAG2-GFP+ cells from the BM and LP (Supplementary Fig. 11) of 3 week-old Rag2-Gfp mice, and assessed productive VH and Vκ utilization via 5’ rapid amplification of cDNA ends (5’RACE) generated from mature Ig gene transcripts, followed by 454 sequencing. To best visualize potential V segment utilization differences between RAG2-GFP+ cells from LP versus BM, we plotted V segment utilization from the two sources against individual in-frame V segments in the order of highest to lowest utilization in RAG2-GFP+ BM cells (Fig. 3, Supplementary Fig. 12). These studies showed that VH usage was very similar in RAG2-GFP+ LP cells and RAG2-GFP+ BM cells (χ2 test, p=0.235) (Fig. 3a, Supplementary Fig. 12a). As a positive control for the method, comparison of VH usage between RAG2+ BM and total non-sorted splenic B cells showed an expected highly significant difference (χ2 test, P=2.2×10⁻¹⁶) (Supplementary Figure 13a). The similar VH repertoires of RAG2+ BM and LP B lineage cells suggests that VH utilization during primary IgH V(D)J recombination occurs similarly in the two locations. In contrast, we observed prominent and highly significant differences in Vκ usage in RAG2-GFP+ cells from LP versus BM (χ2 test, P=0.00084) (Fig. 3b, Supplementary Fig. 12b); as a negative control, we observed no significant overall differences in Vκ usage between RAG2+ BM samples compared with other RAG2+ BM samples; or RAG2+ LP samples compared with other RAG2+ LP samples from separate pools of mice (χ2 test, P=0.560 and 0.545, respectively) (Supplementary Figure 13b, c). The finding of different Vκ repertoires within RAG2+ LP and BM B lineage cells indicates that the LP versus BM location of B cell development may influence Vκ usage in developing B cells. In this regard, the very similar VH repertoires of LP and BM RAG2+ B lineage cell suggests that a likely explanation for the marked difference in the LP Vκ repertoires from those of BM is that they are generated in the RAG2+ receptor-editing LP B cell population.
Figure 3. Distinct Vκ segment usage in RAG2+ cells from BM versus LP.
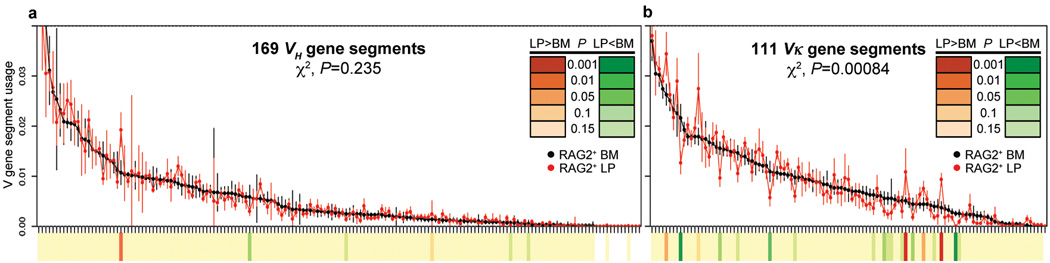
a,b, Dot plots show contributions (in order of highest to lowest BM utilization) of different VHs (a) and Vκs (b) to in-frame rearrangements in RAG2-GFP+ BM (black dots) and LP (red dots) cells. The two most highly utilized VHs are omitted to increase plot resolution. Each point shows mean ± s.e.m. of at least 4 experiments. The χ2 calculated P values for overall differences between BM and LP are indicated. Significant V segment utilization differences between BM and LP are indicated on heat map (P values scale indicated in inset). Full data set at increased resolution is in Supplementary Fig. 12.
Intestinal microflora have been shown to influence immune cell development in terms of lymphoid organization and T cell subset accumulation and activity, both locally in the gut as well as systemically24. To assess influences of microflora on B cell development, we co-housed 3 week-old WT Swiss-Webster germ-free mice with regular specific pathogen free (SPF) mice for 7 days. Gram staining of SI contents was performed to confirm bacterial colonization of co-housed mice (Supplementary Fig. 14). We employed qPCR to assay colonized mice and germ-free littermates for Rag1 and Rag2 expression, which was normalized to Cd19 expression. In accord with ability of microflora to induce systemic effects on immune cell development24, we observed colonization-dependent increases in Rag1 and Rag2 expression in the BM and spleen, as well as the gut LP (Supplementary Fig. 15). We also found pro-B cells (identified as CD19+ B220low CD43+) to represent an increased percentage of total CD19+ B cells in colonized mouse BM and LP, and potentially in the colonized spleen (Fig. 4a, Supplementary Fig. 16), correspondingly, the increased Rag expression in these tissues likely derives from the increased percentage of pro-B cells. We conclude that gut microflora induce increased levels of pro-B cells systemically, including in the gut LP, in previously un-colonized weaning-age mice.
Figure 4. Effects of Gut colonization on Development of LP B Lineage Cells.

a, Plots of percentage of pro-B cells versus total CD19+ B lineage cells from bone marrow (BM), spleen (SpL) and lamina propria (LP) of 4 wk-old germfree (GF) mice and littermates colonized (Col) by co-housing with serum pathogen free mice for 7 days. b, Bar graphs show ratios of Igλ+ versus Igκ+ B cells within mesenteric lymph nodes (mLN), inter-epithelial lymphocyes (IEL) and tissues indicated in (a) from GF and Col mice. Mean values and s.e.m are shown. The P values are indicated as: *P ≤ 0.05, **P ≤ 0.01, ***P ≤ 0.001. ns = not significant. (Details in Supplementary Fig. 16 and 17)
Given our finding of different Vκ repertoires in LP versus BM RAG2+ B lineage populations that might be generated via receptor editing, we examined the ratio of Igλ+ to Igκ+ B cells in the LP of colonized mice versus their germ-free mice littermates. In this regard, increased Igλ usage in the B cell repertoire is another marker of receptor editing3,6,7. Notably, colonization led to a significant and reproducible increase of the ratio of Igλ+ to Igκ+ B cells in the LP but not the BM or SPL (Fig. 4b and Supplementary Fig. 17), consistent with a commensal-dependent process leading to increased editing specifically within LP B cells. However, as these analyses were not performed in Rag2-Gfp mice, only total B cell populations could be analyzed. Therefore, a non-mutually exclusive possibility would be selection for Igλ+ B cells in the gut after colonization with commensal microbes, a phenomenon not previously described. In this regard, we do find significant differences in both VH and Vκ segment usage in the LP IgM+ B cell population of colonized mice compared to germ-free littermates (Supplementary Fig. 18), indicating presence of commensals influences both IgH and IgL mature B cell repertoires.
Consistent with growing evidence demonstrating that the microflora act as a regulators of T lymphocyte subsets24, we find that weanlings harbor an intestinal LP B cell developmental process that is influenced in germ-free mice by microbial colonization. As weaning is concurrent with microbial expansion25, occurrence of Rag-expressing B lineage cell accumulation in weanlings may have evolved to allow B cell primary repertoires to be modulated in response to colonization. In this regard, our findings also suggest that this LP B cell developmental process includes BCR editing, which may contribute to significant differences in the primary Vκ repertoire of LP versus BM B lineage populations. Past studies have implicated BCR editing in the BM as a negative selection process, largely based on studies of B cells engineered to make specific self-reactive, high affinity BCRs. Given the natural repertoire in our studies, the degree to which the observed BCR editing process in the gut represents a tolerance mechanism is unclear. However, given the potential special role of the gut in pre-immune diversification in other vertebrates, RAG-dependent editing in the LP may also contribute diversification-related roles. In addition, immature gut-derived B cells also may have specialized roles, such as those suggested for immature splenic B cells26. Finally, primary B cell development in the intestine, including mucosal B cell receptor editing, might allow both luminal antigens and peripheral host mucosal components opportunities to shape the pre-immune repertoire. In this regard, the transient nature of LP B cell development implies that there may be windows of opportunity for this influence to occur.
METHODS
Mice, Immunizations and Colonization
Mice harboring the Rag2-Gfp knock-in fusion gene at the endogenous locus were described previously15 and were maintained on a 129/SvJ background. Wild type Balb/c mice were purchased from Jackson Laboratories. Swiss-Webster germ-free mice were purchased from Taconic Farms. For each germ-free/colonization experiment, littermate germfree mice were used as controls. Germ-free status and colonization status were confirmed by gram staining of cecal and small intestinal contents as well as microbial culture. Immunization experiments were performed with alum as described18. All experiments with mice followed the protocols approved by the Boston Animal Care Facility of the Children’s Hospital, Boston, MA 02115.
Cell Isolation and Flow Cytometry
PP, IEL and LP lymphocytes were isolated essentially as described27. PPs were excised from the small intestine, and the remaining tissue was incubated with 1×Hank’s balanced salt solution with 1 mM EDTA/10% FBS/PBS for 30 min and room tempuratur three times for IEL extraction. Residual intestinal tissue was digested in 20% FBS RPMI with 0.05% collagenase from Clostridium histolyticum (Sigma) for 1 hr at 37 degrees Celsius three times. IELs and LP cells were centrifuged over Lympholyte (Cedar Lane) per manufacturer’s recommendations to minimize mucus contamination. Single-cell suspensions of mLNs, PPs and spleen were prepared by mashing through a cell strainer (70 µm). Cells were stained with fluorophore-conjugated mouse antibodies, and flow cytometry was performed.
Real-Time qPCR and Microarray Analysis
For quantitative PCR, total RNA was extracted using the TRIzol method (Invitrogen) and reverse transcribed into cDNA using qScript (Quanta Biosciences). Rag1 and Rag2 transcripts were then quantified using Taqman qPCR assays Mm01270936_m1 and Mm00501300_m1, respectively (Applied Biosystems). The comparative Ct method was used to quantify transcripts that were normalized with respect to Cd19 expression (Taqman assay Mm00515420_m1, Applied Biosystems). For comparative transcriptome analysis, B cells were isolated from BM and small intestinal LP of 3 wk-old mice. Cells were sorted (BD FACSAria) into TRIzol on the basis of the following cell surface markers: CD19+, B220low, GFP+. RNA was extracted and then amplified, labeled, and hybridized to Affymetrix GeneChip Mouse Gene 1.0 ST arrays (Expression Analysis, Durham, NC). Raw data were normalized with the RMA algorithm implemented in the Expression File Creator module from the GenePattern suite28. Data were visualized with the Multiplot and Hierarchical Clustering Viewer modules. All cell populations analyzed were generated in triplicate from independent experiments consisting of a pool of at least 8 mice for each experiment.
Immunohistochemistry
Immunohistochemistry was performed using 4-mm-thick formalin fixed paraffin embedded (FFPE) tissue sections. Slides were soaked in xylene, passed through graded alcohols, and put in distilled water. Slides were pretreated with EDTA (pH 8.0) retrieval solution (Zymed, South San Francisco, CA) in a steam pressure cooker (Biocare Decloaking Chamber CD2008US, Biocare Biomedical, Concord, CA) at manufacturers recommended settings. All further steps are performed at room temperature in a hydrate chamber. The slides were blocked for endogenous peroxidase activity with peroxidase block (DAKO), washed 5 minutes in buffer, and followed by 20 minute incubation with serum free protein block (DAKO). For TdT single staining, a polyclonal rabbit antibody (DAKO Cat #A3524) was applied at 1:100 dilution for 1 hour at room temperature followed by washing. The detection of antibody utilized DAKO Rabbit Envision and DAB according to the manufacturer's directions. For TdT/B220 double staining, rabbit anti-TDT was followed with Mach-2 Rabbit AP polymer (Biocare) and developed with Vulcan Fast Red (Biocare). Subsequently, rat anti-B220 (BD Pharmingen, cat # 550286), was applied for 1 hour at 1:200 dilution followed by Goat anti-Rat-HRP (Millipore) and developed with DAB. All slides were counterstained with Harris hematoxylin. Stained slides were scanned at 200× magnification using an Aperio ScanScope XT workstation (Aperio Technology, Inc., Vista, CA). Images were visualized, annotated, and microscopic distances quantified using ImageScope software (version 10.0.35.1800, Aperio Technology).
Ligation-mediated PCR
Sorted CD19+ B220low RAG2-GFP+ B lineage cells from BM and LP were lysed in SDS lysis buffer (5mM EDTA, 200mM NaCl, 100mM Tris-HCl pH 8.0, 0.2% SDS) with proteinase K (200mg/ml) overnight at room temperature followed by incubation at 37°C for one hour. Following DNA isolation by phenol:chloroform separation and isopropanol precipitation, blunt-end ligation reactions were performed using an oligonucleotide duplex linker consisting of BW-1 (5’ GCGGTGACCCGGGAGATCTGAATTC) and BW-2 (5’ GAATTCAGATC). DNA was ligated overnight at 16°C in ligation buffer (50mM Tris pH7.5, 10mM MgCl2, 10mM DTT, 1mM ATP) and T4 DNA ligase (Promega). Ligase was inactivated by incubation for 10 min at 70°C. Ligation reaction was diluted 1:3 in H2O prior to being used for PCR. Nested PCR was used to detect ligation products resulting from both Jκ1 and Jκ2 double stranded DNA breaks. The first round of amplification was performed using Qiagen Hot Star Taq (1.25U/rxn) and primers Ko3 (5’ AGTGCCACTAACTGCTGAGAAACCT) and BW-1H (5’ CCGGGAGATCTGAATTCCAC). The PCR reaction was performed as follows: 95°C for 15min, followed by 26 cycles of 94°C for 45 sec, 57°C for 45 sec and 72°C for 50 sec, followed by 72°C for 5 min. The second round of amplification was performed as quantitative PCR using primers Ko (5’ CCACGCATGCTTGGAGAGGGGGTT) and BW-1H primers with an internal Jk probe (5’ 56-FAM/ZEN-3-Iowa Black 5’ TGAGGAGGGTTTTTGTACAGCCAGA). Signals were normalized to actin amplified from genomic DNA (Mm00607939_s1). Each sample was calculated as a percent of a BM standard run on each PCR plate to determine variability within BM and LP samples from three biologic replicates isolated from independent pools of 4–8 mice per experiment.
Repertoire Sequencing
Total RNA was obtained from purified B cells using TRIzol reagents (Invitrogen). κ-chain and μ chain cDNAs from each sample were synthesized using a SMARTer™-RACE cDNA amplification kit (Clontech), according to the manufacturer’s protocol. Cμ-specific (5’-CAGGTGAAGGAAATGGTGCT) and Cκ-specific (5’-TTAACTGCTCACTGGATGGTG) primers were used in lieu of oligo dT primers for cDNA synthesis. A total of 0.05 to 0.2 µg total RNA/sample was used. PCR was performed using Phusion DNA Polymerase (Thermo Scientific) and 12.5 ml of first-strand reactions with long and short universal primers (CTAATACGACTCACTATAGGGCAAGCAGTGGTAACAACGCAGAGT and CTAATACGACTCACTATAGGGC) together with either a biotinylated round-1 Cμ primer (BIO 5’-CTTATCAGACAGGGGGCTCTC) or round-1 Cκ primer (BIO- 5’-TCACTGGATGGTGGGAAGAT) specific primers. First round PCR reaction conditions were then followed as described elswhere29. PCR round-1 product sizes of 500–700 bp were extracted from agarose gels using a QIAquick gel extraction kit (Qiagen), enriched on streptavidin-coupled Dynabeads (Invitrogen), and purified with a QIAquick PCR purification columns (Qiagen) per manufacturers instructions. Purified round-1 products were then subjected to a second round of PCR with nested primers containing “A” and “B” adapter sequences as well as distinct 10 bp barcode sequences (to distinguish source material) using the nested universal primer (5’-CGTATCGCCTCCCTCGCGCCATCAG[UNIQUE 10BP BARCODE SEQUENCE]ACGACTCACTATAGGGCAAGCAG) together with either nested Cμ primer (CTATGCGCCTTGCCAGCCCGCTCAG[UNIQUE 10BP BARCODE SEQUENCE]GGGAAGACATTTGGGAAGGA) or Cκ primer (CTATGCGCCTTGCCAGCCCGCTCAG[10 bp UNIQUE BARCODE SEQUENCE]TGGATGGTGGGAAGATGGAT). PCR products (size 500–700) were extracted from agarose gel, and 100 ng of each amplicon library was combined and used for 454 sequencing analysis. GS FLX Titanium sequencing kit XLR70 (Roche) was used for sample preparation. Data were collected at the sequencing core and at the University of Illinois. Data were analyzed using the empirical Bayes procedure as described30. Clonotypes and clone assignments were determined using a recursive set of hypothesis tests on the equality of the V-gene segment mutation rate and that of CDR3. To control for false detection rate, comparisons were made between the same tissues of repeat experiments of BM and LP Vκ samples (Supplementary Fig. 13). VH segment usage from RAG2+ BM was also compared to total splenic B cell VH segment usage to ensure that our analysis could identify the expected differences that occur due to selection between these populations.
Statistics
If not otherwise stated, data were expressed as arithmetic means ± s.e.m., and statistical analyses were made by unpaired t-test, exact test, or χ2 test where appropriate. P<0.05 was considered statistically significant.
Supplementary Material
Acknowledgements
This work was supported by National Institute of Health grants AI020047 (to F.W.A) and AI89972 (to D.R.W.), Lymphoma and Leukemia SCOR 7009-12 (to F.W.A.), and National Institutes of Health research contract HHSN272201000053C (to T.B.K). D.R.W. was also supported by an award from the American Academy of Allergy Asthma and Immunology and CSL-Behring and holds a Career Award for Medical Scientists from the Burroughs Wellcome Fund. F.W.A. is an Investigator of the Howard Hughes Medical Institute.
Footnotes
Author Contributions
D.R.W. and F.W.A. designed the study; D.R.W., A.J.P., M.P.G., K. C-J., J.M.M., and R.A.P. performed experiments;, R.M.M. and T.B.K performed computational analysis of sequencing data; S.R. performed immunohistochemistry experiments; D.R.W. and F.W.A. wrote the paper.
Competing financial interests
The authors declare no competing financial interests.
References
- 1.Jung D, Giallourakis C, Mostoslavsky R, Alt FW. Mechanism and control of V(D)J recombination at the immunoglobulin heavy chain locus. Annu Rev Immunol. 2006;24:541–570. doi: 10.1146/annurev.immunol.23.021704.115830. [DOI] [PubMed] [Google Scholar]
- 2.Yu W, et al. Continued RAG expression in late stages of B cell development and no apparent re-induction after immunization. Nature. 1999;400:682–687. doi: 10.1038/23287. [DOI] [PubMed] [Google Scholar]
- 3.Tiegs SL, Russell DM, Nemazee D. Receptor editing in self-reactive bone marrow B cells. J Exp Med. 1993;177:1009–1020. doi: 10.1084/jem.177.4.1009. [DOI] [PMC free article] [PubMed] [Google Scholar]
- 4.Gay D, Saunders T, Camper S, Weigert M. Receptor editing: an approach by autoreactive B cells to escape tolerance. J Exp Med. 1993;177:999–1008. doi: 10.1084/jem.177.4.999. [DOI] [PMC free article] [PubMed] [Google Scholar]
- 5.Pelanda R, et al. Receptor editing in a transgenic mouse model: site, efficiency, and role in B cell tolerance and antibody diversification. Immunity. 1997;7:765–775. doi: 10.1016/s1074-7613(00)80395-7. [DOI] [PubMed] [Google Scholar]
- 6.Retter MW, Nemazee D. Receptor editing occurs frequently during normal B cell development. J Exp Med. 1998;188:1231–1238. doi: 10.1084/jem.188.7.1231. [DOI] [PMC free article] [PubMed] [Google Scholar]
- 7.Hertz M, Nemazee D. BCR ligation induces receptor editing in IgM+IgD− bone marrow B cells in vitro. Immunity. 1997;6:429–436. doi: 10.1016/s1074-7613(00)80286-1. [DOI] [PubMed] [Google Scholar]
- 8.Lanning D, Zhu X, Zhai SK, Knight KL. Development of the antibody repertoire in rabbit: gut-associated lymphoid tissue, microbes, and selection. Immunol Rev. 2000;175:214–228. [PubMed] [Google Scholar]
- 9.Jenne CN, Kennedy LJ, Reynolds JD. Antibody repertoire development in the sheep. Dev Comp Immunol. 2006;30:165–174. doi: 10.1016/j.dci.2005.06.009. [DOI] [PubMed] [Google Scholar]
- 10.Ratcliffe MJ. Antibodies, immunoglobulin genes and the bursa of Fabricius in chicken B cell development. Dev Comp Immunol. 2006;30:101–118. doi: 10.1016/j.dci.2005.06.018. [DOI] [PubMed] [Google Scholar]
- 11.Lanning DK, Rhee KJ, Knight KL. Intestinal bacteria and development of the B-lymphocyte repertoire. Trends Immunol. 2005;26:419–425. doi: 10.1016/j.it.2005.06.001. [DOI] [PubMed] [Google Scholar]
- 12.Butler JE, et al. Antibody repertoire development in fetal and neonatal piglets. VIII. Colonization is required for newborn piglets to make serum antibodies to T-dependent and type 2 T-independent antigens. J Immunol. 2002;169:6822–6830. doi: 10.4049/jimmunol.169.12.6822. [DOI] [PubMed] [Google Scholar]
- 13.Wang JH, et al. Mechanisms promoting translocations in editing and switching peripheral B cells. Nature. 2009;460:231–236. doi: 10.1038/nature08159. [DOI] [PMC free article] [PubMed] [Google Scholar]
- 14.Wang JH, et al. Oncogenic transformation in the absence of Xrcc4 targets peripheral B cells that have undergone editing and switching. J Exp Med. 2008;205:3079–3090. doi: 10.1084/jem.20082271. [DOI] [PMC free article] [PubMed] [Google Scholar]
- 15.Monroe RJ, et al. RAG2:GFP knockin mice reveal novel aspects of RAG2 expression in primary and peripheral lymphoid tissues. Immunity. 1999;11:201–212. doi: 10.1016/s1074-7613(00)80095-3. [DOI] [PubMed] [Google Scholar]
- 16.Nagaoka H, Yu W, Nussenzweig MC. Regulation of RAG expression in developing lymphocytes. Curr Opin Immunol. 2000;12:187–190. doi: 10.1016/s0952-7915(99)00070-9. [DOI] [PubMed] [Google Scholar]
- 17.Nagaoka H, Gonzalez-Aseguinolaza G, Tsuji M, Nussenzweig MC. Immunization and infection change the number of recombination activating gene (RAG)-expressing B cells in the periphery by altering immature lymphocyte production. J Exp Med. 2000;191:2113–2120. doi: 10.1084/jem.191.12.2113. [DOI] [PMC free article] [PubMed] [Google Scholar]
- 18.Gartner F, Alt FW, Monroe RJ, Seidl KJ. Antigen-independent appearance of recombination activating gene (RAG)-positive bone marrow B cells in the spleens of immunized mice. J Exp Med. 2000;192:1745–1754. doi: 10.1084/jem.192.12.1745. [DOI] [PMC free article] [PubMed] [Google Scholar]
- 19.Ueda Y, Yang K, Foster SJ, Kondo M, Kelsoe G. Inflammation controls B lymphopoiesis by regulating chemokine CXCL12 expression. J Exp Med. 2004;199:47–58. doi: 10.1084/jem.20031104. [DOI] [PMC free article] [PubMed] [Google Scholar]
- 20.Jankovic M, Casellas R, Yannoutsos N, Wardemann H, Nussenzweig MC. RAGs and regulation of autoantibodies. Annu Rev Immunol. 2004;22:485–501. doi: 10.1146/annurev.immunol.22.012703.104707. [DOI] [PubMed] [Google Scholar]
- 21.Raff MC, Megson M, Owen JJ, Cooper MD. Early production of intracellular IgM by B-lymphocyte precursors in mouse. Nature. 1976;259:224–226. doi: 10.1038/259224a0. [DOI] [PubMed] [Google Scholar]
- 22.Desiderio SV, et al. Insertion of N regions into heavy-chain genes is correlated with expression of terminal deoxytransferase in B cells. Nature. 1984;311:752–755. doi: 10.1038/311752a0. [DOI] [PubMed] [Google Scholar]
- 23.Golby S, et al. B cell development and proliferation of mature B cells in human fetal intestine. J Leukoc Biol. 2002;72:279–284. [PubMed] [Google Scholar]
- 24.Hooper LV, Littman DR, Macpherson AJ. Interactions between the microbiota and the immune system. Science. 2012;336:1268–1273. doi: 10.1126/science.1223490. [DOI] [PMC free article] [PubMed] [Google Scholar]
- 25.Mackie RI, Sghir A, Gaskins HR. Developmental microbial ecology of the neonatal gastrointestinal tract. Am J Clin Nutr. 1999;69:1035S–1045S. doi: 10.1093/ajcn/69.5.1035s. [DOI] [PubMed] [Google Scholar]
- 26.Ueda Y, Liao D, Yang K, Patel A, Kelsoe G. T-independent activation-induced cytidine deaminase expression, class-switch recombination, and antibody production by immature/transitional 1 B cells. J Immunol. 2007;178:3593–3601. doi: 10.4049/jimmunol.178.6.3593. [DOI] [PMC free article] [PubMed] [Google Scholar]
- 27.Lefrancois L, Lycke N. Isolation of mouse small intestinal intraepithelial lymphocytes, Peyer's patch, and lamina propria cells. Curr Protoc Immunol. 2001;Chapter 3(Unit 3):19. doi: 10.1002/0471142735.im0319s17. [DOI] [PubMed] [Google Scholar]
- 28.Reich M, et al. GenePattern 2.0. Nat Genet. 2006;38:500–501. doi: 10.1038/ng0506-500. [DOI] [PubMed] [Google Scholar]
- 29.Warren RL, et al. Exhaustive T-cell repertoire sequencing of human peripheral blood samples reveals signatures of antigen selection and a directly measured repertoire size of at least 1 million clonotypes. Genome Res. 2011;21:790–797. doi: 10.1101/gr.115428.110. [DOI] [PMC free article] [PubMed] [Google Scholar]
- 30.Kepler TB. Reconstructing a B-cell clonal lineage. I. Statistical inference of unobserved ancestors [v1; ref status: indexed, http://f1000r.es/z6] F1000 Research. 2013;2:1–12. doi: 10.12688/f1000research.2-103.v1. [DOI] [PMC free article] [PubMed] [Google Scholar]
Associated Data
This section collects any data citations, data availability statements, or supplementary materials included in this article.