

Abstract
High-fat diet (HFD) induced obesity is associated with low-grade inflammation, insulin resistance (IR), and glucose intolerance. The objective of this study is to assess the effect of interleukin 10 (IL10), an anti-inflammatory cytokine, on blocking HFD-induced obesity and obesity-associated metabolic disorders by hydrodynamic delivery of IL10-containing plasmid. Animals fed a regular chow or HFD received two injections (one on day 1 and the other on day 31) of plasmids containing green fluorescence protein (GFP) or mouse IL10 (mIL10) gene. Blood concentration of mIL10 reached ~200 ng/ml on day 7 in animals receiving mIL10 plasmid DNA. The transfection efficiency of liver cells was the same in animals fed a regular chow or HFD. No difference was seen in animals on regular chow when injected with plasmids containing either gfp or mIL10 gene. Overexpression of mIL10 prevented weight gain of animals on HFD. Intraperitoneal glucose tolerance test (IPGTT) and insulin tolerance tests (ITT) showed that mIL10 maintained insulin sensitivity and prevented glucose intolerance. The mechanistic study reveals that mIL10 suppressed macrophage infiltration and reduced the development of crown-like structures in adipose tissue (AT). Collectively, these results suggest that maintaining a higher level of IL10 through gene transfer could be an effective strategy in preventing diet-induced obesity.
Introduction
The incidence of obesity has increased drastically in recent decades.1 According to the Centers for Disease Control, more than 65% adults in the United States are overweight, ~50% of whom are clinically obese (body mass index: >30 kg/m2).2 Obesity increases the risk of a number of health conditions including IR, hypertension, type 2 diabetes, fatty liver disease, atherosclerosis, degenerative disorders, airway disease, and some cancers.3 This cluster of pathologies has also started to emerge in children at young age,4 a phenomenon that was inconceivable only a few decades ago. There are currently a few drugs available in clinic for the prevention or treatment of obesity-associated diseases.5 The safety issues and side effects are still outstanding concerns with most of these drugs.5 Therefore, there is an urgent need for new approaches to address obesity and obesity-associated complications.
Although extensive studies have been conducted, the exact underlying mechanism for pathogenesis of obesity and obesity-associated metabolic syndrome remains controversial.6,7 Recent studies showed that chronic inflammation played critical roles in the development of obesity, especially in its complications including fatty liver and glucose intolerance.8,9 Chronic inflammation is usually associated with an imbalance between proinflammatory and anti-inflammatory cytokines. Interleukin 10 (IL10) is an anti-inflammatory cytokine that attenuates the inflammatory processes induced by tumor necrosis factor-α (TNFα), IL6, and IL1 while upregulating the release of IL-1 receptor antagonist.10,11 IL10 is negatively correlated with body mass index, percentage fat mass, and fasting glucose levels.12 Low levels of IL10 are associated with obesity, metabolic syndrome and type 2 diabetes. For example, Manigrasso et al. showed that android obesity was associated with a concomitant reduction of IL10.13 Scarpelli et al. reported that variants of the IL10 promoter gene are associated with obesity and IR in Italian subjects.14 Blüher et al. also demonstrated a significant decrease in IL10 in parallel with the impairment of glucose tolerance.12 Recently, Hong et al. showed that IL10 protein administration can prevent diet-induced IR in mouse skeletal muscle.15 An alternative and more promising approach in achieving beneficial effects from IL10 is to overexpress it using gene delivery.
In this study, we investigated the effects of hydrodynamic delivery of mouse IL10 (mIL10) gene on energy homeostasis in mice fed a high-fat diet (HFD). First, we confirmed that hydrodynamic injection with mIL10 gene increased blood mIL10 level in mice fed a regular chow or HFD with similar efficiency. Next, we evaluated the effects of mIL10 overexpression on animals by performing body composition analysis, glucose and insulin tolerance tests (ITT), quantitative PCR, and histochemistry of different organs. Our data suggest that hydrodynamic transfer of mIL10 gene can be regarded as a potential clinical strategy for prevention of obesity and its related diseases.
Results
Efficiency of hydrodynamic gene delivery is not affected by the feeding diet and genes delivered
To confirm that animals fed a different diet are equally sensitive to hydrodynamic gene delivery, we performed hydrodynamic injection with plasmids containing either mIL10 or green fluorescent protein (gfp) gene in mice fed a regular chow or HFD. Hydrodynamic injection did not cause apparent morphological changes in the mouse liver, and control mice injected with gfp gene showed strong signals of green fluorescence (Figure 1a). Both aspartate aminotransferase and alanine aminotransferase levels were in normal range 7 days after injection (Figure 1b,c), confirming that gfp and mIL10 gene expression did not cause liver damage. The mRNA level of mIL10 was ~100-fold higher than that of control animals injected with gfp (Figure 1d). As expected, mice injected with mIL10 gene showed a significantly higher level of blood mIL10 compared with control (Figure 1e). These results demonstrate that diet does not affect the delivery efficiency of hydrodynamic procedure and sufficient level of mIL10 gene expression was achieved in the liver resulting in elevated protein levels of mIL10 in the blood (Figure 1d,e). Time course (Supplementary Figure S1) shows that circulating mIL10 level in blood reaches peak level (~500 ng/ml) 2 days after hydrodynamic injection, declines with time, and reaches a steady level (~50 ng/ml) in 15 days which stays at the same level until the end of experiment on day 34.
Figure 1.

Impact of diet on hydrodynamic gene delivery efficiency. Animals fed a regular chow or high-fat diet (HFD) were hydrodynamically injected with plasmids containing either green fluorescent protein (gfp) or mouse interleukin 10 (mIL10) gene and killed 7 days later. (a) Representative images of hematoxylin and eosin (H&E) staining and green fluorescence of the mouse livers. (b) Blood concentration of aspartate aminotransferase. (c) Blood concentration of alanine aminotransferase. (d) mRNA level of mIL10 in mouse liver. (e) Blood concentration of mIL10. Values in (b–e) represent average ± SD (n = 5). **P < 0.01 compared with chow-fed gfp-injected mice, ##P < 0.01 compared with HFD-fed gfp-injected mice.
mIL10 gene transfer blocked HFD-induced weight gain without significant impact on lean mass and average food intake
Two plasmid injections were performed on animals when fed a specific diet, one on day 1 and the other on day 31. Compared with control animals injected with gfp gene, mice injected with mIL10 gene showed circulating mIL10 concentration at ~50 ng/ml at the end of 7-week experiment (Figure 2a), confirming that two injections were enough to maintain effective blood concentrations of mIL10. Hydrodynamic gene transfer of mIL10 gene completely blocked HFD-induced body weight gain (Figure 2b). Animals fed a HFD for 7 weeks showed an ~36% increase in body weight when gfp gene was injected while only ~10% was seen in those injected with mIL10 gene (Figure 2b). The body composition analysis showed that injection of the mIL10 gene had no significant impact on lean mass, confirming that the difference in body weight gain was primarily due to an increase in fat mass (Figure 2c). Although mice injected with mIL10 gene showed a slightly lower accumulative food intake (Figure 2d, insert) compared with control mice, both groups had a similar average food intake over 7 weeks of HFD feeding (Figure 2d). The calculated caloric intake of animals fed a regular chow or HFD injected with gfp or mIL10 gene was 14.6 ± 1.5, 12.9 ± 1.7, and 11.7 ± 2.7 kcal/mouse/day, respectively.
Figure 2.

Effect of hydrodynamic delivery of mouse interleukin 10 (mIL10) gene on body weight, body composition, and food intake. (a) Blood concentration of mIL10 in mice at the end of 7-week feeding with a selected diet. (b) Body weight gain over 7-week feeding period. Arrows indicate the time of hydrodynamic injection of mIL10 plasmids. (c) Body composition. (d) Food intake. Insert in d represents accumulative food intake per mouse. Values represent average ± SD (n = 5). ##P < 0.01 compared with HFD-fed gfp-injected mice, **P < 0.01 compared with chow-fed gfp-injected mice. GFP, green fluorescent protein; HFD, high-fat diet.
Injection of mIL10 gene blocked hypertrophy in adipocytes
To investigate the impact of mIL10 gene expression on morphological change in AT, we conducted tissue section and hematoxylin and eosin (H&E) staining. Compared with control mice fed a regular chow, mice fed a HFD and injected with gfp gene showed hypertrophic adipocytes in epididymal white AT (EWAT) and inguinal WAT, and also had more fat accumulation in brown AT as evidenced by the increased amount of vacuoles in H&E staining (Figure 3a). Injection of the mIL10 gene blocked adipocyte hypertrophy in these tissues (Figure 3a). In mice injected with the gfp gene, 7-week HFD feeding increased the size of adipocyte by ~4.8- and 5.9-fold in EWAT and inguinal WAT, respectively (Figure 3b,c). Again, mIL10 gene injection completely blocked the enlargement of the adipocytes (Figure 3b,c).
Figure 3.

Hydrodynamic delivery of mouse interleukin 10 (mIL10) gene prevented hypertrophy in adipocytes. (a) Representative images from hematoxylin and eosin staining of EWAT, IWAT, and BAT. Arrows indicate crown-like structures. (b) Average size of adipocytes in EWAT. (c) Average size of adipocytes in IWAT. Values in b and c represent average ± SD of total number of adipocytes seen in five tissue slices (50 adipocytes per slice). **P < 0.01 compared with chow-fed gfp-injected mice, ##P < 0.01 compared with HFD-fed gfp-injected mice. BAT, brown adipose tissue; EWAT, epididymal white adipose tissue; GFP, green fluorescent protein; HFD, high-fat diet; IWAT, inguinal white adipose tissue.
Injection of mIL10 gene prevented ectopic fat accumulation in liver
Because obesity and hypertrophy in adipocytes may cause ectopic fat accumulation in the liver, we dissected the liver and performed a histochemical examination. Neither HFD consumption nor mIL10 gene injection caused an apparent change in liver appearance (Figure 4a). In mice injected with the gfp gene, HFD consumption caused a large amount of fat accumulation in the liver, as evidenced by vacuoles in H&E staining and red dots in Oil-red O staining (Figure 4a). Injection of mIL10 gene prevented HFD-induced ectopic fat accumulation in the liver. Hepatic triglyceride determination showed similar results (Figure 4b), further confirming the mIL10 effect on blocking hepatic accumulation of fat. Blood aspartate aminotransferase and alanine aminotransferase levels suggest that neither HFD feeding nor mIL10 gene transfer caused liver damage(Figure 4c,d).
Figure 4.
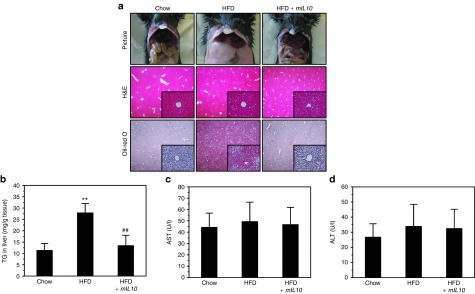
Hydrodynamic delivery of mouse interleukin 10 (mIL10) gene blocked ectopic fat accumulation in liver. (a) Representative images of liver from hematoxylin and eosin (H&E) and Oil-red O staining. (b) Liver triglyceride level. (c) Blood concentration of aspartate aminotransferase and (d) blood concentration of alanine aminotransferase in mice at the end of 7-week feeding period. Values in (b–d) represent average ± SD (n = 5). **P < 0.01 compared with chow-fed gfp-injected mice, ##P < 0.01 compared with HFD-fed gfp-injected mice. GFP, green fluorescent protein; HFD, high-fat diet; TG, triglyceride.
Injection of mIL10 gene maintained glucose homeostasis
Because obesity and ectopic fat accumulation are usually associated with glucose intolerance, we conducted intraperitoneal glucose tolerance test (IPGTT) and ITT to evaluate glucose homeostasis. HFD feeding for 7 weeks caused glucose intolerance in mice injected with gfp gene, as evidenced by elevated blood glucose during IPGTT (Figure 5a); mIL10 gene injection significantly attenuated glucose excursion and maintained glucose tolerance (Figure 5a). Area under the curve calculation showed similar results (Figure 5b). Next, we performed ITT to estimate IR. Results of ITT showed HFD feeding caused severe IR in mice injected with the gfp gene (Figure 5c). Injection of the mIL10 gene maintained insulin sensitivity in mice fed a HFD (Figure 5c). Calculation of homeostasis model assessment-IR (HOMA-IR), which reflects the degree of IR, showed similar results (Figure 5d).
Figure 5.

Hydrodynamic delivery of mouse interleukin 10 (mIL10) gene maintained glucose tolerance in mice fed a HFD. (a) Profiles of blood glucose concentration as function of time upon intraperitoneal injection of glucose. (b) Area under the curve of IPGTT. (c) Profiles of glucose concentration (percentage of initial value) as a function of time upon intraperitoneal injection of insulin. (d) Results of HOMA-IR analysis for insulin resistance. Values represent average ± SD (n = 5). **P < 0.01 compared with chow-fed gfp-injected mice, ##P < 0.01 compared with HFD-fed gfp-injected mice. GFP, green fluorescent protein; HFD, high-fat diet; HOMA-IR, homeostasis model assessment-insulin resistance; IPGTT, intraperitoneal glucose tolerance test.
Injection of mIL10 gene prevented hyperinsulinemia without significant influence in the pancreatic islet
To further confirm HFD-induced IR in mice fed a HFD, we measured blood insulin level. Consistent with above results, HFD feeding induced hyperinsulinemia in mice injected with gfp but not with the mIL10 gene (Figure 6a). To investigate the influence of mIL10 gene injection in the islet, we performed histochemical examination including H&E staining and immunohistochemistry (IHC) staining against insulin. H&E staining showed that neither HFD feeding nor mIL10 gene injection caused hypertrophy in islet (Figure 6b). Islet size measurements showed similar results (Figure 6c). Next, we detected insulin levels in islets using IHC staining and found there is no difference in islet insulin content in animals with or without mIL10 gene delivery (Figure 6d).
Figure 6.

Hydrodynamic delivery of mouse interleukin 10 (mIL10) gene prevented hyperinsulinemia without significant influences in islets. (a) Blood insulin levels. (b) Representative images from the hematoxylin and eosin (H&E) staining of the pancreas. Arrows indicate islets. (c) Average size of the islet. (d) Representative images of immunohistochemistry staining against insulin in islets. Values in a represent average ± SD (n = 5). **P < 0.01 compared with chow-fed gfp-injected mice, ##P < 0.01 compared with HFD-fed gfp-injected mice. DAPI, 4′,6-diamidino-2-phenylindole; GFP, green fluorescent protein; HFD, high-fat diet.
Injection of mIL10 gene prevented HFD-induced GLUT4 decrease in ATs
HFD-induced obesity and adipocyte hypertrophy are usually associated with a GLUT4 decrease in AT. To assess HFD-induced GLUT4 change, we conducted IHC staining using ATs including EWAT, inguinal WAT, and brown AT. In mice injected with the gfp gene, 7-week HFD feeding markedly decreased GLUT4 in all three types of ATs (Figure 7a). Two injections of mIL10 gene prevented HFD-induced GLUT4 decrease. Data from western blot analysis (Figure 7b) show that 7-week HFD feeding decreased GLUT4 level by ~32% in EWAT and by ~18% in brown AT but not in muscle, and hydrodynamic transfer of mIL10 gene prevented the decrease. Quantitative PCR analysis at mRNA level reveals the same trend in WAT (Figure 7c).
Figure 7.

Hydrodyamic delivery of mouse interleukin 10 (mIL10) gene maintained GLUT4 level in adipose tissues. (a) Representative images of immunohistochemistry staining against GLUT4 in BAT, EWAT, and IWAT. (b) GLUT4 protein levels in BAT, EWAT, and muscle of mice. Tissue samples were collected at the end of the 7-week feeding period, homogenized, loaded at ~50 μg protein per lane, and separated by a 12% SDS-PAGE. The antibody against GLUT4 (#ab654; Abcam) was diluted at 1:1,000 for this determination. (c) Relative mRNA levels of glut4 in EWAT. Values in c represent average ± SD (n = 3). **P < 0.01 compared with chow-fed gfp-injected mice, ##P < 0.01 compared with HFD-fed gfp-injected mice. BAT, brown adipose tissue; EWAT, epididymal white adipose tissue; GFP, green fluorescent protein; HFD, high-fat diet; IWAT, inguinal white adipose tissue.
Injection of mIL10 gene suppressed macrophage infiltration and blocked development of crown-like structures in AT
To investigate the impact of mIL10 gene delivery on the development of crown-like structure in EWAT, we conducted IHC staining against f4/80, which is a molecular marker for macrophages. HFD feeding for 7 weeks greatly increased the amount of crown-like structures in EWAT of mice injected with gfp but not mIL10 gene (Figure 8a). Quantitative analysis showed similar results (Figure 8b). Quantification of F4/80 positive macrophages reveals the average level at ~4.1, 43.7, and 5.8 macrophages per mm2 for chow-fed mice, HFD-fed control mice, and HFD-fed mIL10-treated mice, respectively. We also examined macrophage infiltration by assessing the mRNA level of macrophage marker genes. Results in Figure 8c,d clearly show that in mice injected with the gfp gene, HFD feeding markedly increased the expression of f4/80 and cd68 by ~4.4- and 13.6-fold, respectively. Injection of the mIL10 gene blocked elevation of these genes. Similar conclusion was obtained with analysis of additional marker genes for macrophages (cd11b, cd163), dendritic cells (cd11c, cd86, cd205) and T regulatory cells (cd25, cd39, cd152, foxp3; Supplementary Figure S2).
Figure 8.
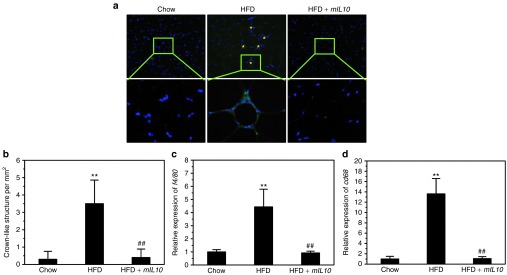
Hydrodynamic delivery of mouse interleukin 10 (mIL10) gene suppressed macrophage infiltration and blocked the development of crown-like structures in adipose tissue. (a) Representative images of immunohistochemistry staining against f4/80 in EWAT. Asterisks (*) indicate crown-like structures. (b) Quantification of crown-like structures in EWAT. (c) Relative mRNA level of f4/80. (d) Relative mRNA level of cd68. Values in (b–d) represent average ± SD (n = 5). **P < 0.01 compared with chow-fed gfp-injected mice, ##P < 0.01 compared with HFD-fed gfp-injected mice. EWAT, epididymal white adipose tissue; GFP, green fluorescent protein; HFD, high-fat diet.
Injection of mIL10 gene modulated gene expression in WAT and suppressed HFD-induced elevations of proinflammatory cytokines
The hypertrophy of WAT and infiltration of macrophages were associated with significant increase in mRNA levels of leptin, mcp1, tnfα, interferon-γ (ifnγ), il1β, and il6, and injection of the mIL10 gene completely blocked these increases (Supplementary Figure S3a,b). In contrast, 7-week HFD feeding slightly but significantly reduced the transcription of glut4 (Figure 7c) and adiponectin (Supplementary Figure S3a) while injection of the mIL10 gene prevented this reduction. The mRNA level of caspase 1 gene was elevated in HFD-fed control animals and mIL10 expression blocked the elevation (Supplementary Figure S3c). In addition, we determined circulating levels of a set of proinflammatory cytokines including TNFα, IFNγ, IL1β, and IL6 (Supplementary Figure S4). HFD-fed control animals showed higher levels of proinflammatory cytokines and injection of the mIL10 gene blocked the elevation.
Discussion
In this study, we demonstrated that hydrodynamic delivery of the mIL10 gene protected mice from HFD-induced obesity and glucose intolerance (Figures 2 and 5). Injection of the mIL10 gene blocked hypertrophy in adipocytes and also prevented ectopic fat accumulation in the liver (Figures 3 and 4). The elevated expression of mIL10 by hydrodynamic gene delivery maintained GLUT4 gene expression in AT and blocked IR (Figures 6 and 7). Mechanistic studies showed that mIL10 gene injection suppressed macrophage infiltration, reduced the development of crown-like structures in AT and blocked the elevations of circulating proinflammatory cytokines (Figure 8 and Supplementary Figure S4).
Obesity is characterized by low-grade inflammation whose molecular origin is unknown. As a typical anti-inflammatory cytokine, IL10 is important in modulating inflammation and regulating metabolic homeostasis. Previous studies have shown that IL10 is involved in the development of obesity and glucose intolerance, and exogenous administration of IL10 protein alleviated diet-induced IR in mouse skeletal muscle.15 A more recent study by Ogura et al. reported that adeno-associated virus-mediated delivery of IL10 gene generated beneficial effect on obesity-associated glomerulopathy in Zucker fatty (Zucker-fa/fa) rats, and that the slightly elevated IL10 markedly decreased blood concentrations of triglyceride, cholesterol as well as glycosylated hemoglobin.16 Consistent with these studies, our data showed that transfer of the mIL10 gene into mice fed a HFD exerted beneficial effects in metabolic homeostasis. These results suggest that a high IL10 level in blood is capable of exerting beneficial effects on metabolic homeostasis through suppressing the HFD-induced chronic inflammation. While the preventive effect of IL10 on HFD-induced obesity is clear, additional studies are needed to examine the therapeutic activity of IL10 for treatment of obesity.
Ectopic fat accumulation in the liver is a typical feature of diet-induced obesity. Previous studies have shown that reduction in IL10 expression is involved in this process. Using IL10 knock-out mice, den Boer et al. demonstrated endogenous IL10 protected mice against HFD-induced hepatic steatosis.17 Studies by Cintra et al. and Morari et al. showed that IL10 is a protective factor against hepatic inflammation and IR, and its expression is partially controlled by proliferator-activated receptor gamma coactivator-1α.18,19 Hashem et al. proposed that the ratio of IL10 to TNF-α should be considered as a predictive biomarker for non-alcoholic fatty liver disease.20 A more recent study by Gotoh et al. demonstrated that spleen-derived IL10 may help to protect mice against the development of non-alcoholic fatty pancreas disease.21 In line with these studies, our data clearly show that mIL10 gene delivery prevents HFD-induced ectopic lipid accumulation in the liver as evidenced by H&E staining, Oil-red O staining, and liver triglyceride determination (Figure 4).
Ectopic fat accumulation and chronic inflammation play a critical role in development of IR. Central and peripheral IR increases gluconeogenesis and decreases blood glucose absorption, leading to glucose intolerance. Many studies have shown that low capacity of IL10 production is tightly associated with IR and glucose intolerance.14,19,22 Cintra et al. showed that knockdown of IL10 by a neutralizing anti-IL10 antibody or an antisense oligonucleotide increased hepatic expression of the inflammatory cytokines and decreased insulin signaling in mouse liver.18 Moreover, Hong et al. reported that exogenous IL10 protein administration alleviated diet-induced IR in mouse skeletal muscle.15 Consistent with these studies, our results show that mIL10 overexpression maintained mRNA and protein levels of GLUT4 in the ATs (Figure 7), blocked IR, and prevented glucose intolerance in HFD-fed mice (Figure 5), and these effects were independent of the function of IL10 in pancreas since no apparent change was observed in pancreatic tissue (Figure 6).
Obesity and hypertrophy of adipocytes are associated with an increase in apoptosis of adipocyte and cell death. Murano et al. showed that dead adipocytes, detected as crown-like structures, were prevalent in visceral fat depots of genetically modified obese mice.23 Another typical feature of obesity is macrophage infiltration to WAT. Although still controversial, the infiltrated macrophages seem to function as a scavenger to remove dead adipocytes. Unfortunately, fatty acids released from these adipocytes can activate toll-like receptor 4 in macrophages and initiate transcription of multiple proinflammatory cytokines, leading to chronic inflammation.24 Recent studies by Henao-Mejia et al. and Stienstra et al. showed that initiation of inflammation plays critical roles in the pathogenesis of obesity and its associated diseases including fatty liver and IR.25,26 Their studies clearly show that blocking the cascade of inflammation causes mice to be resistant to diet-induced obesity and fatty liver. Moreover, Shi et al. reported that mice lacking toll-like receptor 4 are substantially protected against systemic lipid infusion-induced IR and partially protected against diet-induced IR.24 Consistent with these studies, our data showed that overexpression of mIL10 suppressed macrophage infiltration and reduced development of crown-like structures in AT (Figure 8), and led to multiple beneficial consequences in metabolic homeostasis (Figures 2,24 and 5). We believe that the beneficial effects of mIL10 overexpression are at least partially mediated by its function in suppressing inflammation. Evidently, some other pathways may also be involved and additional studies are still needed to further elucidate the underlying mechanism in detail.
In summary, in this study, we demonstrate that overexpression of mIL10 using hydrodynamic gene delivery can protect mice from HFD-induced fat accumulation and glucose intolerance. Our data suggest that transfer of IL10 gene could be an effective approach in preventing HFD-induced obesity, an urgent health problem that affects about 35% Americans.
Materials and Methods
Materials. The pLIVE plasmid vector was purchased from Mirus Bio (Madison, WI). The mouse IL10 gene was cloned from complementary DNA sequences of mice and inserted into the multiple cloning sites of the pLIVE vector using restriction enzyme digestion. The constructed plasmid was confirmed by DNA sequencing. Plasmid containing GFP gene was constructed and confirmed by using similar procedures. These plasmids were prepared by the method of cesium chloride-ethidium bromide gradient centrifugation and kept in saline at −80 °C until use. The purity of the plasmid preparations was examined by absorbency at 260 and 280 nm and 1% agarose gel electrophoresis.
Animals and treatments. The HFD used in this study was purchased from Bio-Serv (Frenchtown, NJ; #F3282) in which 60% of total calories are from fat, 20% from carbohydrates and 20% from proteins. Male C57BL/6 mice (~27 g) purchased from Charles River Laboratories (Wilmington, MA) were housed under standard condition with a 12-hour light-dark cycle. The use of animals was compliant with relevant policies, and the animal protocol was approved by the Institutional Animal Care and Use Committee of the University of Georgia (protocol number, A2011 07-Y2-A3). The procedure for hydrodynamic gene delivery in mice has previously been reported.27,28 Briefly, a large volume of saline solution (equivalent to 9% body weight) containing plasmid DNA was injected into a mouse tail vein within 5–8 seconds. In the expression-confirming experiment, mice were divided into four groups (n = 5 for each group), including two chow-feeding groups and two HFD-feeding groups. For each diet, one group of mice was hydrodynamically injected with plasmid containing gfp gene and the other with mIL10 gene driven by albumin promoter in a pLIVE plasmid vector. Mice were killed 7 days after injection. Blood samples were collected for determining blood levels of aspartate aminotransferase, alanine aminotransferase, and mIL10. Liver samples were collected for histochemical examination and mIL10 expression analysis. In experiment designed to assess the effect of mIL10 gene transfer on animal growth, mice were divided into three groups (n = 5 for each group). Group one was fed with a regular chow and hydrodynamically injected with gfp gene. The other two groups of animal were fed a HFD, and one group was hydrodynamically injected with gfp and the other with mIL10 gene containing plasmids. Hydrodynamic gene delivery was performed on day 1 and day 31 when animals were fed with a selected diet. Body weight and food intake were measured weekly. Body composition analysis using EchoMRI-100 (Echo Medical Systems, Houston, TX) was conducted at the end of the experiment.
Protein determinations of IL10, TNFα, IFNγ, IL1β, and IL6. Blood levels of mIL10, TNFα, IFNγ, IL1β, and IL6 were determined using ELISA kits from eBioscience (San Diego, CA). For mIL10 determination, blood samples were collected at predetermined time-point and at the end of 7-week feeding with a selected diet. For TNFα, IFNγ, IL1β, and IL6 determinations, all of the blood samples were collected at the end of 7-week feeding. Serum was prepared from blood by centrifugation at 4,000 rpm for 5 minutes, and kept frozen at −80 °C until use. ELISA was conducted using a kit following a protocol provided by the manufacturer.
Gene expression analysis and western blot. We purified total mRNA from the liver and ATs using a TRIZOL reagent purchased from Invitrogen (Carlsbad, CA). Reverse transcription-PCR was performed using a Superscript RT III enzyme kit (#11752-050) from Invitrogen. Quantitative analysis of mRNA was conducted by using SYBR Green as detection reagent and the ΔΔCt method for data analysis.29 GAPDH mRNA was utilized as an internal reference and primer sequences are listed in Supplementary Table S1. Melting curve analysis of all real-time PCR product was conducted and showed a single DNA duplex. For western blot, tissue samples were homogenized and loaded at ~50 μg total proteins per lane, and separated on a 12% SDS-PAGE. GLUT4 antibody (#ab654; Abcam, Cambridge, MA) was diluted at 1:1,000, and the protein bands were quantified using Bio-Rad Quantity One 1-D analysis software (BIO-RAD, Hercules, CA).
Evaluation of glucose homeostasis. IPGTT and ITT were performed in the last week of animal growth experiment. Mice were fasted for 8 hours before IPGTT and intraperitoneally injected with glucose in saline (2 g/kg). Blood was collected at predetermined time-points (0, 30, 60, and 120 minutes) after glucose injection and was determined using glucose test strips and glucose meters. For ITT, mice were fasted for 8 hours and intraperitoneally injected with insulin (Humulin: 0.5 U/kg) purchased from Eli Lilly (Indianapolis, IN). Blood glucose level was determined using the same method as above at 0, 30, 60, and 120 minutes after insulin injection. Insulin concentration in blood was determined using a commercial kit (#10-1113-01; Mercodia Developing Diagnostics, Winston Salem, NC). We calculated HOMA-IR using the following formula: HOMA-IR = (fasting insulin (ng/ml) × fasting plasma glucose (mg/dl)/405).30
Oil-red O staining. Animals were killed at desirable times and organs were immediately collected and frozen in liquid nitrogen. The frozen sections were made at 8 μm thickness and fixed in 10% neutral buffered formalin for 30 minutes and washed with phosphate-buffered saline. Tissue slices were rinsed with 60% isopropanol for 5 minutes before being stained with freshly prepared Oil-red O working solution (Electron Microscopy Sciences, Hatfield, PA) for 30 minutes. The sections were rinsed with 60% isopropanol again for 5 minutes before being counterstained with hemotoxylin for 1 minute and examined under an optical microscope (ECLIPSE Ti; Nikon, Melville, NY).
Liver triglyceride determination. Liver triglyceride level was measured following a previously reported method.31 In brief; frozen liver samples (200–400 mg per sample) were homogenized in a mixture solution of chloroform and methanol (2:1) and incubated overnight at 4 °C. The samples were centrifuged at 12,000 rpm for 20 minutes at 4 °C. Supernatants were dried, re-dissolved in 5% Triton-X100 and triglyceride concentration was determined following the instruction of the commercial kit (#TR22203; Thermo-Scientific, Pittsburgh, PA).
Immunofluorescence histochemical study. Tissue samples embedded in paraffin were cut at 6 μm thickness and dried. The sections were immersed in 10 mmol/l citrate buffer (pH 6.0) and processed in a thermostatic water bath for antigen retrieval. These sections were blocked in 10% normal serum and 1% bovine serum albumin in Tris-buffered saline for 2 hours before incubation with primary antibodies. The following primary antibodies were used: antibody for insulin (#4590; Cell Signaling, Boston, MA), antibody for GLUT4 (#ab654; Abcam), and antibody for F4/80 (#M4150; Spring Biosciences, Pleasanton, CA). A secondary antibody conjugated with fluorescent dye (#4412; Cell Signaling) was employed for detection.
H&E staining. Tissues were fixed in 10% neutral buffered formalin and dehydrated against gradients of ethanol before embedded into paraffin. Tissue sections were cut at 6 μm thickness and dried at 37 °C for 1 hour before incubation in xylene, followed by a standard H&E staining using a commercial kit (#3500; BBC Biochemical, Atlanta, GA). Size measurement of adipocytes was carried out using NIS-Elements imaging platform purchased from Nikon Instruments (Melville, NY).
Statistics. The data are expressed as means ± SD for each group and statistical significance was analyzed using analysis of variance. A value of P < 0.05 was considered significant.
SUPPLEMENTARY MATERIAL Figure S1. Time course of mIL10 gene expression. Figure S2. Effect of mIL10 gene expression on expression of marker genes in white adipose tissue. Figure S3. Effect of hydrodynamic delivery of mIL10 gene on expression of selected genes in white adipose tissue. Figure S4. Effect of mIL10 expression on blood concentration of proinflammatory cytokines. Table S1. PCR primer sequences.
Acknowledgments
The study was supported in part by grants from National Institutes of Health (RO1EB007357 and RO1HL098295). We thank Ryan Fugett for English editing. The authors declared no conflict of interest.
Supplementary Material
References
- Yanovski SZ, Yanovski JA. Obesity prevalence in the United States–up, down, or sideways. N Engl J Med. 2011;364:987–989. doi: 10.1056/NEJMp1009229. [DOI] [PMC free article] [PubMed] [Google Scholar]
- http://www.cdc.gov/obesity/data/index.html .
- Zimmet P, Alberti KG, Shaw J. Global and societal implications of the diabetes epidemic. Nature. 2001;414:782–787. doi: 10.1038/414782a. [DOI] [PubMed] [Google Scholar]
- Caprio S, Daniels SR, Drewnowski A, Kaufman FR, Palinkas LA, Rosenbloom AL, et al. Influence of race, ethnicity, and culture on childhood obesity: implications for prevention and treatment: a consensus statement of Shaping America's Health and the Obesity Society. Diabetes Care. 2008;31:2211–2221. doi: 10.2337/dc08-9024. [DOI] [PMC free article] [PubMed] [Google Scholar]
- Dietrich MO, Horvath TL. Limitations in anti-obesity drug development: the critical role of hunger-promoting neurons. Nat Rev Drug Discov. 2012;11:675–691. doi: 10.1038/nrd3739. [DOI] [PubMed] [Google Scholar]
- Pi-Sunyer FX. Pathophysiology and long-term management of the metabolic syndrome. Obes Res. 2004;12 suppl.:174S–180S. doi: 10.1038/oby.2004.285. [DOI] [PubMed] [Google Scholar]
- Furukawa S, Fujita T, Shimabukuro M, Iwaki M, Yamada Y, Nakajima Y, et al. Increased oxidative stress in obesity and its impact on metabolic syndrome. J Clin Invest. 2004;114:1752–1761. doi: 10.1172/JCI21625. [DOI] [PMC free article] [PubMed] [Google Scholar]
- Monteiro R, Azevedo I. Chronic inflammation in obesity and the metabolic syndrome. Mediators Inflamm. 2010;2010:pii: 289645. doi: 10.1155/2010/289645. [DOI] [PMC free article] [PubMed] [Google Scholar]
- Xu H, Barnes GT, Yang Q, Tan G, Yang D, Chou CJ, et al. Chronic inflammation in fat plays a crucial role in the development of obesity-related insulin resistance. J Clin Invest. 2003;112:1821–1830. doi: 10.1172/JCI19451. [DOI] [PMC free article] [PubMed] [Google Scholar]
- Asadullah K, Sterry W, Volk HD. Interleukin-10 therapy–review of a new approach. Pharmacol Rev. 2003;55:241–269. doi: 10.1124/pr.55.2.4. [DOI] [PubMed] [Google Scholar]
- Juge-Aubry CE, Somm E, Pernin A, Alizadeh N, Giusti V, Dayer JM, et al. Adipose tissue is a regulated source of interleukin-10. Cytokine. 2005;29:270–274. doi: 10.1016/j.cyto.2004.10.017. [DOI] [PubMed] [Google Scholar]
- Blüher M, Fasshauer M, Tönjes A, Kratzsch J, Schön MR, Paschke R. Association of interleukin-6, C-reactive protein, interleukin-10 and adiponectin plasma concentrations with measures of obesity, insulin sensitivity and glucose metabolism. Exp Clin Endocrinol Diabetes. 2005;113:534–537. doi: 10.1055/s-2005-872851. [DOI] [PubMed] [Google Scholar]
- Manigrasso MR, Ferroni P, Santilli F, Taraborelli T, Guagnano MT, Michetti N, et al. Association between circulating adiponectin and interleukin-10 levels in android obesity: effects of weight loss. J Clin Endocrinol Metab. 2005;90:5876–5879. doi: 10.1210/jc.2005-0281. [DOI] [PubMed] [Google Scholar]
- Scarpelli D, Cardellini M, Andreozzi F, Laratta E, Hribal ML, Marini MA, et al. Variants of the interleukin-10 promoter gene are associated with obesity and insulin resistance but not type 2 diabetes in caucasian italian subjects. Diabetes. 2006;55:1529–1533. doi: 10.2337/db06-0047. [DOI] [PubMed] [Google Scholar]
- Hong EG, Ko HJ, Cho YR, Kim HJ, Ma Z, Yu TY, et al. Interleukin-10 prevents diet-induced insulin resistance by attenuating macrophage and cytokine response in skeletal muscle. Diabetes. 2009;58:2525–2535. doi: 10.2337/db08-1261. [DOI] [PMC free article] [PubMed] [Google Scholar]
- Ogura M, Urabe M, Akimoto T, Onishi A, Ito C, Ito T, et al. Interleukin-10 expression induced by adeno-associated virus vector suppresses proteinuria in Zucker obese rats. Gene Ther. 2012;19:476–482. doi: 10.1038/gt.2011.183. [DOI] [PubMed] [Google Scholar]
- den Boer MA, Voshol PJ, Schröder-van der Elst JP, Korsheninnikova E, Ouwens DM, Kuipers F, et al. Endogenous interleukin-10 protects against hepatic steatosis but does not improve insulin sensitivity during high-fat feeding in mice. Endocrinology. 2006;147:4553–4558. doi: 10.1210/en.2006-0417. [DOI] [PubMed] [Google Scholar]
- Cintra DE, Pauli JR, Araújo EP, Moraes JC, de Souza CT, Milanski M, et al. Interleukin-10 is a protective factor against diet-induced insulin resistance in liver. J Hepatol. 2008;48:628–637. doi: 10.1016/j.jhep.2007.12.017. [DOI] [PubMed] [Google Scholar]
- Morari J, Torsoni AS, Anhê GF, Roman EA, Cintra DE, Ward LS, et al. The role of proliferator-activated receptor gamma coactivator-1alpha in the fatty-acid-dependent transcriptional control of interleukin-10 in hepatic cells of rodents. Metab Clin Exp. 2010;59:215–223. doi: 10.1016/j.metabol.2009.07.020. [DOI] [PubMed] [Google Scholar]
- Hashem RM, Mahmoud MF, El-Moselhy MA, Soliman HM. Interleukin-10 to tumor necrosis factor-alpha ratio is a predictive biomarker in nonalcoholic fatty liver disease: interleukin-10 to tumor necrosis factor-alpha ratio in steatohepatitis. Eur J Gastroenterol Hepatol. 2008;20:995–1001. doi: 10.1097/MEG.0b013e3282fdf65f. [DOI] [PubMed] [Google Scholar]
- Gotoh K, Inoue M, Shiraishi K, Masaki T, Chiba S, Mitsutomi K, et al. Spleen-derived interleukin-10 downregulates the severity of high-fat diet-induced non-alcoholic fatty pancreas disease. PLoS ONE. 2012;7:e53154. doi: 10.1371/journal.pone.0053154. [DOI] [PMC free article] [PubMed] [Google Scholar]
- van Exel E, Gussekloo J, de Craen AJ, Frölich M, Bootsma-Van Der Wiel A, Westendorp RG, Leiden 85 Plus Study Low production capacity of interleukin-10 associates with the metabolic syndrome and type 2 diabetes: the Leiden 85-Plus Study. Diabetes. 2002;51:1088–1092. doi: 10.2337/diabetes.51.4.1088. [DOI] [PubMed] [Google Scholar]
- Murano I, Barbatelli G, Parisani V, Latini C, Muzzonigro G, Castellucci M, et al. Dead adipocytes, detected as crown-like structures, are prevalent in visceral fat depots of genetically obese mice. J Lipid Res. 2008;49:1562–1568. doi: 10.1194/jlr.M800019-JLR200. [DOI] [PubMed] [Google Scholar]
- Shi H, Kokoeva MV, Inouye K, Tzameli I, Yin H, Flier JS. TLR4 links innate immunity and fatty acid-induced insulin resistance. J Clin Invest. 2006;116:3015–3025. doi: 10.1172/JCI28898. [DOI] [PMC free article] [PubMed] [Google Scholar]
- Henao-Mejia J, Elinav E, Jin C, Hao L, Mehal WZ, Strowig T, et al. Inflammasome-mediated dysbiosis regulates progression of NAFLD and obesity. Nature. 2012;482:179–185. doi: 10.1038/nature10809. [DOI] [PMC free article] [PubMed] [Google Scholar]
- Stienstra R, van Diepen JA, Tack CJ, Zaki MH, van de Veerdonk FL, Perera D, et al. Inflammasome is a central player in the induction of obesity and insulin resistance. Proc Natl Acad Sci USA. 2011;108:15324–15329. doi: 10.1073/pnas.1100255108. [DOI] [PMC free article] [PubMed] [Google Scholar]
- Liu F, Song Y, Liu D. Hydrodynamics-based transfection in animals by systemic administration of plasmid DNA. Gene Ther. 1999;6:1258–1266. doi: 10.1038/sj.gt.3300947. [DOI] [PubMed] [Google Scholar]
- Zhang G, Budker V, Wolff JA. High levels of foreign gene expression in hepatocytes after tail vein injections of naked plasmid DNA. Hum Gene Ther. 1999;10:1735–1737. doi: 10.1089/10430349950017734. [DOI] [PubMed] [Google Scholar]
- Livak KJ, Schmittgen TD. Analysis of relative gene expression data using real-time quantitative PCR and the 2(-Delta Delta C(T)) Method. Methods. 2001;25:402–408. doi: 10.1006/meth.2001.1262. [DOI] [PubMed] [Google Scholar]
- Hirata A, Maeda N, Hiuge A, Hibuse T, Fujita K, Okada T, et al. Blockade of mineralocorticoid receptor reverses adipocyte dysfunction and insulin resistance in obese mice. Cardiovasc Res. 2009;84:164–172. doi: 10.1093/cvr/cvp191. [DOI] [PubMed] [Google Scholar]
- Hara A, Radin NS. Lipid extraction of tissues with a low-toxicity solvent. Anal Biochem. 1978;90:420–426. doi: 10.1016/0003-2697(78)90046-5. [DOI] [PubMed] [Google Scholar]
Associated Data
This section collects any data citations, data availability statements, or supplementary materials included in this article.