

Abstract
The control of neurotransmitter release at nerve terminals is of profound importance for neurological function and provides a powerful control system in neural networks. We show that the balance of enzymatic activities of the α isoform of the phosphatase calcineurin (CNAα) and the kinase cyclin-dependent kinase 5 (CDK5) has a dramatic influence over single action potential (AP)-driven exocytosis at nerve terminals. Acute or chronic loss of these enzymatic activities results in a sevenfold impact on single AP-driven exocytosis. We demonstrate that this control is mediated almost entirely through Cav2.2 (N-type) voltage-gated calcium channels as blocking these channels with a peptide toxin eliminates modulation by these enzymes. We found that a fraction of nerve terminals are kept in a presynaptically silent state with no measurable Ca2+ influx driven by single AP stimuli attributable to the balance of CNAα and CDK5 activities because blockade of either CNAα or CDK5 activity changes the proportion of presynaptically silent nerve terminals. Thus, CNAα and CDK5 enzymatic activities are key determinants of release probability.
Introduction
In the last decade cyclin-dependent kinase 5 (CDK5) has been shown to play important roles in brain function (Dhavan and Tsai, 2001), including development (Kwon and Tsai, 2000; Gupta and Tsai, 2003), signaling (Bibb et al., 1999), plasticity (Odajima et al., 2011), and neuropathology (Cruz and Tsai, 2004), whereas calcineurin (CN) (Sun et al., 2010) is important for learning and memory and signaling (Malleret et al., 2001; Zeng et al., 2001) and it also controls the phosphorylation state of a number of endocytic proteins (Cousin and Robinson, 2001). Recently, we showed that the proline-directed serine–threonine kinase CDK5 and the Ca2+-dependent phosphatase CN potently regulate the size of the synaptic vesicle pool that participates in neurotransmission (Kim and Ryan, 2010). Such modulation is thought to be important for bouts of sustained activity in which vesicle availability might be limiting. Responses to single action potentials (APs), i.e., release probability, is controlled by a combination of the number of release-ready vesicles and the amount and proximity of calcium influx near release sites. Recently, it was demonstrated that Cav2.2 (N-type) voltage-gated calcium channels (VGCCs) can be phosphorylated in vitro by CDK5, and expression of Cav2.2 in which these phosphorylation sites are mutated to alanine diminishes synaptic performance compared with wild-type (WT) Cav2.2 when expressed in hippocampal neurons (Su et al., 2012). Therefore, we wondered whether or not the release probability at nerve terminals might be set by the integration of competing kinase and phosphatase activities on VGCCs. We investigated the potential role of these enzymes in single AP (1AP)-triggered exocytosis, taking advantage of recent improvements in optical methods to probe synapse function and synaptic calcium influx in this stimulus regimen (Ariel and Ryan, 2010; Ariel et al., 2012; Hoppa et al., 2012). To examine possible contributions of these enzymes in controlling release probability, we made use of a combination of pharmacological and/or shRNA-mediated ablation of catalytic subunits of CN and CDK5 gene expression. We show here that the α isoform of calcineurin A (CNAα) and CDK5 profoundly influence exocytosis and calcium influx even for 1AP stimuli. However, our results are in direct contradiction to what would be predicted from the in vitro phosphorylation results, in which loss of kinase activity would be predicted to increase synaptic calcium channel function and loss of CN activity would be predicted to enhance synaptic calcium channel function (Su et al., 2012). In contrast, we found that removal of CN activity dramatically reduces AP-driven calcium influx and exocytosis, whereas suppression of CDK5 activity leads to a large potentiation of calcium influx and exocytosis. Both of these forms of regulation are mediated almost entirely through Cav2.2 VGCCs, because simultaneous blockade of Cav2.2 with a peptide toxin ablates control by either enzyme. Furthermore, we show that the balance of these activities likely varies across synapses, because a portion of nerve terminals are kept in a completely silent state by CDK5-mediated inhibition of Ca2+ influx. Our results stand in contrast to the recent claim that phosphorylation of Cav2.2 enhances synaptic function (Su et al., 2012) and suggest that alternate CDK5 phosphorylation sites of either Cav2.2 or another protein that controls Cav2.2 is critical in determining synaptic performance.
Materials and Methods
Cell culture and optical setup.
Hippocampal CA3–CA1 regions were dissected from 1- to 2-d-old Sprague Dawley rats, dissociated, and plated onto poly-ornithine-coated glass for 14–21 d as described previously (Ryan, 1999). All constructs were transfected 7–8 d after plating. Experiments were performed 14–21 d after plating (6–13 d after transfection), and the coverslips were mounted in a rapid-switching, laminar-flow perfusion and stimulation chamber (volume, ∼75 μl) on the stage of a custom-built laser illuminated epifluorescence microscope. Live-cell images were acquired with an Andor iXon+ (model DU-897E-BV) back-illuminated EM CCD camera. A solid-state diode pumped 488 or 561 nm lasers [for mCherry (mCh) excitation] that were shuttered using acousto-optic tunable filters. Fluorescence excitation and collection was done through a 40×, 1.3 numerical aperture Fluar Carl Zeiss objective and a 1.6× Optivar using 515–560 nm emission and 510 nm dichroic filters (for pHluorin, Fluo5F, or GCaMP3) and a 572–647 nm emission filter (for mCh). APs were evoked by passing 1 ms current pulses, yielding fields of ∼10 V/cm via platinum–iridium electrodes. Cells were continuously perfused (0.2 ml/min) in a saline solution containing 119 mm NaCl, 2.5 mm KCl, 2 mm CaCl2, 2 mm MgCl2, 25 mm HEPES, buffered to pH 7.4, 30 mm glucose, 10 μm 6-cyano-7-nitroquinoxaline-2,3-dione, and 50 μm d,l-2-amino-5-phosphonovaleric acid. For buffer containing 4 or 1.2 mm Ca2+ concentration for measuring one AP (1AP), Mg2+ was substituted for a constant divalent concentration. Temperature was clamped at 30°C to decrease effects arising from temperature fluctuations. Unless otherwise noted, all chemicals were obtained from Sigma except for Ca2+ channel toxins, ω-agatoxin IVA, ω-conotoxin GVIA (Alomone Labs), ionomycin (Alomone Labs), Ca2+ dyes, Fluo5F-AM, magnesium green-AM (MgGreen-AM) (Invitrogen), and EGTA-AM (Invitrogen). NH4Cl applications were done with 50 mm NH4Cl in substitution of 50 mm NaCl, buffered to pH 7.4. Roscovitine (Calbiochem) was used at 50 μm, and cyclosporin A (CSA) was used at 30 μm for 30 min when indicated. Anti-synapsin antibodies were obtained from Synaptic Systems, and anti-CNAα and anti-CNAβ antibodies were a gift from Galenea Corp.
Imaging and analysis of 1AP-driven Ca2+ influx.
Measurements of 1AP Ca2+ influx at nerve terminals were performed using three different Ca2+ indicators: Fluo5F-AM, MgGreen-AM, and GCaMP3 (Tian et al., 2009) fused to synaptophysin. For high-speed (1000 or 1 kHz) imaging with Fluo5F, vesicle-associated membrane protein 2 (VAMP2)–mCh-transfected neurons were loaded with Fluo5F-AM (5 μm) for 10 min and flowed by a 20 min wash period (Hoppa et al., 2012). For imaging of 1AP Ca2+ influx at soma, cytosolic mKate2 (red fluorescence)-transfected neurons were loaded with Fluo5F-AM. mKate2-positive whole soma areas were selected as a region of interest for analysis. Imaging of Ca2+ influx stimulated by 1APs was acquired at 1 kHz by integrating for 975 μs over a reduced region of the EM CCD chip (crop mode) that had been defined using a physical mask in an intermediate image plane in the collection path. EGTA-AM was applied for 120 s, and CSA or roscovitine was applied for 30 min, although the impact of roscovitine was usually noticed within the first few minutes of application. 1AP responses were obtained by averaging 10 trials (spaced 30 s apart) over 5–10 boutons from a single cell in 4 or 1.2 mm external Ca2+. For MgGreen, VAMP2–mCh-transfected cells were loaded with 20 μm MgGreen-AM for 10 min and flowed by a 20 min wash period as described previously (Ariel and Ryan, 2010). Imaging of Ca2+ influx by 1 AP was acquired at 100 Hz by integrating for 9.74 ms in frame transfer mode. For GCaMP3, at the end of each experiment, ionomycin (200 μm) was applied to measure maximum fluorescence of Physin–GCaMP3. 1AP responses were obtained by averaging 10–15 trials (spaced 30 s apart) over 20–30 boutons from a single cell in 4 mm external Ca2+. The P/Q-type VGCC blocker (ω-agatoxin IVA, 400 nm) and N-type VGCC blocker (ω-conotoxin GVIA, 1 μm) were applied for 2 min and washed out before AP stimulation. Images were analyzed in NIH ImageJ using a custom-written plugin. Fluorescence time course traces were analyzed using Origin Pro (version 7.5 or 8.0). For analysis of Ca2+ dye, Fluo5F, or MgGreen, only VAMP2–mCh-positive areas (boutons) are selected as a region of interest. ΔF values of each 1AP trial were subtracted with local background and were averaged. The peak amplitude was taken and normalized by F0. For analysis of genetic Ca2+ indicator, 1AP response amplitudes were obtained by averaging 10–15 trials. The peak was averaged for frames 2–7 after the stimulus. This value was normalized by peak of ionomycin fluorescence and subjected to an equation for converting to linearized value of GCaMP3, because GCaMP3 signals are known to be nonlinear (Tian et al., 2009). We corrected for this through a linearization process described below.
Imaging and analysis of 1AP-driven vesicle release with vesicular glutamate transporter–pHluorin.
To measure vesicle release, neurons were transfected with vesicular glutamate transporter–pHluorin (vG–pH) with/without shRNA–CDK5 or shRNA–CNAα. 1AP responses were obtained by averaging 10 trials (spaced 30 s apart) over 20–30 boutons from a single cell in 4 or 1.2 mm external Ca2+ in the absence or presence of roscovitine or CSA. Images were acquired at 20 or 100 Hz by integrating for 20 or 9.74 ms in frame transfer mode. Images were analyzed using NIH ImageJ and Origin Pro. All visible varicosities were selected for analysis by testing their responsiveness to test application of NH4Cl. To estimate 1AP-driven responses of vG–pH, the peak regions of 1AP are taken and normalized to the maximum fluorescence obtained during an NH4Cl application. NH4Cl were analyzed by mean value of plateau regions. Finally, these peak values of 1AP in various conditions are normalized to the 1AP peak value of WT. In the case of CSA application, we found that, in ∼50% of cells, application of CSA led to a spontaneous increase in vG–pH fluorescence, making additional experiments impossible. These were excluded from additional experimental analysis.
Comparison of changes in exocytosis and calcium influx with previously determined cooperativity curve.
We previously determined 1AP-driven exocytosis measured with vG–pH as a function of the relative calcium entry measured in separate experiments for conditions in which calcium entry was varying (Ariel and Ryan, 2010). The normalized solid curve shown in Figure 4 is described by y = x3.4/(1.9 + x3.4), where y is the normalized value of exocytosis and x is the calcium entry relative to that obtained at 2 mm external calcium. We previously determined the value of exocytosis and calcium influx for 4 mm external calcium on this curve and then use this as a reference point for plot the impact of CDK5 or CN blockade. For data at 1.2 mm calcium, we compared the exocytosis and calcium influx values with that obtained at 4 mm external calcium.
Figure 4.
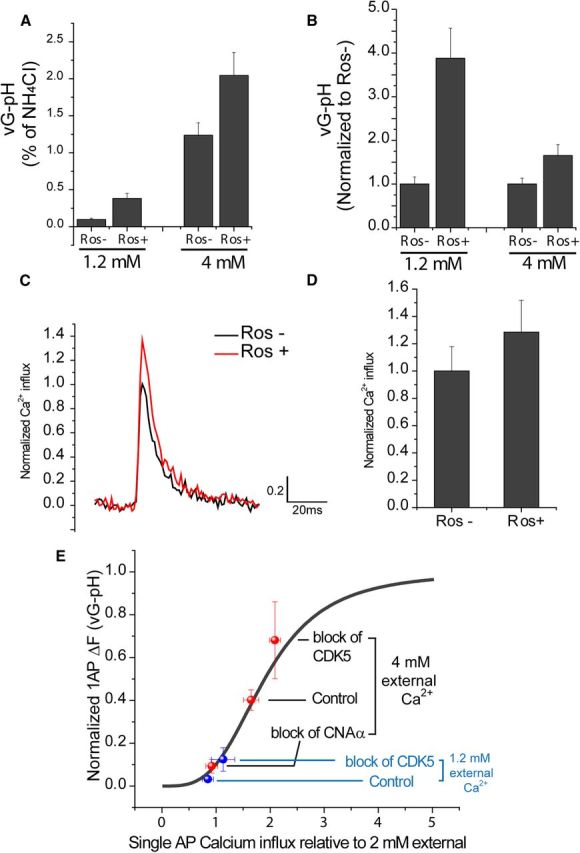
Manipulation of exocytosis and Ca2+ influx at 1.2 mm external Ca2+. A, Comparison of mean values of 1AP-driven exocytosis reported by vG–pH at 1.2 and 4 mm external Ca2+ with/without roscovitine (Ros) (expressed as percentage of NH4Cl): 1.2 mmRos− = 0.098 ± 0.016, 1.2 mmRos+ = 0.382 ± 0.068 (n = 15), 4 mmRos− = 1.23 ± 0.16, and 4 mmRos+ = 2.04 ± 0.3 (n = 10). B, Normalized response to exocytosis without Ros (Ros−) at 1.2 or 4 mm Ca2+: 1.2 mmRos− = 1.00 ± 0.16, 1.2 mmRos+ = 3.88 ± 0.68 (n = 15), 4 mmRos− = 1.00 ± 0.14, and 4 mmRos+ = 1.65 ± 0.25 (n = 10). C, Representative trace of Fluo5F to 1AP at 1.2 mm external Ca2+ with/without Ros in WT synapses. D, Normalized mean values of 1AP-driven Fluo5F response amplitudes with/without Ros at 1.2 mm external Ca2+. 1.2 mmRos− = 1.00 ± 0.17, and 1.2 mmRos+ = 1.28 ± 0.23 (n = 7). E, Comparison of response modulation by blocking either CNAα or CDK5 with the known Ca2+ dependence of exocytosis in this system. This curve has a Hill coefficient of 3.4 and is normalized along the x-axis to the Ca2+ influx obtained using 2 mm external CaCl2 (Ariel and Ryan, 2010). For comparison, we mapped the results of the experiments with CNAα and CDK5 manipulations on exocytosis and Ca2+ influx relative to the controls [measured at 2 different external Ca2+ concentrations, 1.2 mm (blue) and 4 mm (red), in this study]. Value of 1.2 mm Ca2+ on x-axis is calculated as relative value from 4 mm Ca2+ value. The data appear to fall along the originally mapped Ca2+ influx curve, suggesting that the full effect of CNAα and CDK5 inhibition on exocytosis can be attributed to changes in Ca2+ influx.
Other images and data analyses.
Silent boutons were defined as those in which the response of 1AP was smaller than the 1 SD of the baseline before stimulation. To quantify the efficiency of knockdown (KD) of CNAα and CNAβ, neurons cotransfected with shRNA–CNAα or shRNA–CNAβ and GFP or vG–pH were fixed with 4% paraformaldehyde and incubated with anti-CNAα or CNAβ antibodies, and subsequently Alexa Fluor-546-conjugated secondary antibodies were incubated as described previously (Kim and Ryan, 2009). Quantification of shRNA-mediated KD of CNAα and CNAβ were measured by comparing the fluorescence intensity of immunostained cell bodies corrected for background in surrounding area with respect to that obtained in nontransfected neighboring neurons. The normalized intensities in KD neurons measured in this way were [CNAα]CNAαKD = 0.22 ± 0.03 (n = 9) and [CNAβ]CNAβKD = 0.20 ± 0.03 (n = 12).
All data are presented as mean ± SEM. Student's t test between two groups was used for statistical tests.
Conversion of GCaMP3 to linearized value.
In vitro measurements of GCaMP3 Ca2+ binding showed that the relationship between fluorescence and Ca2+ concentration is nonlinear with a Hill coefficient of 2.5 (Tian et al., 2009). In situ calibrations obtained by comparing MgGreen signals with GCaMP3 signals showed a very similar relationship (Hoppa et al. 2012). Our in situ calibration allowed us to linearize the GCaMP3 signals and express them relative to the signal obtained by a 1AP using MgGreen. The expression level of GCaMP3 was normalized by comparing all responses to a saturating signal obtained by applying ionomycin (FMAX) at the end of experiments. Peak fluorescence (ΔF) for each stimulation was found by averaging the five highest points after stimulation and subtracting the average of 10 points before stimulation. Linearized GCaMP3 was obtained from the following equation: Linearized GCaMP3 = ((((ΔF/F)/FMAX) × kn)/(1 − ((ΔF/F)/FMAX))(1/n), where k = 9.077 and n = 2.46. These latter parameters were obtained from our in situ Hill fit comparing MgGreen and GCaMP3 and are in excellent agreement with the in vitro estimate (Tian et al., 2009).
Plasmids.
Physin–GCAMP3 was kindly provided by Loren Looger (Janelia Farm Research Campus, Howard Hughes Medical Institute, VA) (Tian et al., 2009). Synthetic oligonucleotides containing cDNA target sequences of rat cnaα (GGATTCTCACCACAACAT), cnaβ (GAGTGTGTCTTGTATTTAT), and rat cdk5 (CCTCCGGGAGATCTGTCTACTCAAA) (Kim and Ryan, 2010) were cloned, annealed, and ligated into pSUPER (Invitrogen) with BglII and HindIII enzyme sites according to the instructions of the manufacturer.
Results
Loss of CNAα suppresses exocytosis at nerve terminals
Previously, we showed that CN was a potent regulator of presynaptic function, including AP-triggered exocytosis, making use of shRNA targeting the obligate regulatory subunit [calcineurin B (CNB)]. To investigate the mechanism of CN action in detail, we sought to determine which catalytic isoform of CN might be responsible for controlling AP-triggered exocytosis efficiency. In mammals, CN is composed of a regulatory subunit, CNB, encoded by a single gene and one of three isoforms of a catalytic subunit, CNA, encoded by different genes (α, β, and γ) (Klee et al., 1998). CNAα and CNAβ represent the most abundant of the three catalytic subunits in brain, and both are present at nerve terminals (Fig. 1A,B). Transfection with shRNAs specifically targeting these subunits resulted in ∼80% suppression of expression in individual primary hippocampal neurons (see Materials and Methods). To examine exocytosis, we coexpressed individual shRNAs with vG–pH. This latter reporter construct provides high-fidelity measurements of exocytosis at nerve terminals, making use of the all-or-none quenching of pHluorin by protons with a pKa of ∼7.1. When targeted to nerve terminals by fusion into an intraluminal loop of vG, pHluorin is mostly quenched in the resting acidic state of the synaptic vesicle but the quenching is relieved during exocytosis and equilibration of vesicle pH with the more alkaline extracellular environment. In control neurons transfected with vG–pH alone a burst of 100 APs at 10 Hz leads to a rapid rise in vG–pH fluorescence (Fig. 1C), corresponding to ∼15% of the maximal possible value as assessed with brief NH4Cl application. In contrast, neurons coexpressing shRNA targeting CNAα and vG–pH showed much smaller responses with approximately fivefold lower exocytosis signal, corresponding to only ∼2.5% of the NH4Cl-driven maximal fluorescence (Fig. 1C–E). In contrast, neurons coexpressing shRNA targeting CNAβ were indistinguishable from controls (Fig. 1C–E). Thus, despite the presence of both CNAα and CNAβ at nerve terminals, only CNAα appears critical for robust AP-triggered exocytosis. Single bouton analysis showed that the suppression in exocytosis was a general trend across the entire population of nerve terminals (Fig. 1F).
Figure 1.
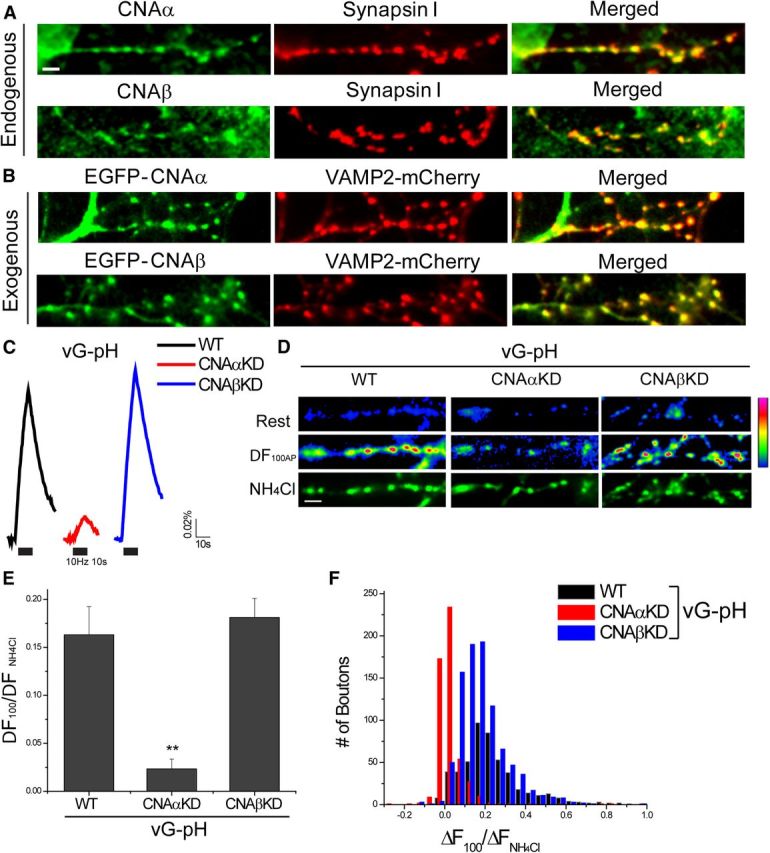
Ablation of CNAα not CNAβ in hippocampal synapses impairs synaptic AP stimulate exocytosis. A, Representative images of CNAα, CNAβ, and synapsin I immunostaining. Mature (14–18 d in vitro) neurons were fixed and costained with anti-CNAα antibody (green) and anti-synapsin I (red) (top) or anti-CNAβ antibody (green) and anti-synapsin I (red) (bottom) and subsequently applied by appropriate secondary antibodies. Scale bar, 5 μm. B, EGFP–CNAα (top) or EGFP–CNAβ (bottom) with the presynaptic terminal marker (VAMP2–mCh) transfected into neurons. C, Ensemble average traces of vG–pH responses to 100 AP stimulation at 10 Hz from WT (black), CNAα (red), and CNAβ (blue) depleted neurons. Intensities of vG–pH were normalized to the peak of a subsequent NH4Cl response (total vesicle pool). D, Representative field of vG–pH fluorescence images at rest, the difference image for 100 AP stimulation (ΔF100AP), and during NH4Cl application in WT, CNAαKD, or CNAβKD neurons. Scale bar, 5 μm. Average 100 AP (ΔF100AP) response is significantly lower in CNAαKD but is unchanged in CNAβKD neurons. E, Mean values of 100 AP vG–pH response amplitudes in WT, CNAαKD, or CNAβKD neurons. WT100AP = 0.163 ± 0.029 (n = 7), CNAαKD100AP = 0.023 ± 0.010 (n = 9), and CNAβKD100AP = 0.181 ± 0.060 (n = 10). **p < 0.01. F, The 100 AP vG–pH response amplitude distribution from single boutons from WT (black), CNAαKD (red), and CNAβKD (blue) neurons.
Potent control of 1AP exocytosis by CDK5 and CNAα
During repetitive AP firing, the total amount of exocytosis can in principle be regulated at several different steps, including release probability and readily-releasable pool refilling. We therefore examined exocytosis in response to 1AP stimulation to narrow down possible targets of CN function. vG–pH measurements of 1AP-driven exocytosis showed that loss of CNAα led to 1AP responses that were only ∼25% compared with controls (Fig. 2A,B). Because our previous studies on CN regulation of presynaptic function also showed that CDK5 served to counteract CN function, we examined 1AP exocytic responses when CDK5 expression was ablated by shRNA targeting. These experiments revealed that suppression of CDK5 leads to a potent 60% potentiation of exocytosis for 1AP stimuli (Fig. 2A,B). Similar results were obtained after acute application of the small-molecule CDK5 inhibitor roscovitine (Meijer et al., 1997) (Fig. 2B). Furthermore, the ability of roscovitine to potentiate exocytosis was eliminated in neurons in which CN function was also eliminated via shRNA-mediated ablation of CNAα (Fig. 2C,D) or pharmacological block of CN using CSA (Fig. 2E,F). These data all support the idea that CDK5-mediated phosphorylation of a presynaptic substrate suppresses release probability, whereas CNAα-mediated dephosphorylation of a presynaptic substrate enhances release probability.
Figure 2.
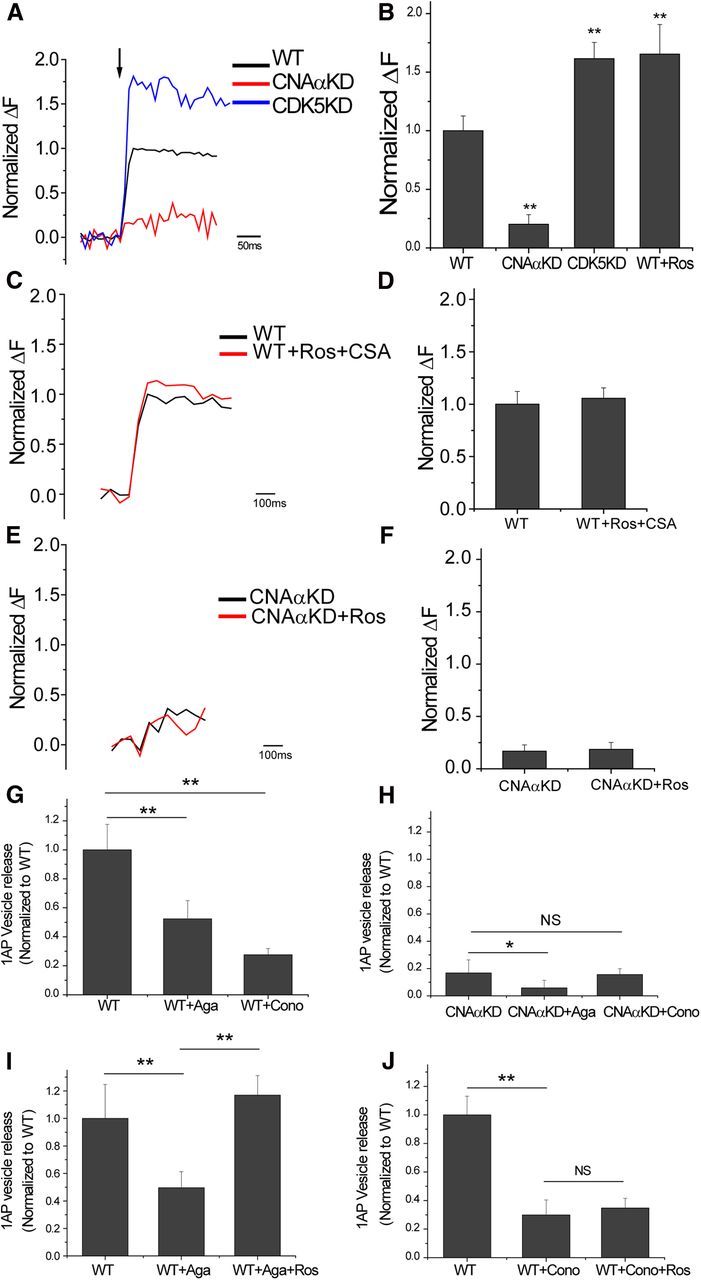
CNAα and CDK5 regulate 1AP-stimulated vesicle release at nerve terminals. A, Ensemble average traces of 1AP-stimulated exocytosis reported by vG–pH in WT, CNAαKD, and CDK5KD synapses. B, Mean values of 1AP vG–pH response amplitudes normalized to WT in WT, CNAαKD, CDK5KD, and WT neurons treated with roscovitine (Ros). WT1AP = 1.00 ± 0.12 (n = 20), CNAαKD1AP = 0.23 ± 0.08 (n = 8), CDK5KD1AP = 1.61 ± 0.13 (n = 8), and WT + Ros1AP = 1.65 ± 0.25 (n = 10). C, Ensemble average of 1AP-stimulated exocytosis recorded by vG–pH in WT and WT with Ros and CSA simultaneously. D, Mean values of 1AP responses of vG–pH in WT and WT with Ros and CSA simultaneously. WT1AP = 1.00 ± 0.12, and WT + Ros + CSA1AP = 1.05 ± 0.09 (n = 9). E, Ensemble average of 1AP-stimulated exocytosis recorded by vG–pH in CNAαKD and CNAαKD with Ros. F, Mean values of 1AP vG–pH responses in CNAαKD and CNAαKD treated with Ros. CNAαKD1AP = 0.17 ± 0.06, and CNAαKD + CSA1AP = 0.19 ± 0.06 (n = 8). G, Mean amplitudes of 1AP vG–pH response in WT neurons normalized to control WT condition for ω-agatoxin IVA (Aga) or ω-conotoxin GVIA (Cono) treatments: WT1AP = 1 ± 0.18 (n = 17), WT + Aga1AP = 0.52 ± 0.13 (n = 7), and WT + Cono1AP = 0.28 ± 0.04 (n = 10). H, Mean amplitudes of 1AP vG–pH responses in CNAαKD neurons normalized to control WT conditions for ω-agatoxin IVA and ω-conotoxin GVIA treatments: CNAαKDonly1AP = 0.17 ± 0.09 (n = 16), CNAαKD + Aga1AP = 0.06 ± 0.06 (n = 10), and CNAαKD + Cono1AP = 0.16 ± 0.04 (n = 6). I, Mean amplitudes of 1AP vG–pH response in WT neurons normalized to WT control condition for Aga and Aga + Ros treatments: WT1AP = 1 ± 0.24 (n = 5), WT + Aga1AP = 0.50 ± 0.12 (n = 5), and WT + Aga + Ros1AP = 1.17 ± 0.15 (n = 5). J, Mean amplitudes of 1AP vG–pH response in WT neurons normalized to WT control condition for Cono and ω-Cono + Ros treatments: WT1AP = 1 ± 0.13 (n = 9), WT + Cono1AP = 0.30 ± 0.1 (n = 9), and WT + Cono + Ros1AP = 0.35 ± 0.07 (n = 9). *p < 0.05, **p < 0.01. NS, Not significantly different.
CNAα and CDK5 control of release probability is mediated through Cav2.2 VGCCs
Neurotransmitter release at hippocampal nerve terminals is driven by a combination of Cav2.2 (N-type) and Cav2.1 (P/Q-type) VGCCs (Takahashi and Momiyama, 1993). Application of the specific Cav2.1 blocker ω-agatoxin IVA led to an ∼50% inhibition of 1AP-driven exocytosis, whereas application of the Cav2.2 blocker ω-conotoxin GVIA suppressed ∼70% of exocytosis (Fig. 2G), in agreement with previous results obtained in this system (Ariel et al., 2012). In neurons in which CNAα expression has been suppressed, only agatoxin, but not conotoxin, could further reduce exocytosis (Fig. 2H). Similarly, acute application of roscovitine to block CDK5 activity showed full potentiation of exocytosis in the presence of agatoxin (Fig. 2I) but showed no effect when Cav2.2 channels were blocked (Fig. 2J). We conclude that the control of AP-triggered exocytosis by CNAα and CDK5 requires Cav2.2 calcium channel function.
CNAα and CDK5 control AP-triggered Ca2+ influx at nerve terminals
Exocytosis at nerve terminal is tightly controlled by Ca2+ influx via VGCCs, and the elimination of CDK5 and CNAα modulation of exocytosis by selective blockade of Cav2.2 strongly suggests that the profound modulation of exocytosis we observed occurs through modulation of calcium influx at nerve terminals. To test this hypothesis, we measured intracellular calcium ([Ca2+]) at synaptic boutons in response to 1APs using a recently developed approach (Hoppa et al., 2012) with the fast fluorescent indicator of Ca2+, Fluo5F-AM, sampled at 1 kHz and visualized by expression of VAMP–mCh (Fig. 3A, left). This approach led to very robust 1AP signals (Fig. 3B, black traces). However, even at millisecond time resolution, the peak signal can potentially reflect both the influx of Ca2+ and dissipative mechanisms, such as extrusion and diffusion. To minimize the contributions of the latter, we artificially accelerated the decay time of the Ca2+ signal ∼10-fold by addition of a high concentration of the mobile Ca2+ buffer EGTA-AM. For all conditions used, this led to a suppression of the pre-EGTA peak signal by ∼50% and a fluorescence decay time ∼8 ms (Fig. 3B). Because the decay time of the Ca2+ signal is now under extrinsic control, the peak signals can more safely be interpreted as a much purer reflection of calcium influx. To determine how either CN or CDK5 might influence Ca2+ influx, we made use of acute pharmacological inhibitors as well as shRNA-mediated genetic ablation of these enzymatic activities using the above measurement strategy. These experiments showed that acute suppression of CN by addition of the CN inhibitor CSA led to an ∼40% drop in Ca2+ influx. In nerve terminals lacking CNAα, Ca2+ transients were ∼50% smaller than controls and were no longer sensitive to CSA (Fig. 3B,C). In contrast, acute inhibition of CDK5 by application of roscovitine led to ∼30% potentiation of Ca2+ influx. Nerve terminals that lacked CDK5 showed Ca2+ influx that was ∼30% larger than in controls and were insensitive to roscovitine (Fig. 4D,E). Although there have been reports of non-CDK5-mediated effects of roscovitine, the equivalence of the impact of the KD of CDK5 and the occlusion of any additional impact by roscovitine argues strongly against this possibility under our recording conditions. Simultaneous blockade of CDK5 and CN using roscovitine and CSA prevented either from modulating AP-driven Ca2+ influx (Fig. 3F). Similarly, the effect of roscovitine on Ca2+ influx was abolished in neurons in which CNAα expression was suppressed previously (Fig. 3G). These data all suggest that these two enzymes share a substrate that regulates Ca2+ influx through Cav2.2.
Figure 3.
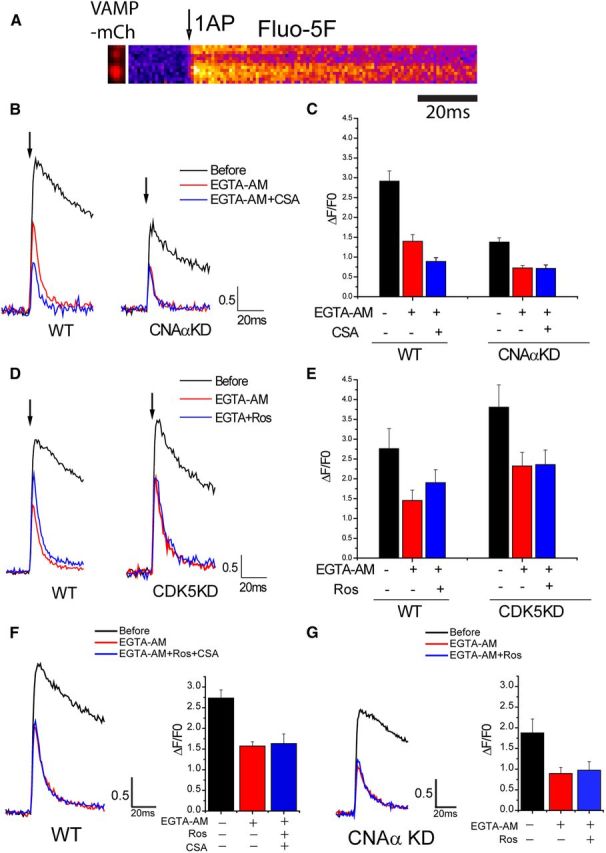
CNAα and CDK5 regulate AP-stimulated Ca2+ influx at nerve terminals. A, Representative images of VAMP2–mCh and its corresponding Fluo5F kymograph image for 1AP stimulation in WT. B, Representative 1AP Fluo5F traces before (black) and after (red) EGTA-AM with CSA (blue) in WT (left) and CNAαKD (right) neurons. Arrow indicates 1AP point. C, Mean value of Fluo5F 1AP response amplitudes before and after EGTA-AM with/without CSA in WT and CNAαKD neurons: WTBefore 1AP = 2.92 ± 0.26, WTEGTA-AM 1AP = 1.40 ± 0.17, WTEGTA-AM + CSA 1AP = 0.89 ± 0.10 (n = 8), CNAαKDBefore 1AP = 1.38 ± 0.11, CNAαKDEGTA-AM 1AP = 0.73 ± 0.06, and CNAαKDEGTA-AM + CSA 1AP = 0.71 ± 0.09 (n = 9). D, Representative 1AP Fluo5F traces before (black) and after (red) EGTA-AM with roscovitine (Ros) (blue) in WT (left) and CDK5KD (right) neurons. Arrow indicates 1AP point. E, Mean value of Fluo5F 1AP response amplitudes before and after EGTA with/without roscovitine in WT and CDK5KD neurons: WTBefore 1AP = 2.76 ± 0.51, WTEGTA-AM 1AP = 1.45 ± 0.26, WTEGTA-AM + Ros 1AP = 1.90 ± 0.33 (n = 7), CDK5KDBefore 1AP = 3.81 ± 0.56, CDK5KDEGTA-AM 1AP = 2.32 ± 0.35, and CDK5KDEGTA-AM + Ros 1AP = 2.36 ± 0.37 (n = 8). F, Left, Representative 1AP Fluo5F traces before (black) and after (red) EGTA-AM with Ros and CSA (blue) in WT neurons. Right, Mean value of Fluo5F 1AP response amplitudes before and after EGTA-AM with/without Ros and CSA in WT neurons: WTBefore 1AP = 2.73 ± 0.19, WTEGTA-AM-1AP = 1.57 ± 0.10, and WTEGTA-AM + Ros + CSA 1AP = 1.63 ± 0.23 (n = 5). G, Left, Representative 1AP Fluo5F traces before (black) and after (red) EGTA-AM with Ros (blue) in CNAαKD neurons. Right, Mean value of Fluo5F 1AP response amplitudes before and after EGTA-AM with/without Ros in CNAαKD neurons: CNAαKDBefore 1AP = 1.87 ± 0.33, CNAαKDEGTA-AM 1AP = 0.89 ± 0.14, and CNAαKDEGTA-AM + Ros 1AP = 0.97 ± 0.20. (n = 5).
Control of exocytosis and Ca2+ influx at 1.2 mm external Ca2+
In the results described above, we took advantage of the large signal-to-noise ratio available for optical measurements of both Ca2+ influx and exocytosis when performing measurements at supraphysiological external Ca2+ concentration (4 mm). We previously examined the relationship between Ca2+ influx and 1AP-driven exocytosis at nerve terminals (Ariel and Ryan, 2010) and showed that this was well described by a simple generalized Hill equation with a Hill coefficient of ∼3.4, in agreement with numerous studies. This nonlinear behavior suggests that the impact of CDK5 and CNAα on exocytosis might differ substantially under more physiological external Ca2+ conditions (1.2 mm). As expected, 1AP vG–pH responses were much smaller (∼) at the lower external calcium concentration compared with that obtained at 4 mm Ca2+ (Fig. 4A). However, inhibition of CDK5 by application of roscovitine still led to a robust potentiation of release probability (Fig. 4A), which now corresponded to an almost fourfold potentiation of 1AP exocytosis (Fig. 4B), significantly greater than the ∼60% potentiation obtained using 4 mm Ca2+. However, measurements of calcium influx using 1.2 mm Ca2+ showed that CDK5 inhibition by application of roscovitine led to a similar potentiation of calcium influx (∼28%) to that observed at higher external calcium concentration (Fig. 4C,D). The differences in the level of potentiation obtained for the different external calcium concentrations are well accounted for by the shape of the relationship of calcium influx and exocytosis previously determined in this system (Fig. 4E), indicating that impact of CNAα and CDK5 modulation of 1AP-triggered exocytosis is fully accounted for by its impact on Ca2+ influx over a range of external calcium concentrations.
CNAα controls Ca2+ influx through presynaptic N-type Ca2+ channels
Our measurements of calcium influx at single nerve terminals made use of fast recording, high buffer concentrations, and high-affinity probes to ensure the validity of the interpretation that the two counteracting enzymatic activities were controlling calcium influx. We sought to determine whether one could use higher throughput approaches, in particular genetically encoded calcium indicators, to proceed with additional experiments. To this end, we compared 1AP calcium signals using Fluo5F and the genetically encoded calcium indicator GCaMP3 (Tian et al., 2009) as well as the lower-affinity calcium probe MgGreen (Fig. 5). These experiments revealed that, once the nonlinearity of GCaMP3 and been taken into account (Hoppa et al., 2012) (see Materials and Methods), the different probes reported quantitatively identical modulation of 1AP-driven calcium influx by CNAα and CDK5 ablations, respectively.
Figure 5.

Comparison of 1AP-driven Ca2+ influx with three different calcium indicators: GCaMP3, Fluo5F, and MgGreen. A–C, Ensemble average traces of 1AP-triggered Ca2+ influx responses of linearized Physin–GCaMP3 (A), Fluo5F (B), or MgGreen (C) in VAMP–mCh-positive puncta in WT (black) and CNAαKD (red) neurons. D, E, Ensemble average traces of 1AP-triggered Ca2+ influx responses of linearized Physin–GCaMP3 (D) or Fluo5F (E) in VAMP–mCh-positive puncta in WT (black) and CDK5KD (red) neurons. F, Normalized mean values of 1AP-triggered Ca2+ influx. GCaMP3CNAαKD 1AP = 0.42 ± 0.04 (n = 7), Fluo5FCNAαKD 1AP = 0.47 ± 0.06 (n = 9), MgGreenCNAαKD 1AP = 0.47 ± 0.11 (n = 6), GCaMP3CDK5KD 1AP = 1.42 ± 0.16 (n = 10), and Fluo5FCNAαKD 1AP = 1.38 ± 0.20 (n = 8).
The data in Figures 2 and 3 imply that CNAα and CDK5 specifically act by controlling AP-driven calcium influx through Cav2.2 channels at synapses. We tested this hypothesis by measuring calcium influx at synapses using GCaMP3 after blockade by Cav2.1 or Cav2.2 while simultaneously manipulating CNAα or CDK5 activity. At synapses, application of the specific Cav2.1 blocker ω-agatoxin IVA led to an ∼20% inhibition of 1AP-driven Ca2+ influx, whereas application of the Cav2.2 blocker ω-conotoxin GVIA suppressed ∼50% of the total Ca2+ influx (Fig. 6A). In neurons in which CNAα expression has been suppressed, only agatoxin, but not conotoxin, could further reduce Ca2+ influx. These data indicate that no Cav2.2 function persists in the absence of CNAα activity (Fig. 5B). Similarly application of roscovitine to block CDK5 activity showed full potentiation even in the absence of Ca2+ influx through Cav2.1 (Fig. 6C) but showed no effect when Cav2.2 channels were blocked (Fig. 6C,D). We wondered whether the ability of CDK5 and CNAα to control calcium influx via Cav2.2 was restricted to nerve terminals. To examine this, we adapted our protocols to examine calcium influx at cell somas (Fig. 6E–H). Although we found that the proportional contributions to 1AP-triggered somatic Ca2+ influx by Cav2.1 and Cav2.2 was different from that at nerve terminals (Fig. 6E), the relative modulation of calcium influx through these VGCCs via CDK5 and CNAα was similar to that observed presynaptically (Fig. 6F–H). Collectively, we conclude that the modulation of AP-triggered Ca2+ influx by CNAα and CDK5 is restricted to Cav2.2 VGCCs.
Figure 6.

CNAα and CDK5 regulate N-type but not P/Q-type Ca2+ channels at hippocampal synapses and soma. A–D, Measurement of Ca2+ influx with synaptophysin–GCaMP3 at presynaptic terminal with/without ω-agatoxin IVA or ω-conotoxin GVIA in WT and CNAαKD neurons. A, Mean linearized 1AP GCaMP3 response amplitudes at boutons in WT neurons normalized to control condition for ω-agatoxin IVA (Aga) or ω-conotoxin GVIA (Cono) treatments: WTboutons 1AP = 1.00 ± 0.07 (n = 24), WT + Agaboutons 1AP = 0.80 ± 0.07 (n = 16), and WT + Conoboutons 1AP = 0.50 ± 0.07 (n = 8). B, Mean linearized 1AP GCaMP3 responses in CNAαKD neurons normalized to control WT conditions for Aga and Cono treatments: CNAαKDboutons 1AP = 0.49 ± 0.08 (n = 14), CNAαKD + Agaboutons 1AP = 0.35 ± 0.03 (n = 6), and CNAαKD + Conoboutons 1AP = 0.44 ± 0.04 (n = 8). C, Mean linearized 1AP GCaMP3 response amplitudes in WT neurons normalized to WT control condition for Aga and Aga + roscovitine (Ros) treatments: WTboutons 1AP = 1.00 ± 0.03, WT + Agaboutons 1AP = 0.75 ± 0.07, and WT + Aga + Rosboutons 1AP = 1.05 ± 0.10 (n = 7). D, Mean linearized 1AP GCaMP3 response amplitudes in WT neurons normalized to WT control condition for ω-conotoxin GVIA (Cono) and Cono + Ros treatments: WTboutons 1AP = 1.00 ± 0.10, WT + Conoboutons 1AP = 0.63 ± 0.12, and WT + Cono + Rosboutons 1AP = 0.66 ± 0.11 (n = 7). E–H, Measurement of somatic Ca2+ influx with Fluo5F with/without ω-agatoxin IVA or ω-conotoxin GVIA and roscovitine in WT neurons. E, Mean 1AP response amplitudes of Ca2+ influx at cell somas in WT neurons normalized to control condition for Aga or Cono treatments: WTsoma 1AP = 1.00 ± 0.03 (n = 23), WT + Agasoma 1AP = 0.66 ± 0.03 (n = 9), and WT + Conosoma 1AP = 0.85 ± 0.02 (n = 14). F, Mean 1AP response amplitudes of Ca2+ influx at cell body with/without roscovitine or CSA: WTsoma 1AP = 1.00 ± 0.09 (n = 19), WT + Rossoma 1AP = 1.15 ± 0.14 (n = 9), and WT + CSAsoma 1AP = 0.77 ± 0.06 (n = 10). G, Mean 1AP response amplitudes of Ca2+ influx at cell body with Aga and Aga + Ros treatments: WTsoma 1AP = 1.00 ± 0.04, WT + Agasoma 1AP = 0.66 ± 0.04, and WT + Aga + Rossoma 1AP = 0.76 ± 0.06 (n = 7). H, Mean 1AP response amplitudes of Ca2+ influx at cell body with Cono and Cono + Ros treatments: WTsoma 1AP = 1.00 ± 0.13, WT + Conosoma 1AP = 0.79 ± 0.09, and WT + Cono + Rossoma 1AP = 0.84 ± 0.08. (n = 6). **p < 0.01. NS, Not significantly different.
The balance of CNAα and CDK5 eliminates Ca2+ influx at some boutons
We showed previously that subsets of synaptic boutons are in a functionally silent state, failing to show any exocytic response, even during robust AP stimulation. Our experiments revealed that acute blockade of CDK5 activity would unmask a large fraction of this silent population (Kim and Ryan, 2010). Therefore, we wondered whether this silencing was attributable to an absence of AP-triggered Ca2+ entry or other downstream steps related to exocytosis. To examine this, we made use of synaptically targeted GCaMP3 (synaptophysin–GCaMP3) (Tian et al., 2009). We examined 1AP responses averaged over many trials (10–15) across populations of synapses expressing this reporter, followed by application of the Ca2+ ionophore ionomycin, which elevates Ca2+ in all synapses (Fig. 7A). These experiments revealed that, as with exocytosis, a fraction of nerve terminals fail to show any Ca2+ signal in response to 1AP stimulation (Fig. 7A,B) but were unmasked by blockade of CDK5 activity with roscovitine. Conversely, some synapses that showed a robust AP-triggered Ca2+ signal under control conditions could be completely silenced after inhibition of CN with CSA (Fig. 7A,B). On average, we found that ∼10–15% of all boutons sampled failed to show any Ca2+ signal and that approximately half of these were unmasked with CDK5 blockade, whereas greater than ∼35% of boutons became silent after CN inhibition (Fig. 7C). Similar results were obtained using MgGreen-AM loading of VAMP2–mCh-expressing nerve terminals (Fig. 7D). These data imply that a fraction of nerve terminals rely solely on Cav2.2 because they were silent originally and converted to a functional state by CDK5 inhibition. We tested this hypothesis by examining what fraction of boutons are silent after addition of conotoxin and a combination of conotoxin and the CDK5 inhibitor roscovitine. These experiments showed that the proportion of silent boutons increases significantly after conotoxin treatment and that these boutons are now refractory to CDK5 blockade (Fig. 7E). In contrast, although the fraction of silent boutons increases after agatoxin treatment, this fraction decreases after CDK5 blockade (Fig. 7E). Thus, the balance of activity between CNAα and CDK5 exerts a potent influence on VGCC function, which results in a complete silencing at the level of some nerve terminals, ones that contained primarily Cav2.2 channels.
Figure 7.
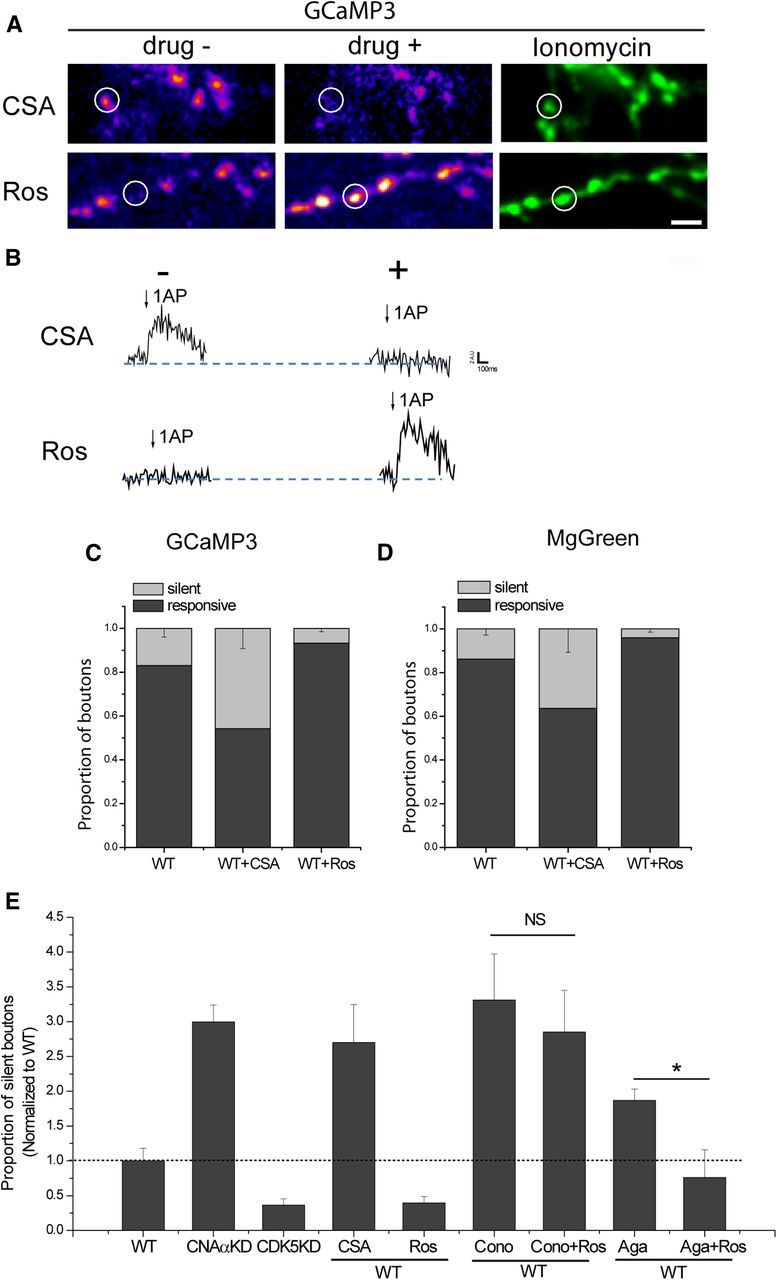
CNAα and CDK5 gate silent presynaptic boutons by controlling Ca2+ influx. A, Representative 1AP GCaMP3 difference image (ΔF1AP) in WT neurons in the absence or presence of CSA (top) or roscovitine (Ros) (bottom). Ionomycin treatment (right) reveals all presynaptic boutons. White circles indicate boutons that were silenced after treatment with CSA (top) or unsilenced after treatment of Ros (bottom). Scale bar, 5 μm. B, Corresponding traces of silenced (white circle in A, top) and unsilenced (white circle in A, bottom) boutons with or without treatment of CSA or Ros. C, Histogram of the fraction of silent and responsive boutons measured by GCaMP3 in WT with or without CSA or roscovitine: WTsilent = 0.17 ± 0.04, WTresponsive = 0.83 ± 0.04 (n = 25), WT + CSAsilent = 0.46 ± 0.09, WT + CSAresponsive = 0.54 ± 0.09 (n = 9), WT + Rossilent = 0.07 ± 0.02, and WT + Rosresponsive = 0.93 ± 0.02 (n = 16). D, Histogram of the proportion of silent and responsive boutons measured by MgGreen in WT with or without CSA or Ros. The division of silent or responsive boutons was based on a signal-to-noise ratio of 1 (peak vs SD of baseline) for the 1AP response: WTsilent = 0.14 ± 0.03, WTresponsive = 0.86 ± 0.03 (n = 19), WT + CSAsilent = 0.36 ± 0.11, WT + CSAresponsive = 0.64 ± 0.11 (n = 7), WT + Rossilent = 0.04 ± 0.02, and WT + Rosresponsive = 0.96 ± 0.02 (n = 10). E, Histogram of the fraction of silent boutons measured by GCaMP3 and normalized to fraction of WT silent boutons in WT, CNAαKD, CDK5KD, WT with/without CSA or roscovitine, and WT with ω-conotoxin GVIA (Cono) or ω-agatoxin IVA (Aga) with/without roscovitine: WT = 1.0 ± 0.18 (n = 25), CNAαKD = 3.00 ± 0.24 (n = 26), CDK5KD = 0.36 ± 0.09 (n = 12), WT + CSA = 2.70 ± 0.54 (n = 9), WT + Ros = 0.40 ± 0.09 (n = 16), WT + Cono = 3.31 ± 0.66, WT + Cono + Ros = 2.85 ± 0.60 (n = 7), WT + Aga = 1.87 ± 0.16, and WT + Aga + Ros = 0.76 ± 0.40 (n = 8).
Discussion
We recently demonstrated that CDK5 and CN activities control what fraction of synaptic vesicles at nerve terminals partition into recycling or resting synaptic vesicle pools. These experiments revealed that these enzymes additionally control AP-triggered exocytosis efficiency for those vesicles in the recycling pool. The experiments we present here demonstrated that these enzymes are constantly in balance to control Ca2+ influx triggered by AP stimulation at synapses and have revealed a potent new form of synaptic transmission modulation that operates down to the 1AP level. Neurotransmitter release can in principle be controlled at several levels. Given the cooperativity of Ca2+ action in exocytosis, modulation of Ca2+ influx at the active zone of presynaptic terminals is a potent mechanism to influence neurotransmitter release and is considered one of the main mechanisms by which presynaptic metabotropic modulation is achieved (Agler et al., 2005; Tedford and Zamponi, 2006). We tested the hypothesis that CDK5 and CN were controlling the efficacy of AP-triggered exocytosis through modulation of Ca2+ influx by measuring Ca2+ influx at nerve terminals in which the activity of these enzymes had been curtailed by pharmacological or shRNA-based KD. The pharmacological experiments showed that these enzyme functions can control Ca2+ entry on relatively short timescales (minutes). Furthermore, the impact of the pharmacological blockade on calcium influx was very similar to that of the KDs, and the KDs were insensitive to additional pharmacological inhibition verifying the specificity of the drug action. Roscovitine in particular had been implicated in directly modifying VGCC function independent of CDK5 (Yan et al., 2002). However, these studies examined roscovitine effects only in the absence of one of the cyclins of CDK5, not in the absence of CDK5. Our results demonstrate that an off-target modulation of VGCCs by roscovitine is unlikely because ablation of CDK5 fully mimics the effect of roscovitine on Cav2.2 and occludes additional modulation by this drug.
Homeostatic synaptic plasticity is a well-established control mechanism for synaptic transmission in neural circuits (Davis, 2006), and both presynaptic and postsynaptic efficacy can be retuned in response to chronic changes of neural activity via different molecular mechanisms (Ehlers, 2003; Müller et al., 2011). Previously, we showed that long-term suppression of neuronal activity caused loss of CDK5 activity and by doing so increases the size of the releasable vesicle pool (Kim and Ryan, 2010). Recently, Zhao et al. (2011) reported that chronic neuronal inhibition potentiated presynaptic Ca2+ influx and release probability. The results we show here, along with our previous observation, suggest that chronic neuronal activity, through control of CDK5 levels, modulates AP-driven Ca2+ influx at nerve terminals.
Our quantitative measurements of the control of 1AP-triggered Ca2+ entry and exocytosis by CNAα and CDK5 inhibition are in excellent agreement with previously published measurements of how vesicle fusion probability varies with changes in Ca2+ influx (Ariel and Ryan, 2010). Thus, one can accurately attribute all of the effects of CNAα or CDK5 modulation of 1AP exocytosis to their impact on Ca2+ influx (Fig. 4E). Our previous examination of the functions of these enzymes in nerve terminals revealed that they control partitioning of vesicles into resting and recycling pools (Kim and Ryan, 2010). This activity we believe is separate from the control of Ca2+ influx, because explicitly changing Ca2+ influx does not change resting and recycling pool sizes (Fernandez-Alfonso and Ryan, 2008). Furthermore, application of conotoxin that eliminates Cav2.2 function does not affect recycling vesicle pool sizes nor does it interfere with ability to increase recycling vesicle pools by blocking CDK5 (data not shown). However, given that CN is modulated by intracellular Ca2+, the potent control of Ca2+ entry by CN demonstrates that CN acts in a positive feedback loop that could potentially lead to all-or-none-type behavior in synaptic performance.
Our analysis of the CN isoform specificity led to a very surprising finding. CN function has been well documented across many biological systems and is most famously the target of therapeutic immunosuppression with CSA or FK506. These drugs work by forming a ternary complex with CN (CNA and CNB) and either cyclophilin (for CSA) or an immunophilin (for FK506). We found that both α and β isoforms of CNA are present in nerve terminals, but only the α isoform appears to function in the control of VGCC-mediated Ca2+ influx: ablation of CNAα expression and not CNAβ led to suppression of Ca2+ influx, and ablation of CNAα expression also eliminated sensitivity of Ca2+ influx to CSA. Thus, these isoforms are not redundant and appear to serve distinct functions. Previously, these two CNA isoforms have been reported to serve similar functions in different brain regions based on knock-outs of the individual genes (Sun et al., 2010). Although no measure of VGCC activity in these knock-outs was reported, it is possible that compensatory upregulation of VGCCs was occurring given that genetic ablation of specific VGCC pore-forming subunits is known to lead to direct upregulation of alternate pore-forming subunits (Inchauspe et al., 2004).
At nerve terminals, the most prominent known targets of CDK5 and CN are endocytic proteins, such as dynamin, amphiphysin, and synaptojanin, named dephosphins, so named because they become dephosphorylated by CN during activity (Cousin and Robinson, 2001). The physiological role of this dephosphorylation in controlling endocytosis has been difficult to determine precisely, although the biochemical consequence of the dephosphorylation of dynamin are better understood (Anggono et al., 2006). In retrospect, a difficulty associated with studies using inhibition of these enzymes was likely the perturbation of Ca2+ flux, which in turn will have pleiotropic effects beyond controlling CN.
Although N-type channels were recently demonstrated to be substrates for CDK5-mediated phosphorylation in vitro (Su et al., 2012), our results come to opposite conclusions than would be predicted by that work regarding how CN and CDK5 would in turn influence presynaptic function. The reasons for these differences are unclear. The most parsimonious explanation for the discrepancy is that, although CDK5 may be capable of phosphorylating the previously identified sites, in the physiological context, they might be overridden by other factors controlled by CDK5 and CN that also influence calcium influx. The functional expression of VGCCs at nerve terminals requires several steps, including a chaperone-mediated exit from the endoplasmic reticulum, axonal transport, and trafficking from a local presynaptic endosome to the presynaptic plasma membrane. We recently demonstrated that successful integration of VGCCs into active zones to drive exocytosis requires the integrity and participation of the α2δ subunit (Hoppa et al., 2012). In the work by Su et al. (2012), the evidence for the role of the eight identified serines in Cav2.2 in synaptic function was based on a loss of function driven by mutating these sites to alanine. If in the context of the nerve terminal these sites are not normally substrates for CDK5 and if mutations at such sites prevented correct trafficking to the active zone, it would have simply led to a loss of synapse function as reported. However, the previous work did not examine the impact of modulation of synaptic function by CDK5 or CN. In contrast, the work we present here suggests that, in situ, other CDK5 phosphorylation sites (either on Cav2.2 or another protein) dominate in control of Cav2.2 function.
Our studies demonstrated that, in situ, VGCCs are tightly controlled by the enzymatic activities of CN and CDK5 and that these enzymes set the “tone” of Cav2.2 function. Therefore, Cav2.2 channels act as key integrators of these two opposing enzymatic activities. At some synapses, this leads to complete silencing of presynaptic exocytosis. The switch-like behavior of CNAα/CDK5 modulation of calcium entry in a subset of synapses may represent an arbitrary signal-to-noise-driven cutoff of the definition of “silent.” However, the signals were based on robust averaging of ∼15 trials imposing a generous 1 SD over baseline noise cutoff. However, given the nonlinear coupling of calcium influx and exocytosis, it does provide a good explanation for the switch-like behavior of CNAα/CDK5 modulation of exocytosis seen previously (Kim and Ryan, 2010).
The full range of control of Cav2.2 by these enzymes results in profound impact on synaptic function, corresponding to an approximately sevenfold change in exocytosis. The ubiquitous presence of these enzymes through the brain and the essential role that Ca2+ influx plays in controlling synaptic transmission suggest that this pathway likely serves as an important modulator of synaptic transmission throughout the CNS. One of the important areas for future studies will be to understand how CDK5 itself is modulated either directly or by modifications of its known activating cyclins.
Footnotes
This work was supported in part by National Institutes of Health Grants NS036942 and MH085783 (T.A.R.) and a sponsored research agreement with Galenea Corp. (Cambridge, MA). T.A.R. is a consultant with Galena Corp., which provided some financial support for the work reported here. We thank Jeremy Dittman and members of the Ryan laboratory for valuable discussions. We thank Ricky Kwan, Yogesh Gerra, and Julia Marrs for excellent technical assistance. vG–pH was a gift from Rob Edwards and Susan Voglamaier (University of California, San Francisco, San Francisco, CA), and physin–GCaMP3 was a gift from Loren Looger (Howard Hughes Medical Institute, Janelia Farms, Ashburn, VA).
References
- Agler HL, Evans J, Tay LH, Anderson MJ, Colecraft HM, Yue DT. G protein-gated inhibitory module of N-type (ca(v)2.2) Ca2+ channels. Neuron. 2005;46:891–904. doi: 10.1016/j.neuron.2005.05.011. [DOI] [PubMed] [Google Scholar]
- Anggono V, Smillie KJ, Graham ME, Valova VA, Cousin MA, Robinson PJ. Syndapin I is the phosphorylation-regulated dynamin I partner in synaptic vesicle endocytosis. Nat Neurosci. 2006;9:752–760. doi: 10.1038/nn1695. [DOI] [PMC free article] [PubMed] [Google Scholar]
- Ariel P, Ryan TA. Optical mapping of release properties in synapses. Front Neural Circuits. 2010;4 doi: 10.3389/fncir.2010.00018. pii.18. [DOI] [PMC free article] [PubMed] [Google Scholar]
- Ariel P, Hoppa MB, Ryan TA. Intrinsic variability in Pv, RRP size, Ca2+ channel repertoire, and presynaptic potentiation in individual synaptic boutons. Front Synaptic Neurosci. 2012;4:9. doi: 10.3389/fnsyn.2012.00009. [DOI] [PMC free article] [PubMed] [Google Scholar]
- Bibb JA, Snyder GL, Nishi A, Yan Z, Meijer L, Fienberg AA, Tsai LH, Kwon YT, Girault JA, Czernik AJ, Huganir RL, Hemmings HC, Jr, Nairn AC, Greengard P. Phosphorylation of DARPP-32 by Cdk5 modulates dopamine signalling in neurons. Nature. 1999;402:669–671. doi: 10.1038/45251. [DOI] [PubMed] [Google Scholar]
- Cousin MA, Robinson PJ. The dephosphins: dephosphorylation by calcineurin triggers synaptic vesicle endocytosis. Trends Neurosci. 2001;24:659–665. doi: 10.1016/S0166-2236(00)01930-5. [DOI] [PubMed] [Google Scholar]
- Cruz JC, Tsai LH. Cdk5 deregulation in the pathogenesis of Alzheimer's disease. Trends Mol Med. 2004;10:452–458. doi: 10.1016/j.molmed.2004.07.001. [DOI] [PubMed] [Google Scholar]
- Davis GW. Homeostatic control of neural activity: from phenomenology to molecular design. Annu Rev Neurosci. 2006;29:307–323. doi: 10.1146/annurev.neuro.28.061604.135751. [DOI] [PubMed] [Google Scholar]
- Dhavan R, Tsai LH. A decade of CDK5. Nat Rev Mol Cell Biol. 2001;2:749–759. doi: 10.1038/35096019. [DOI] [PubMed] [Google Scholar]
- Ehlers MD. Activity level controls postsynaptic composition and signaling via the ubiquitin-proteasome system. Nat Neurosci. 2003;6:231–242. doi: 10.1038/nn1013. [DOI] [PubMed] [Google Scholar]
- Fernandez-Alfonso T, Ryan TA. A heterogeneous “resting” pool of synaptic vesicles that is dynamically interchanged across boutons in mammalian CNS synapses. Brain Cell Biol. 2008;36:87–100. doi: 10.1007/s11068-008-9030-y. [DOI] [PMC free article] [PubMed] [Google Scholar]
- Gupta A, Tsai LH. Cyclin-dependent kinase 5 and neuronal migration in the neocortex. Neurosignals. 2003;12:173–179. doi: 10.1159/000074618. [DOI] [PubMed] [Google Scholar]
- Hoppa MB, Lana B, Margas W, Dolphin AC, Ryan TA. α2δ expression sets presynaptic calcium channel abundance and release probability. Nature. 2012;486:122–125. doi: 10.1038/nature11033. [DOI] [PMC free article] [PubMed] [Google Scholar]
- Inchauspe CG, Martini FJ, Forsythe ID, Uchitel OD. Functional compensation of P/Q by N-type channels blocks short-term plasticity at the calyx of held presynaptic terminal. J Neurosci. 2004;24:10379–10383. doi: 10.1523/JNEUROSCI.2104-04.2004. [DOI] [PMC free article] [PubMed] [Google Scholar]
- Kim SH, Ryan TA. Synaptic vesicle recycling at CNS snapses without AP-2. J Neurosci. 2009;29:3865–3874. doi: 10.1523/JNEUROSCI.5639-08.2009. [DOI] [PMC free article] [PubMed] [Google Scholar]
- Kim SH, Ryan TA. CDK5 serves as a major control point in neurotransmitter release. Neuron. 2010;67:797–809. doi: 10.1016/j.neuron.2010.08.003. [DOI] [PMC free article] [PubMed] [Google Scholar]
- Klee CB, Ren H, Wang X. Regulation of the calmodulin-stimulated protein phosphatase, calcineurin. J Biol Chem. 1998;273:13367–13370. doi: 10.1074/jbc.273.22.13367. [DOI] [PubMed] [Google Scholar]
- Kwon YT, Tsai LH. The role of the p35/cdk5 kinase in cortical development. Results Probl Cell Differ. 2000;30:241–253. doi: 10.1007/978-3-540-48002-0_10. [DOI] [PubMed] [Google Scholar]
- Malleret G, Haditsch U, Genoux D, Jones MW, Bliss TV, Vanhoose AM, Weitlauf C, Kandel ER, Winder DG, Mansuy IM. Inducible and reversible enhancement of learning, memory, and long-term potentiation by genetic inhibition of calcineurin. Cell. 2001;104:675–686. doi: 10.1016/S0092-8674(01)00264-1. [DOI] [PubMed] [Google Scholar]
- Meijer L, Borgne A, Mulner O, Chong JP, Blow JJ, Inagaki N, Inagaki M, Delcros JG, Moulinoux JP. Biochemical and cellular effects of roscovitine, a potent and selective inhibitor of the cyclin-dependent kinases cdc2, cdk2 and cdk5. Eur J Biochem. 1997;243:527–536. doi: 10.1111/j.1432-1033.1997.t01-2-00527.x. [DOI] [PubMed] [Google Scholar]
- Müller M, Pym EC, Tong A, Davis GW. Rab3-GAP controls the progression of synaptic homeostasis at a late stage of vesicle release. Neuron. 2011;69:749–762. doi: 10.1016/j.neuron.2011.01.025. [DOI] [PMC free article] [PubMed] [Google Scholar]
- Odajima J, Wills ZP, Ndassa YM, Terunuma M, Kretschmannova K, Deeb TZ, Geng Y, Gawrzak S, Quadros IM, Newman J, Das M, Jecrois ME, Yu Q, Li N, Bienvenu F, Moss SJ, Greenberg ME, Marto JA, Sicinski P. Cyclin E constrains Cdk5 activity to regulate synaptic plasticity and memory formation. Dev Cell. 2011;21:655–668. doi: 10.1016/j.devcel.2011.08.009. [DOI] [PMC free article] [PubMed] [Google Scholar]
- Ryan TA. Inhibitors of myosin light chain kinase block synaptic vesicle pool mobilization during action potential firing. J Neurosci. 1999;19:1317–1323. doi: 10.1523/JNEUROSCI.19-04-01317.1999. [DOI] [PMC free article] [PubMed] [Google Scholar]
- Su SC, Seo J, Pan JQ, Samuels BA, Rudenko A, Ericsson M, Neve RL, Yue DT, Tsai LH. Regulation of N-type voltage-gated calcium channels and presynaptic function by cyclin-dependent kinase 5. Neuron. 2012;75:675–687. doi: 10.1016/j.neuron.2012.06.023. [DOI] [PMC free article] [PubMed] [Google Scholar]
- Sun T, Wu XS, Xu J, McNeil BD, Pang ZP, Yang W, Bai L, Qadri S, Molkentin JD, Yue DT, Wu LG. The role of calcium/calmodulin-activated calcineurin in rapid and slow endocytosis at central synapses. J Neurosci. 2010;30:11838–11847. doi: 10.1523/JNEUROSCI.1481-10.2010. [DOI] [PMC free article] [PubMed] [Google Scholar]
- Takahashi T, Momiyama A. Different types of calcium channels mediate central synaptic transmission. Nature. 1993;366:156–158. doi: 10.1038/366156a0. [DOI] [PubMed] [Google Scholar]
- Tedford HW, Zamponi GW. Direct G protein modulation of Cav2 calcium channels. Pharmacol Rev. 2006;58:837–862. doi: 10.1124/pr.58.4.11. [DOI] [PubMed] [Google Scholar]
- Tian L, Hires SA, Mao T, Huber D, Chiappe ME, Chalasani SH, Petreanu L, Akerboom J, McKinney SA, Schreiter ER, Bargmann CI, Jayaraman V, Svoboda K, Looger LL. Imaging neural activity in worms, flies and mice with improved GCaMP calcium indicators. Nat Methods. 2009;6:875–881. doi: 10.1038/nmeth.1398. [DOI] [PMC free article] [PubMed] [Google Scholar]
- Yan Z, Chi P, Bibb JA, Ryan TA, Greengard P. Roscovitine: a novel regulator of P/Q-type calcium channels and transmitter release in central neurons. J Physiol. 2002;540:761–770. doi: 10.1113/jphysiol.2001.013376. [DOI] [PMC free article] [PubMed] [Google Scholar]
- Zeng H, Chattarji S, Barbarosie M, Rondi-Reig L, Philpot BD, Miyakawa T, Bear MF, Tonegawa S. Forebrain-specific calcineurin knockout selectively impairs bidirectional synaptic plasticity and working/episodic-like memory. Cell. 2001;107:617–629. doi: 10.1016/S0092-8674(01)00585-2. [DOI] [PubMed] [Google Scholar]
- Zhao C, Dreosti E, Lagnado L. Homeostatic synaptic plasticity through changes in presynaptic calcium influx. J Neurosci. 2011;31:7492–7496. doi: 10.1523/JNEUROSCI.6636-10.2011. [DOI] [PMC free article] [PubMed] [Google Scholar]