

Abstract
Bifunctional nanoarrays were created to simulate the immunological synapse and probe the T-cell immune response at the single-molecule level. Sub-5 nm AuPd nanodot arrays were fabricated using both e-beam and nanoimprint lithography. The nanoarrays were then functionalized by two costimulatory molecules: antibody UCHT1 Fab, which binds to the T-cell receptor (TCR) and activates the immune response, bound to metallic nanodots; and intercellular adhesion molecule-1, which enhances cell adhesion, on the surrounding area. Initial T-cell experiments show successful attachment and activation on the bifunctional nanoarrays. This nanoscale platform for single-molecule control of TCR in living T-cells provides a new approach to explore how its geometric arrangement affects T-cell activation and behavior, with potential applications in immunotherapy. This platform also serves as a general model for single-molecule nanoarrays where more than one molecular species is required.
INTRODUCTION
In the immune recognition process, surface proteins on T-cells along with their corresponding ligands on antigen-presenting cells (APCs) become organized into a spatially patterned microscale motif, known as the immunological synapse (IS).1, 2 The specific geometric aspect of the T-cell-APC intercellular contact has triggered major research efforts in imaging the immune response, with significant potential applications in immunotherapy.1 Since the IS displays a clear pattern of adhesion, costimulatory, and signaling molecules, T-cells should be extremely sensitive to the arrangement of these molecules at the nanoscale. This was demonstrated by Mossman et al.,3 who used artificial APC surfaces formed in supported bilayer membranes with 100 nm wide chromium lines to modulate IS patterns in living T-cells, revealing prolonged signaling from T-cell receptor (TCR) clusters that had been mechanically trapped by the barriers in the peripheral regions. In order to further study the underlying molecular mechanism and functions of the IS, a nanoscale platform is needed to control its arrangement at the single-molecule level. Such a platform can also be used to determine the minimum spatial requirements, in terms of number of TCR molecules and their spatial arrangement, for eliciting an immune response.
We have developed a technique which combines molecular-scale nanolithography with site-selective biochemistry to create biomimetic arrays of individual protein binding sites. This technique has previously been used to explore how the geometric organization of extracellular matrix binding ligands affects cell adhesion and spreading.4, 5 Cell spreading assays on arrays of different geometric arrangements revealed a dramatic increase in spreading efficiency when at least four liganded sites were spaced within 60 nm or less, thus identifying a minimal matrix adhesion unit for fibronectin defined in space and stoichiometry.6 This technique is now applied to build a nanoscale platform for single-molecule control of TCR in living T-cells, and explore the minimal requirement for T-cell activation.
BIFUNCTIONAL NANOARRAY STRUCTURE
The IS is a specialized junction between a T-cell and APC during antigen recognition, which is defined by distinct spatial patterns comprising a central supramolecular activation cluster (c-SMAC), and a surrounding peripheral supramolecular activation cluster (p-SMAC).1 The c-SMAC is formed by TCRs on the T-cell and antigenic peptides bound to major histocompatibility complex molecules (pMHCs) on the APC. The p-SMAC is composed of leukocyte function associated antigen-1 (LFA-1) on the T-cell and intercellular adhesion molecule-1 (ICAM-1) on the APC. These molecular pairs operate in a costimulatory fashion, and therefore, single-molecule T-cell studies require bifunctional nanoarrays to simulate the structure of the IS, where both molecules (pMHC and ICAM-1) are presented simultaneously.
In our earlier work,4, 5, 6 a surface chemistry was formulated to form both thiol self-assembled monolayer (SAM) on metallic nanodots and polyethylene-glycol-silane (PEG-silane) SAM on the rest of the glass surface. The purpose of the PEG layer was to prevent the nonspecific binding of protein. Here, a new functionalization process was needed in order to render the PEG passivation background functionally active, so that specific molecules can be presented upon it. The overall scheme of the bifunctional arrays is shown in Fig. 1. Sub-5 nm AuPd nanodots patterned on a glass coverslip are functionalized with a biotinylated antibody (which binds to TCR) anchored to the nanodots via a streptavidin linker. The surrounding glass surface is functionalized with a his-tag ICAM-1 linked to a PEG-silane via a nickel-nitrilotriacetic acid (NTA) bridge to facilitate binding of LFA-1. In this way, the organization of TCR is controlled by the geometric arrangement of the AuPd nanodots at the single-molecule level, while the ICAM-1 molecules are uniformly distributed on the glass background to enhance T-cell adhesion.
Figure 1.
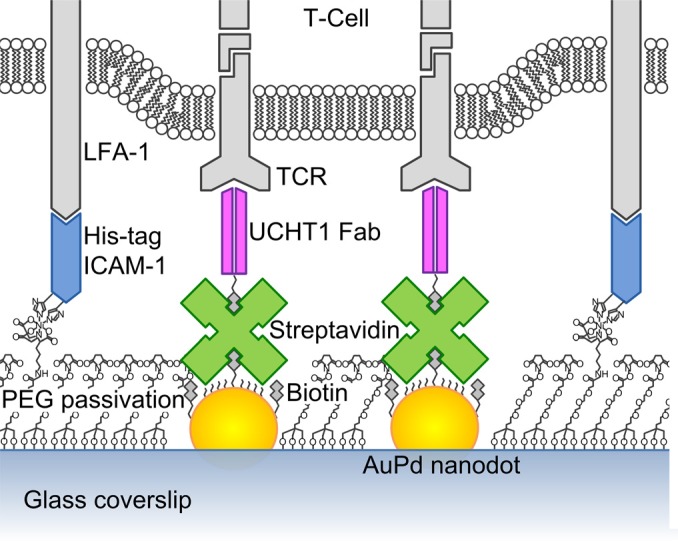
(Color online) Bifunctional nanoarray structure simulating the immunological synapse.
In order to ensure single-molecule control, AuPd nanodots were made with diameters ≲5 nm, approximately the size of a single streptavidin molecule,7 which serves as the linker to the antibody. For these experiments, the antibody UCHT1 Fab (fragment, antigen binding) was used as a single binding site of TCR, which recognizes the TCR complex and activates T-cells.8
NANOFABRICATION
The sub-5 nm metallic nanodot arrays were fabricated using a process based on both e-beam and nanoimprint lithography (NIL).9 Compared with block copolymer micelle nanolithography, an approach used for similar cell studies,10, 11 which forms only hexagonal arrangement with limited spacing variation (determined by the copolymer molecular weight), e-beam lithography is able to create arbitrary patterns with much better accuracy and a nearly unlimited number of degrees of freedom.6 Furthermore, e-beam lithography enables nanoarrays with various geometry arrangements integrated on a single sample, which not only improves the efficiency of cell assay experiments, but also enables 1:1 comparison for quantitative fluorescence microscopy12 (same experimental and imaging conditions, same fluorescence background and noise). On the other hand, because cell assay experiments also require a large number of samples with relatively large area coverage, the fast and low-cost NIL13 is used to replicate the e-beam patterns and improve throughput. The fabrication process flow is shown schematically in Fig. 2a, and described herewith.
Figure 2.
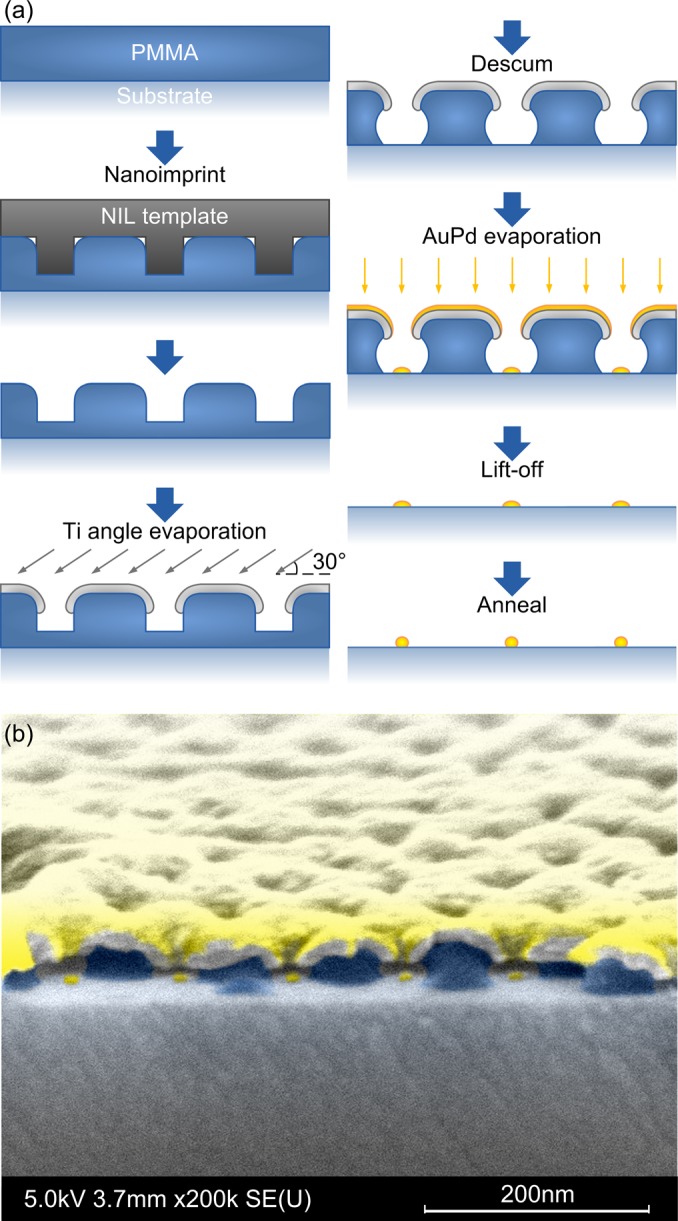
(Color online) (a) Schematic fabrication process flow. (b) SEM image of a cross section before lift-off (false color).
NIL templates were formed by patterning hydrogen silsesquioxane (HSQ, Dow Corning XR-1541), ∼25 nm thick on Si substrate, by e-beam lithography (NanoBeam nB5). The HSQ was annealed at 540° C for 1 h to improve the mechanical properties of HSQ,14 and then treated by anti-adhesion coating (Nanonex Ultra-100) to facilitate release after imprint. Standard glass coverslips (22 × 22 mm, no. 1.5) was spin-coated with ∼50 nm polymethylmethacrylate (PMMA, 35 K, Micro Resist Technology) as the imprint resist. Thermal NIL was performed at 500 psi and 180 °C for 5 min (Nanonex BX-200).
A self-aligned pattern transfer process9 [Fig. 2a] was used to create the nanoarrays. 12 nm Ti was evaporated (Semicore SC2000) at an angle of 30° to form a sacrificial hard mask. This mask protects the thin resist during descum and therefore widens the process window. The metal is also deposited on the top part of the sidewall in the imprinted opening, which reduces the feature size and forms a negative resist slope after removing the residual PMMA in oxygen plasma (Oxford PlasmaLab 80). After descum, 2 nm AuPd (60/40) with 0.6 nm Ti adhesion layer was deposited by e-beam evaporation. AuPd alloy was used because it has a smaller grain size and forms more robust films than pure Au.4 A cross-section of a sample after the two-step evaporation is shown in Fig. 2b, where the Ti hard mask, undercuts in PMMA, and AuPd dots evaporated through the openings are clearly seen. Lift-off was then performed by immersion in boiling acetone. After annealing at 540 °C for 2 h, the granular nanodots agglomerated into uniform spheres with a diameter that is a function of the size of the opening in the hard mask and the thickness of the deposited film.9
The samples were inspected by scanning electron microscopy (SEM, Hitachi 4700) during the fabrication process, as shown in Figs. 3a, 3b, 3c. Starting with ∼15–20 nm HSQ features on the NIL template, it is possible to obtain AuPd nanodots with diameters ∼5–10 nm and below.9 Atomic force microscopy (AFM, Park XE-100) was used to measure the dot height, which reasonably reflects the lateral size due to its approximate sphere shape.9 Figure 3d indicates that the nanodot size was quite uniform and ≲5 nm.
Figure 3.
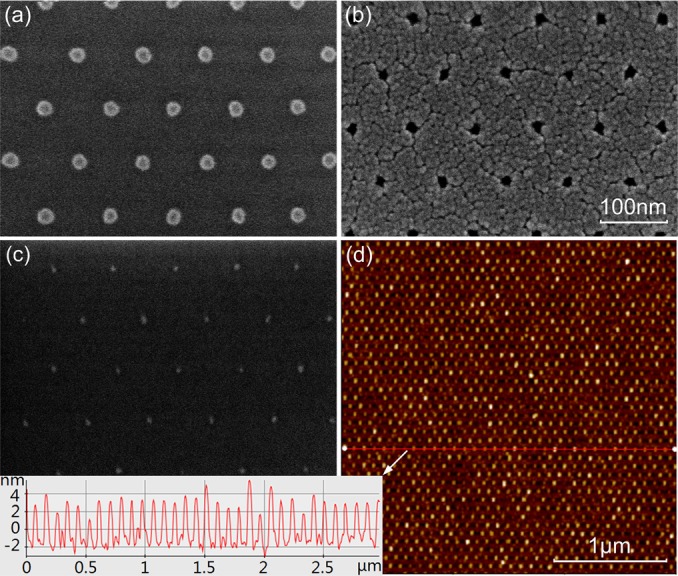
(Color online) SEM images of (a) NIL template, (b) Ti hard mask, (c) AuPd nanodot after lift-off. (d) AFM image of sub-5 nm AuPd nanodots after annealing (the inset shows nanodot height, which reasonably reflects the lateral size due to its approximate sphere shape).
BIFUNCTIONALIZATION
The AuPd nanoarrays have previously been functionalized with biomolecules such as arginylglycylaspartic acid, DNA, or quantum dots through a biotin–avidin–biotin linkage.4, 5, 6, 15, 16 In order to simulate the IS structure as in Fig. 1, a new functionalization process was developed to bind biotinylated UCHT1 Fab on AuPd nanodots and modify the PEG passivation layer by introducing NTA groups to bind his-tag ICAM-1. The bifunctionalization scheme is outlined in Fig. 4.
Figure 4.
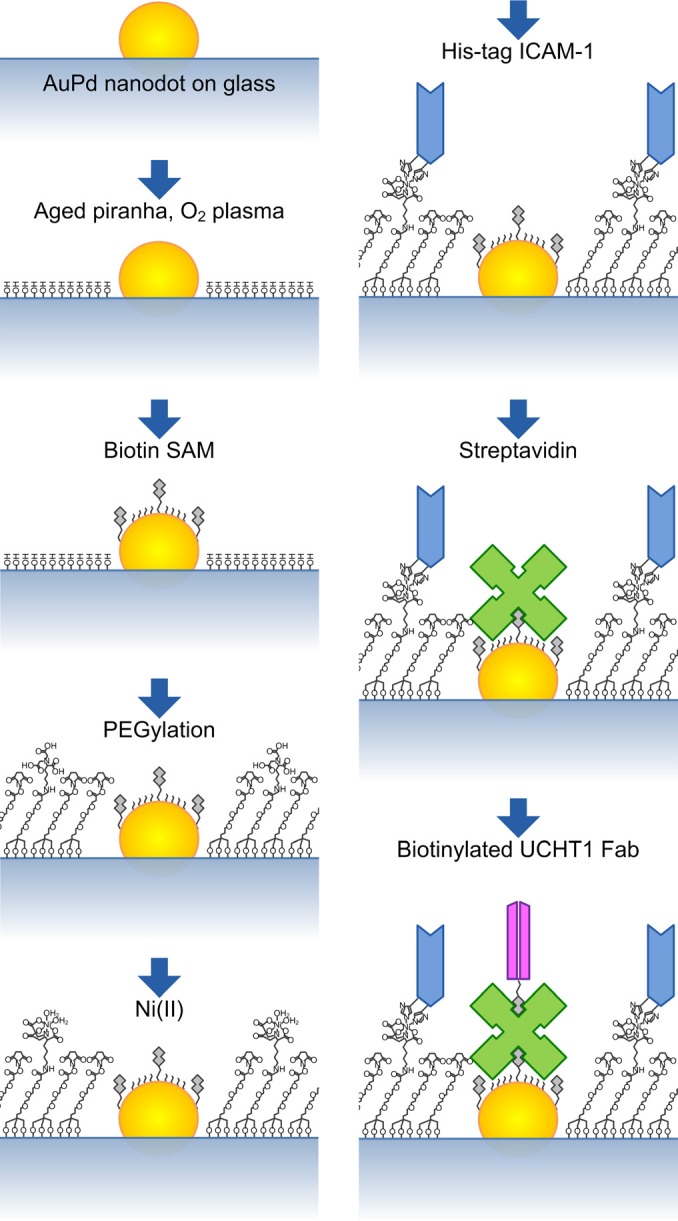
(Color online) Flow diagram of the bifunctionalization scheme.
Samples were first cleaned by immersion in 1.5 h-aged piranha4 for 3 min, followed by exposure to an oxygen plasma for 5 min. This creates hydroxyl groups on the glass surface, rendering them highly hydrophilic, which is necessary for the formation of PEG-silane monolayer. The samples were immediately incubated in 1 mM anhydrous ethanol solution of mixed HS-C11-(EG)3-biotin and HS-C11-(EG)3-OH overnight, in order to form a closely packed SAM on the AuPd presenting biotin headgroups for the immobilization of streptavidin. Meanwhile, 25 mL methanol solution of 2 mg silane-PEG-N-Hydroxysuccinimide (NHS) (5 kDa) and a slight excess NTA-L-lysine was prepared to synthesize silane-PEG-NTA, as depicted in Fig. 5.17, 18 The reaction was not sufficient and resulted in a mixture solution of silane-PEG-NHS and silane-PEG-NTA. The thiolated samples were rinsed by ethanol, dried and then incubated in the PEG solution for at least 48 h to form a monolayer on the glass. This works not only as a passivation layer against nonspecific binding, but also as a functional surface with the introduction of the NTA groups.
Figure 5.

Reaction scheme for synthesis of silane-PEG-NTA by silane-PEG-NHS and NTA-L-lysine.
In order to functionalize with the two costimulatory molecules, samples were first incubated in 40 mM aqueous NiSO4 for 1 h to adsorb Ni(II) to the NTA groups, followed by phosphate buffered saline (PBS) solution of 1 μg/mL His-tag ICAM-1 for 2 h. Then, the samples were incubated in PBS solution of 10 μg/mL streptavidin and 1 mg/mL of albumin for 30 min, followed by 2 μg/mL biotinylated UCHT1 Fab for another 30 min.
In this proof-of-principle study, hexagonal arrays with an interdot spacing of 80 nm were taken as an example to demonstrate the functionalization and biological results. Figure 6 shows the fluorescence signal with two channels of green fluorescent protein (GFP) and DsR: dsRed (one form of red fluorescent protein). Sample A [Fig. 6a] was functionalized by biotinylated UCHT1 Fab through a streptavidin linker, without his-tag ICAM-1. The streptavidin-488 in the GFP channel and the UCHT1 Fab-568 in the DsR channel displayed the same pattern of nanodot arrays (50 × 50 μm2 squares), indicating the high fidelity of the functionalization process: Streptavidin selectively binds to AuPd nanodot array, and biotinylated Fab selectively binds to streptavidin. On the other hand, sample B [Fig. 6b] was functionalized by his-tag ICAM-1-647 but UCHT1 Fab was not added to the nanodot with streptavidin-488. A same pattern of nanoarray squares was found in the GFP channel but not in the DsR channel, which confirms that ICAM-1 molecules were uniformly distributed on the PEG passivation background, without selectivity to the nanoarray. This demonstrates the formation of highly selective bifunctional surfaces which can simulate the IS structure; UCHT1 Fab on the nanodots could activate T-cell immune response and the surrounding ICAM-1 on glass substrate could enhance T-cell adhesion.
Figure 6.
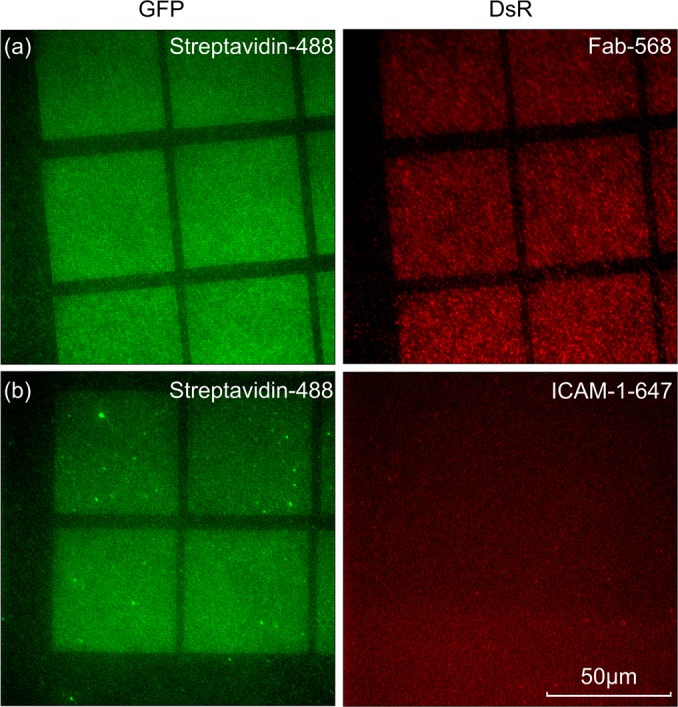
(Color online) Fluorescence microscopy of (a) sample A functionalized by streptavidin and Fab on nanodots; (b) sample B functionalized by streptavidin on nanodots and ICAM-1 on PEG passivation background.
INITIAL BIOLOGICAL RESULTS
Fresh human naive CD4+ cells, one of the two types of T-cells that participate in the adaptive immune response, were used for initial demonstration of T-cell attachment and activation. Cells were incubated on the bifunctional surfaces for 5 min and then fixed for 10 min at 37 °C in paraformaldehyde (2% in buffer: 50 mM piperazine-N,N′-bis(2-ethanesulfonic acid), 25 mM 4-(2-hydroxyethyl)-1-piperazineethanesulfonic acid, 10 mM ethylene glycol tetraacetic acid, 8 mM MgSO4, pH 7.2). Phosphorylated tyrosine (pY), an indicator of immune response signaling strength, was stained for fluorescence microscopy. Hexagonal arrays with an interdot spacing of 80 nm and an area of 200 × 200 μm2 were uniformly functionalized with UCHT1-Fab, as shown in Fig. 7a. T-cells adhered to the patterned area and were activated with high pY intensity. Meanwhile, fewer cells with lower pY intensity and less spreading were found on the PEG passivation background, which also works as a negative control. The inset of Fig. 7b shows T-cells' preference more clearly. A defective part of a nanoarray was divided into isolated patterns by scratches on this sample. In this way, cells could adhere on an area including both nanoarray and glass background. A sharp contrast of the pY signal between patterned and unpatterned parts in a single cell indicates that T-cells are selectively activated by the nanoarray.
Figure 7.
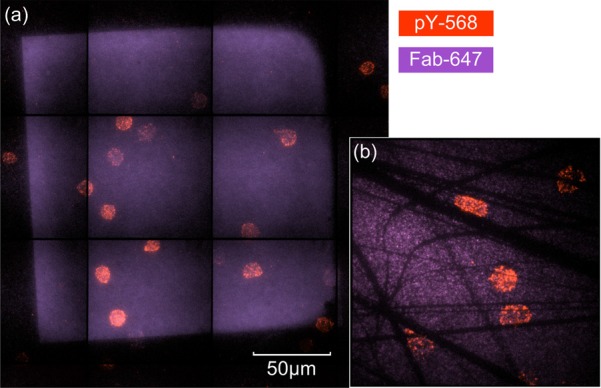
(Color online) Initial biological results: (a) 200 × 200 μm2 nanoarray functionalized by UCHT1 Fab, with T-cell attachment and activation; (b)T-cells over isolated pattern areas.
CONCLUSIONS
AuPd nanoarrays were fabricated based on both e-beam lithography and NIL. A self-aligned pattern transfer process produced ≲5 nm AuPd nanodots after metallization, lift-off, and annealing. Based on these nanoarrys on glass coverslip, a new bifunctionalization scheme was developed to mimic the IS structure and control TCR arrangement at the single-molecule level. Fluorescence microscopy results show that after bifunctionalization, the UCHT1 Fab and streptavidin linker displayed the same pattern of AuPd nanoarray, while the ICAM-1 molecules were uniformly distributed on the unpatterned glass surface. Initial biological results demonstrate that T-cells attach well and become activated on the bifunctional nanoarray. These nanoarrays will be extremely valuable for determining the minimum spatial requirements for T-cell activation.
ACKNOWLEDGMENTS
This work was supported primarily by the National Institutes of Health (NIH) Common Fund Nanomedicine program PN2 EY016586. The authors are grateful to the Columbia University CEPSR clean room for making the facilities available for this work.
References
- Davis D. M. and Dustin M. L., Trends Immunol. 25, 323 (2004). 10.1016/j.it.2004.03.007 [DOI] [PubMed] [Google Scholar]
- Friedl P. and Storim J., Trends Cell Biol. 14, 557 (2004). 10.1016/j.tcb.2004.09.005 [DOI] [PubMed] [Google Scholar]
- Mossman K. D., Campi G., Groves J. T., and Dustin M. L., Science 310, 1191 (2005). 10.1126/science.1119238 [DOI] [PubMed] [Google Scholar]
- Cherniavskaya O., Chen C. J., Heller E., Sun E., Provezano J., Kam L., Hone J., Sheetz M. P., and Wind S. J., J. Vac. Sci. Technol. B 23, 2972 (2005). 10.1116/1.2132332 [DOI] [Google Scholar]
- Schvartzman M., Nguyen K., Palma M., Abramson J., Sable J., Hone J., Sheetz M. P., and Wind S. J., J. Vac. Sci. Technol. B 27, 61 (2009). 10.1116/1.3043472 [DOI] [PMC free article] [PubMed] [Google Scholar]
- Schvartzman M., Palma M., Sable J., Abramson J., Hu X., Sheetz M. P., and Wind S. J., Nano Lett. 11, 1306 (2011). 10.1021/nl104378f [DOI] [PMC free article] [PubMed] [Google Scholar]
- Pugliese L., Coda A., Malcovati M., and Bolognesi M., J. Mol. Biol. 231, 698 (1993). 10.1006/jmbi.1993.1321 [DOI] [PubMed] [Google Scholar]
- Beverley P. C. L. and Callard R. E., Eur. J. Immunol. 11, 329 (1981). 10.1002/eji.1830110412 [DOI] [PubMed] [Google Scholar]
- Schvartzman M. and Wind S. J., Nano Lett. 9, 3629 (2009). 10.1021/nl9018512 [DOI] [PMC free article] [PubMed] [Google Scholar]
- Glass R., Möller M., and Spatz J. P., Nanotechnology 14, 1153 (2003). 10.1088/0957-4484/14/10/314 [DOI] [Google Scholar]
- Arnold M., Cavalcanti-Adam E. A., Glass R., Blummel J., Eck W., Kantlehner M., Kessler H., and Spatz J. P., Chemphyschem 5, 383 (2004). 10.1002/cphc.200301014 [DOI] [PubMed] [Google Scholar]
- Waters J. C., J. Cell Biol. 185, 1135 (2009). 10.1083/jcb.200903097 [DOI] [PMC free article] [PubMed] [Google Scholar]
- Chou S. Y., Krauss P. R., Zhang W., Guo L., and Zhuang L., J. Vac. Sci. Technol. B 15, 2897 (1997). 10.1116/1.589752 [DOI] [Google Scholar]
- Gadegaard N. and McCloy D., Microelectron. Eng. 84, 2785 (2007). 10.1016/j.mee.2007.01.122 [DOI] [Google Scholar]
- Palma M., Abramson J. J., Gorodetsky A. A., Penzo E., R. L.Gonzalez, Jr., Sheetz M. P., Nuckolls C., Hone J., and Wind S. J., J. Am. Chem. Soc. 133, 7656 (2011). 10.1021/ja201031g [DOI] [PMC free article] [PubMed] [Google Scholar]
- Abramson J., Palma M., Wind S. J., and Hone J., Adv. Mater. 24, 2207 (2012). 10.1002/adma.201104216 [DOI] [PubMed] [Google Scholar]
- Kim T. H. et al. , Angew. Chem. Int. Ed. Engl. 125, 7018 (2013). 10.1002/ange.201302181 [DOI] [Google Scholar]
- Zhen G., Falconnet D., Kuennemann E., Vörös J., Spencer N. D., Textor M., and Zürcher S., Adv. Funct. Mater. 16, 243 (2006). 10.1002/adfm.200500232 [DOI] [Google Scholar]