Abstract
Purpose: Several investigators have shown that noise equivalent count rate (NECR) is linearly proportional to the square of image signal-to-noise ratio (SNR) when PET images are reconstructed using filtered back-projection. However, to our knowledge, none have shown a similar relationship in fully 3D ordered-subset expectation maximization (OSEM) reconstruction. This paper has two aims. The first is to investigate the NECR-SNR relationship for 3D-OSEM reconstruction using phantom studies while the second aim is to evaluate the NECR-SNR relationship using patient data.
Methods: An anthropomorphic phantom was scanned on a GE Discovery-STE (DSTE) PET/CT scanner in 3D mode with an initial activity concentration of 66.34 kBq/cc. PET data were acquired over the lower chest/upper abdomen region in dynamic mode. The experiment was repeated with the same activity concentration on a GE Discovery-RX (DRX) scanner. Care was taken to place the phantom at identical positions in both scanners. PET data were then reconstructed using 3D Reprojection (3D-RP) and 3D-OSEM with different reconstruction parameters and the NECR and SNR for each frame/image were calculated. SNR2 was then plotted versus the NECR for each scanner, reconstruction method and parameters. In addition, 40 clinical PET/CT studies from the two scanners (20 patients/scanner) were evaluated retrospectively. The patient studies from each scanner were further divided into two subgroups of body mass indices (BMI). Each PET study was acquired in 3D mode and reconstructed using both 3D-OSEM and 3D-RP. The NECR and SNR of the bed position covering the patient liver were calculated for each patient and averaged for each subgroup. Comparisons of the NECR and SNR between scanner types and BMIs were performed using a t-test and a p value less than 0.05 was considered significant.
Results: Phantom results showed that SNR2 versus NECR was linear for 3D-RP reconstruction across all activity concentration on both scanners, as expected. However, when 3D-OSEM was used, this relationship was nonlinear at activity concentrations beyond the peak NECR on both scanners. On the other hand, the plot of SNR2 versus trues count rate was linear for 3D-OSEM across all activity concentrations on both scanners independent of reconstruction parameters used. In addition, for activity concentrations <30kBq/cc, phantom results showed a higher SNR (by 12 ± 10%; p < 0.05) and NECR for the DRX scanner compared to DSTE for 3D-RP reconstruction. However, for 3D-OSEM reconstruction, these two scanners had similar SNRs (different by 2% ± 9%; p > 0.05), despite having different NECRs. Patient studies showed a statistically significant difference in NECR as well as the SNR for 3D-RP reconstruction between the two scanners. However, no statistically significant difference was found for 3D-OSEM. A statistically significant difference in both NECR and SNR were found between the different BMI subgroups for both 3D-RP and 3D-OSEM reconstructions.
Conclusions: For the scanners and reconstruction algorithm used in this study, our results suggest that the image SNR cannot be predicted by the NEC when using 3D-OSEM reconstruction particularly for those clinical applications requiring high activity concentration. Instead, our results suggest that image SNR varies with activity concentration and is dominated by the 3D-OSEM reconstruction algorithm and its associated parameters, while not being affected by the scanner type for the range of activity concentrations usually found in the clinic.
Keywords: PET, noise equivalent count rate, signal-to-noise ratio, image quality
INTRODUCTION
PET imaging with fluorine-18 fluorodeoxyglucose (18F-FDG) is widely used in clinical oncology to facilitate patient diagnosis in a wide variety of cancers.1, 2, 3 However, this modality has been characterized by relatively low image quality4 particularly due to its low sensitivity and the acquisition of random and scatter coincidences during the imaging process. To assess the image quality of PET scanners, the metric noise equivalent count rate (NECR) has been proposed.5 The NECR is determined from the PET raw emission data, and is used as a good indicator of the image quality because it takes into account the effects introduced by scatter and random coincidences.5, 6, 7
Several groups have investigated the behavior of NECR while using various acquisition parameters, with the goal of obtaining the optimal value of each parameter to achieve the highest NECR. Badawi et al.8 attempted to optimize the NECR for different phantom sizes, activity in the field of view, lower energy discriminator level, and acquisition mode. Surti et al.9 evaluated the impact of phantom diameter and scanner type on the NECR. The effect of injected dose on NECR was also evaluated by several other groups10, 11, 12 to optimize the injected dose for patients of different weight or body mass index (BMI). In all these studies,8, 9, 10, 11, 12 the authors optimized the statistical quality of the data by maximizing the NECR. However, the NECR is a metric that represents PET raw emission data and, therefore, may introduce potential bias when correlated to the quality of reconstructed images, since the NECR does not account for the noise correlations introduced by reconstruction algorithms.
The signal-to-noise ratio (SNR) is another widely accepted metric that characterizes PET image quality. SNR is derived from image statistics rather than raw data which are needed for NECR calculation. SNR reflects the relative signal level with respect to the noise of the reconstructed image and, thereby, the ability of PET to detect tumors.13, 14, 15 Strother et al.5 and later Watson et al.16 showed that the square of the SNR is linearly proportional to the NECR for 3D acquisition reconstructed using rebinned filtered back-projection (FBP) reconstruction. Dahlbom et al.17 then showed a similar relationship when using Fourier rebinned ordered-subset expectation maximization (FORE-OSEM) reconstruction. Recently, several groups have assessed this linear relationship under various conditions. Brasse et al.18 found a linear relationship between SNR and the square-root of the NECR for two random correction methods when PET data were acquired in 3D and reconstructed using FORE-FBP and FORE-OSEM. El Fakhri et al.19 found that the ratio of the square-root of the NECR of 2D and 3D at three different BMI values had a similar behavior to the SNR ratio for the two modes of PET data acquisition and reconstructed by 2D-OSEM and FORE-OSEM respectively.
Although many studies have shown that the square of the SNR is proportional to the NECR in various situations, some concerns about this relationship still exist. Wilson et al.20 suggested that the choice of reconstruction algorithm and its associated parameters could have a large effect on image quality that could not be predicted by NECR alone. Others have raised concerns about this relationship when OSEM reconstruction is used.21, 22, 23 This iterative algorithm provides a different noise propagation24, 25 as compared to FBP and such noise characteristics may affect the relationship between NECR and SNR. Badawi et al.26 pointed out that spatial resolution and reconstruction methods frequently differ between systems or acquisition modes, so the NECR might not always track image quality in a meaningful manner. Additionally, the raw data may not follow a Poisson distribution because of effects such as detector dead time;27 thus, the use of the NECR may be limited. Furthermore, the NECR does not account for possible count rate bias such as the systematic mispositioning of data because of spatial pile-up effects.28
The aim of this study is to evaluate using phantoms the relationship between the NECR and the SNR in PET imaging when a fully 3D OSEM reconstruction algorithm is applied. To our knowledge, this relationship has not been previously studied for a fully 3D OSEM reconstruction model. Another aim of this study is to evaluate the effects of the NECR-SNR relationship on patient results by analyzing patient studies with different body mass index (BMI) and scanner types. In both phantom and patient studies, linear and nonlinear reconstruction methods were used to evaluate this relationship while using various reconstruction parameters. Two different scanner designs were also included to assess the effect of detection efficiency from various detector materials on the NECR and SNR. The setup and preparation of the phantom studies are described in Sec. 2 and their results are shown in Sec. 3. Further considerations about this paper are discussed in Sec. 4. Section 5 concludes this paper.
MATERIALS AND METHODS
PET/CT scanners
DSTE scanner
This scanner consists of a full-ring of bismuth germinate oxide (BGO) detectors arranged on four rings of 70 detector blocks. Each block consists of an 8 × 6 (tangential × axial) detector elements. The detector crystal size is 4.7 × 6.3 × 30 mm3. The scanner has a trans-axial field of view (FOV) of 70 cm and a 15.7 cm axial extent. The scanner has retractable septa and can operate in both 2D and 3D modes. The energy window is 375–650 keV in 2D mode and 425–650 keV in 3D mode, while the coincident timing window width is 9.6 ns for both acquisition modes. The axial and transaxial resolution is 5.1 and 5.4 mm, respectively. The sensitivity in 2D and 3D is 2.2 and 8.4 cps/kBq, respectively. In 2D mode the peak NECR is 88 kcps at an activity concentration of 43 kBq/cc, while in 3D mode, the peak NECR is 75 kcps at an activity concentration of 13.1 kBq/cc. All measurements are based on the NEMA NU2-2007 standard. The full description and performance characteristics of this system can be found in Ref. 29.
DRX scanner
This scanner consists of a full-ring of lutetium yttrium orthosilicate (LYSO) detectors. It is arranged on four rings of 70 detector blocks. Each block is composed of a 9 × 6 (tangential × axial) detector elements. The detector crystal size is 4.2 × 6.3 × 30 mm3. The trans-axial FOV for this system is 70 cm, and the axial extent is 15.7 cm. The scanner can operate in both 2D and 3D modes. The energy window is 425–650 keV in both 2D and 3D modes, while the coincident timing window width is 5.8 ns. The axial and transaxial resolution is 4.8 and 5.1 mm, respectively. The system sensitivity in 2D and 3D is 1.7 and 7.3 cps/kBq, respectively. The peak NECR is 155 kcps at 92.1 kBq/ml in 2D and 117.7 kcps at 21.7 kBq/ml in 3D. All measurements are based on the NEMA NU2-2007 standard. The description and performance characteristics of this system can be found in Ref. 30.
Phantom studies
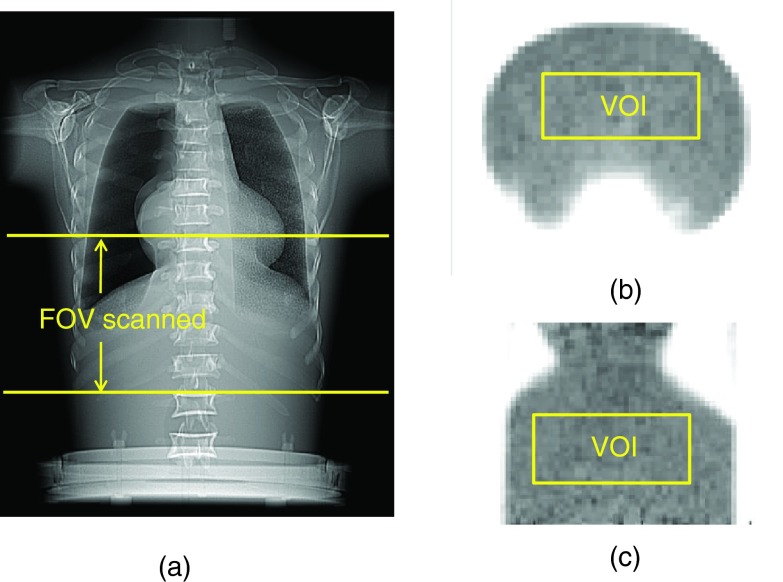
An anthropomorphic phantom (Radiology Support Device Inc., Long Beach, CA) was used in this study. The phantom was filled with F-18 water and scanned on a GE Discovery-STE (DSTE) PET/CT scanner (GE Healthcare, Waukesha, WI, USA) using 3D mode. Only one FOV was scanned, covering the lower chest and upper abdomen regions. In this regard, the acquisition contained scatter and random events from outside the FOV to emulate a real patient study, since the length of the phantom (52 cm) was greater than the axial FOV of the scanner (15.7 cm). Figure 1 illustrates the phantom and its position with the FOV of the scanner. The activity concentration in the phantom at the beginning of acquisition time was set to 66.34 kBq/cc. PET data were acquired using dynamic mode for a total of 48 frames at 3 min/frame with a 12-min delay between frames. The same experiment was then repeated using the same activity concentration on a GE Discovery-RX (DRX) scanner. The DRX scanner is similar to the DSTE system except that it has LYSO detectors compared to BGO for the DSTE system (refer to section on PET/CT scanners). Care was taken to place the phantom at identical axial and transaxial positions of both scanners to eliminate the effects of positioning on the NECR and SNR. This process was facilitated by the laser lights of the scanners and markings made on the phantom.
Figure 1.
(a) Illustration of the FOV scanned for the anthropomorphic phantom, (b) transaxial, and (c) coronal view of the PET image showing VOI drawn on the phantom.
All PET data acquisitions were corrected for attenuation, random, scatter, and dead time using manufacturer software and were reconstructed using both 3D Reprojection (3D-RP) (Ref. 31) and VuePoint HD fully 3D OSEM (3D-OSEM) (Ref. 32) algorithms with varying parameters. This 3D-OSEM algorithm incorporates the corrections for attenuation, random, and scatter coincidences inside the iterative loop to preserve the Poisson nature of the data. The reconstruction parameters used are listed in Table 1. All the images were reconstructed using 128 × 128 transaxial matrix size with a 70 cm FOV, thus having the voxel size of 5.47 × 5.47 × 3.27 mm3. For 3D-OSEM reconstruction, different numbers of subsets were used while fixing the Gaussian post filter width, as well as different filter widths while fixing the number of subsets. These reconstruction schemes were used to evaluate the robustness of the NECR-SNR relationships with regard to the reconstruction parameters. Decay correction was turned off in all reconstructions since that option corrects the activity concentration to the beginning of the dynamic scan, which causes all the frames to have the same activity concentration. Two parameters were calculated for each frame: the NECR from the raw data and the SNR from the reconstructed PET image.
Table 1.
Reconstruction algorithms and parameters.
| Reconstruction algorithms |
||
|---|---|---|
| PET/CT systems | 3D-RP | VuePoint HD fully 3D-OSEM |
| (1) 2 iterations, 14 subsets, Gaussian 6 mm filter | ||
| (2) 2 iterations, 20 subsets, Gaussian 6 mm filter | ||
| DSTE | (3) 2 iterations, 35 subsets, Gaussian 6 mm filter | |
| Transaxial filter: Hanning | (4) 2 iterations, 20 subsets, Gaussian 4 mm filter | |
| with 10.9 mm cutoff | (5) 2 iterations, 20 subsets, Gaussian 8 mm filter | |
| Axial filter: Ramp with | (1) 2 iterations, 15 subsets, Gaussian 6 mm filter | |
| 6.5 mm cutoff | (2) 2 iterations, 21 subsets, Gaussian 6 mm filter | |
| DRX | (3) 2 iterations, 35 subsets, Gaussian 6 mm filter | |
| (4) 2 iterations, 21 subsets, Gaussian 4 mm filter | ||
| (5) 2 iterations, 21 subsets, Gaussian 8 mm filter | ||
The NECR was defined by Strother et al.5 as
| (1) |
where T, S, and R are the true, scatter, and random count rates, respectively. The factor k is different for different methods of correcting random coincidences. In this investigation, random events were calculated on the basis of singles measurement; therefore, k was set to 1. Equation 1 can be rewritten as
| (2) |
where P, R, and sf are the prompts rate, randoms rate, and scatter fraction, respectively. sf is defined as S/(S + T). Prompts were defined as the sum of true, scatter, and random events. In this equation, R′ and S′ are corrected randoms and scatter rates that included only the projections that passed through the phantom. This was achieved by first determining the phantom body contour from the CT images. The contour was then used to simulate a noiseless sinogram using forward projection. The resulting sinogram was finally used to decide which projections passed through the phantom habitus. In Eq. 2, P, R, and sf are obtained from the patient's raw data which can be extracted directly from the recorded file header on the GE Discovery PET/CT scanners. T is then calculated as (P – R)*(1 – sf). R′ and S′ are calculated by multiplying the randoms and scatter rates respectively by a fraction (f) determined as the ratio of the R + S within a body mask to the total R + S in the sinogram.
The SNR for each PET image was calculated from the ratio of the mean to standard deviation of 200 randomly selected non-neighboring voxels in a fixed VOI [10 × 25 × 15 voxels as shown in Figs. 1b, 1c] drawn in the uniform background. We chose to calculate noise using this approach to reduce correlations between neighboring voxels caused by the reconstruction process.24, 33, 34 The SNR was calculated for all the images in the different dynamic frames, reconstruction algorithms, parameters, and scanner types. The SNR squared was then plotted versus the NECR for each scanner, reconstruction method, and parameter to assess their relationships. The NECR and SNR values from different frames, reconstruction algorithms, parameters, and scanners were also plotted versus activity concentration and evaluated.
Patient studies
A total of 40 patients’ PET/CT studies were evaluated retrospectively. These patients were divided into two groups of 20 patients per scanner model (DSTE and DRX). Each group of 20 patients were further divided into two BMI subgroups (small and large), giving a total of ten patients in each BMI & scanner subgroup (Table 2). The injected activity and postinjection time were kept similar among these subgroups to eliminate any potential effects of these parameters on the results of the study. None of the selected patients had a liver lesion or nonuniformity in order to minimize any bias due to differential liver uptake. An institutional retrospective chart review PA11-0820 was obtained for this study.
Table 2.
Patients information.
| Subgroup category | Number of patients | PET/CT systems | BMI (kg/m2) | Injected activity (MBq) | Postinjection time (min) |
|---|---|---|---|---|---|
| DSTE, small BMI | 10 | DSTE | 26.1 ± 1.4 | 418.1 ± 33.3 | 63.4 ± 3.3 |
| DSTE, large BMI | 10 | DSTE | 32.4 ± 2.2 | 429.2 ± 51.8 | 63.2 ± 4.5 |
| DRX, small BMI | 10 | DRX | 24.6 ± 1.5 | 436.6 ± 48.1 | 64.2 ± 4.9 |
| DRX, large BMI | 10 | DRX | 31.9 ± 1.8 | 451.4 ± 48.1 | 60.4 ± 1.0 |
PET data were acquired in 3D mode using 3 min per bed position. Images were reconstructed using 3D-OSEM (DRX: 2 iterations, 21 subsets; DSTE: 2 iterations, 20 subsets) and a postreconstruction Gaussian filter of 6 mm FWHM (clinical protocol at our institution). In addition, patients’ data were reconstructed using 3D-RP to evaluate the NECR-SNR relationship between scanners, BMIs, and reconstruction algorithms.
The NECR of the bed position covering the patient liver and the SNR in the liver were calculated for each patient. The liver was used in both cases since it represents the largest organ that is characterized by a relatively high and uniform activity concentration. NECR was determined using the same approach described in the phantom studies above. SNR, on the other hand, was calculated from the ratio of the mean to standard deviation of 50 randomly selected non-neighboring voxels in a fixed size VOI (6 × 6 × 20 voxels) drawn in the liver of each patient. The NECR and SNR calculated for each patient were then averaged for each subgroup. A comparison of patients’ NECR and SNR between different scanner types and BMIs was then performed using a t-test on the original ten patients’ data in each subgroup and a p value less than 5% was considered significant.
RESULTS
Phantom studies
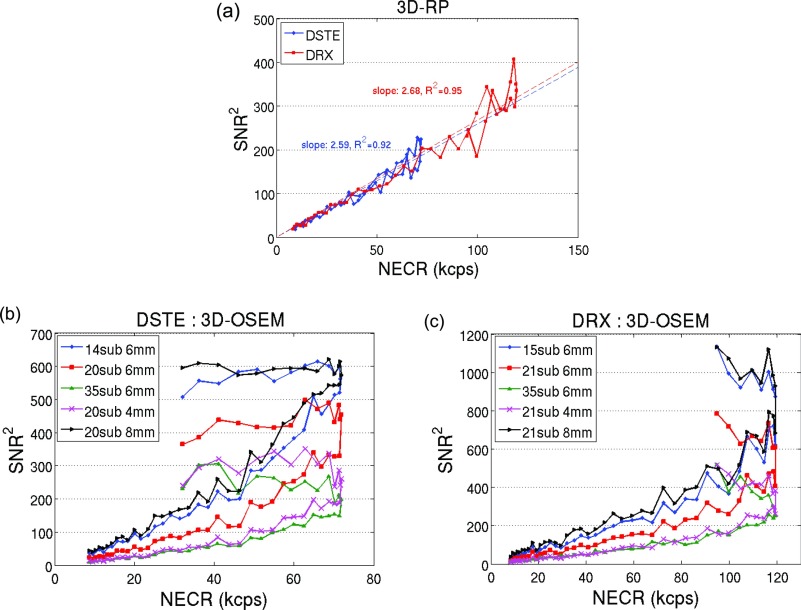
Figures 1b, 1c show the transaxial and coronal PET image of the phantom, respectively. The position of VOI drawn in the phantom to calculate SNR is also illustrated on these figures. Figures 2a, 2b, 2c show the SNR squared versus the NECR for the 3D-RP and 3D-OSEM reconstructions. Each data point in Fig. 2 corresponds to the results from one of the acquired dynamic frames. A linear correlation can be seen in Fig. 2a for the 3D-RP reconstruction. Linear curve fittings lead to r2 (coefficient of determination) of 0.92 and 0.95 for the two scanners, respectively [Fig. 2a]. However, Figs. 2b, 2c show nonlinear relationships between these two variables for the 3D-OSEM reconstruction regardless of the reconstruction parameters and scanner types. The plot shows that the square of the SNR was linearly related to the NECR before the NECR reached its peak. The NECR then decreased from its peak value at high activity concentration while the SNR squared did not track the changes of NECR, resulting in a nonlinear relationship between these two variables.
Figure 2.
SNR squared vs NECR for different scanners and reconstruction algorithms: (a) images reconstructed using 3D-RP on both scanners, (b) images reconstructed using 3D-OSEM with various subsets and filter widths on the DSTE scanner, and (c) images reconstructed using 3D-OSEM with various subsets and filter widths on the DRX scanner.
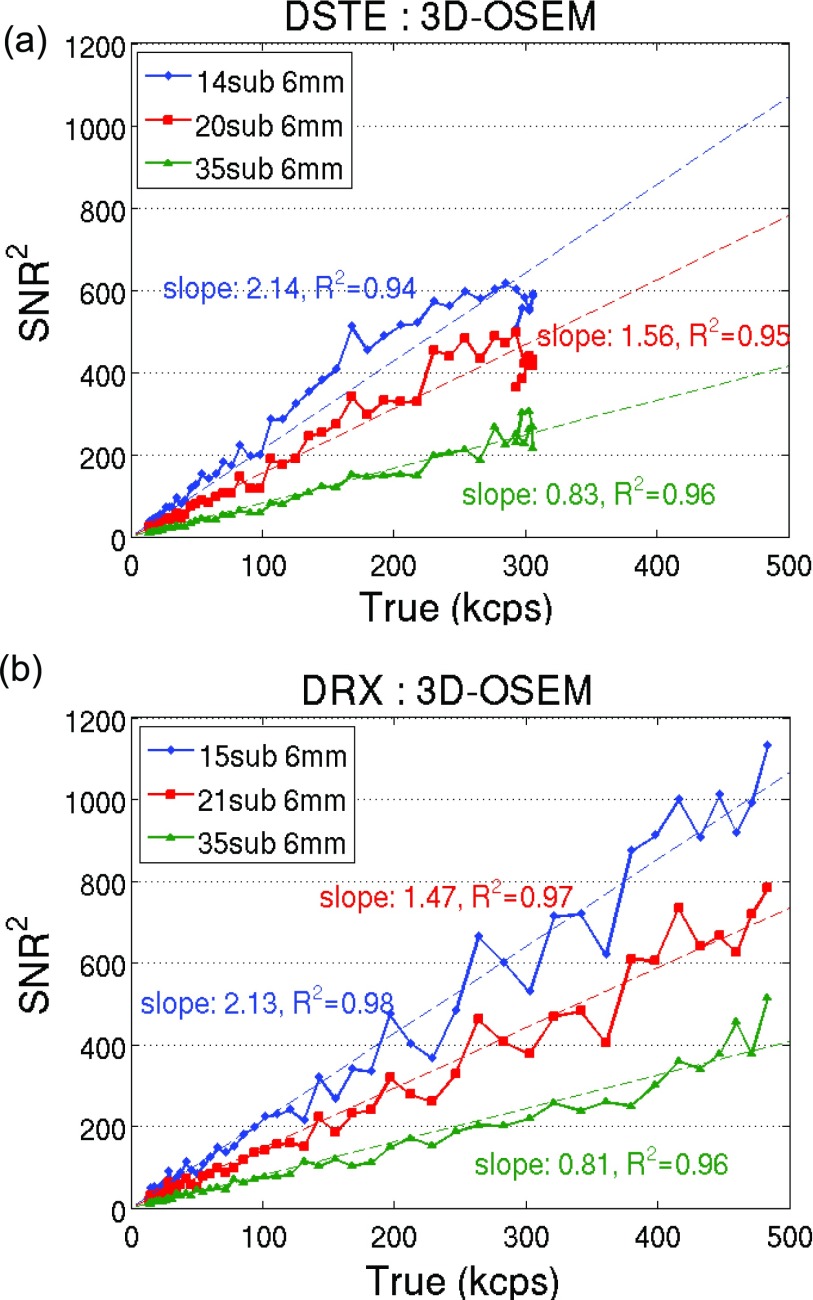
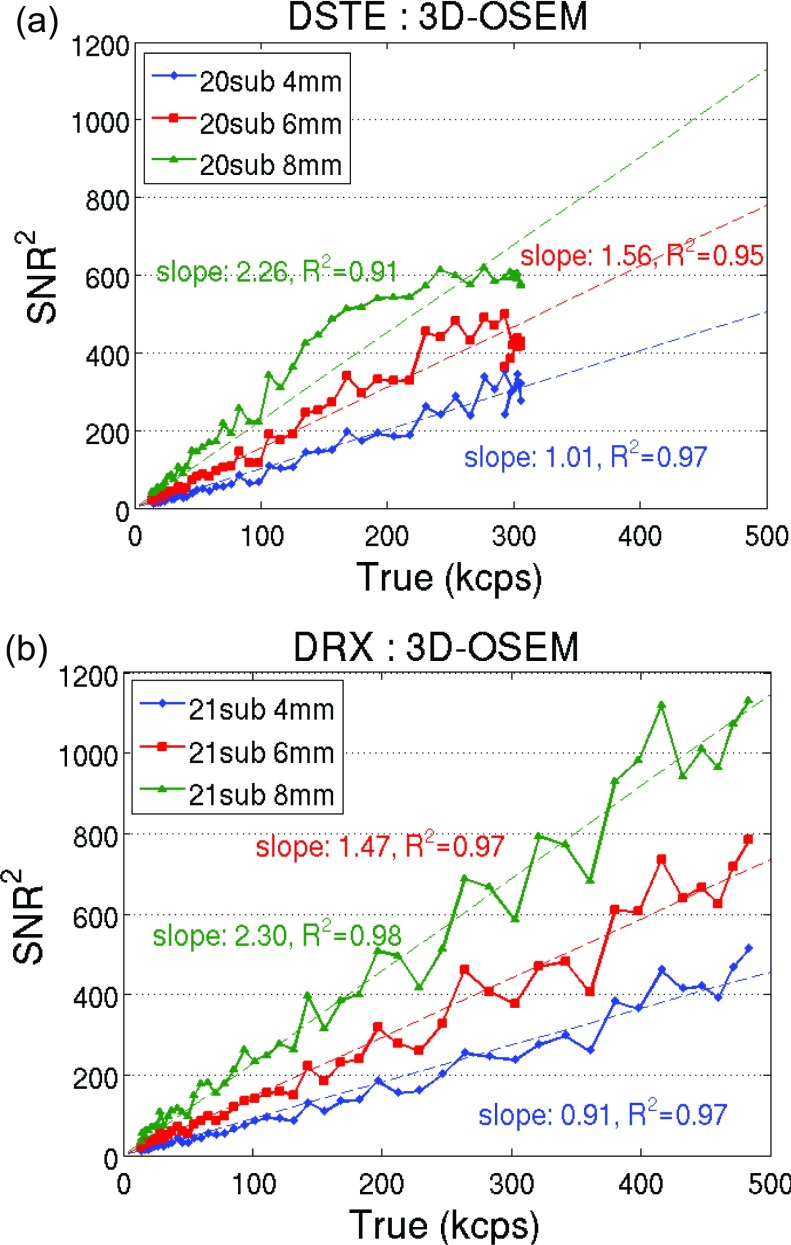
We also plotted the square of the SNR vs the trues rate in Figs. 34. Results of fixed filter width and varying subsets were plotted in Fig. 3 for the two scanners. Figure 4 shows the results of fixed subset and varying filter widths. Both figures show a dominant linear relationship between the SNR squared and the trues count rate (r2 > 0.9) when using 3D-OSEM reconstruction, regardless of the choice of scanner and reconstruction parameters.
Figure 3.
SNR squared vs the trues rate using 3D-OSEM with fixed filter width and varying subsets for (a) DSTE and (b) DRX scanner.
Figure 4.
SNR squared vs the trues rate using 3D-OSEM with fixed subset and varying filter widths for (a) DSTE and (b) DRX scanner.
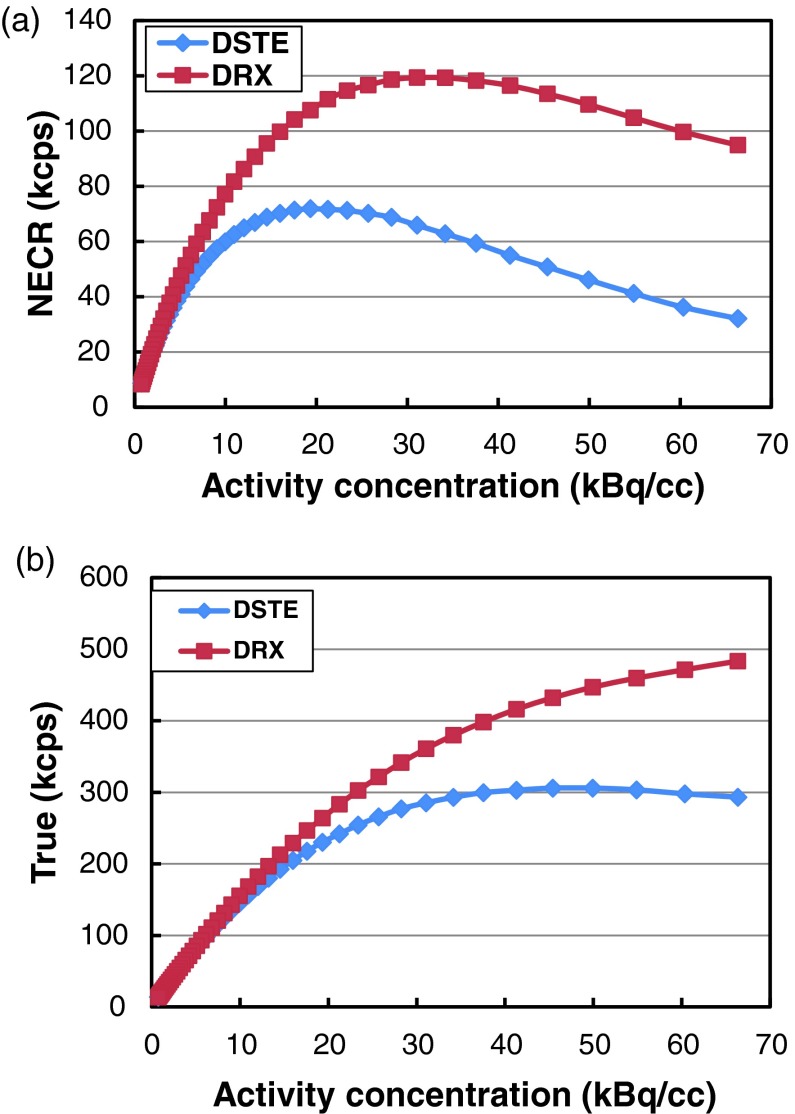
Figures 5a, 5b show the relationship between the NECR and activity concentration, trues rate vs activity concentration for both scanners, respectively. There is a large difference in peak NECR between the two scanners. The peak NECR for the DSTE scanner is 72 kcps and is achieved at 19 kBq/cc, while the peak NECR of the DRX scanner is 119 kcps at 31 kBq/cc. The NECR for the DSTE scanner decreases above 19 kBq/cc while the trues rate continue to increase and reaches its plateau at about 50 kBq/cc. On the other hand, the peak trues rate for the DRX scanner is never reached with the activity concentrations used in this study.
Figure 5.
(a) NECR vs activity concentration curves for the two scanners and (b) trues rate vs activity concentration for the two scanners.
Figure 6a shows the SNR vs activity concentration on both scanners using the 3D-RP reconstruction. SNR vs activity concentration using 3D-OSEM with fixed filter width and fixed subset are shown in Figures 6b, 6c, respectively. Figure 6a shows that for activity concentration <30kBq/cc, the SNR for the DRX scanner was consistently higher by 12% ± 10% than the DSTE scanner with 3D-RP reconstruction (p < 0.05). However, when using 3D-OSEM reconstruction with similar parameters, the two scanners had similar SNRs (2% ± 9% difference on average) (p > 0.05) despite their having different NECRs [Figs. 6b, 6c]. For activity concentrations above 30kBq/cc, there is a large difference for both the NECR and the trues rate between the two scanners (Fig. 5), therefore SNRs start to deviate between the two scanners for both algorithms. In addition, Figs. 6b, 6c also show that a higher SNR can be achieved by using a smaller number of iterations or a larger filter width for 3D-OSEM for both scanners. This dependence however is no longer satisfied when using the same reconstruction parameters.
Figure 6.
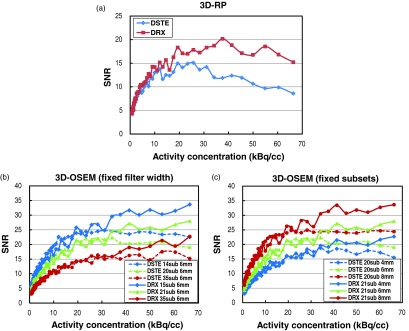
PET image SNR vs activity concentration for different scanners and reconstruction algorithms: (a) images reconstructed using 3D-RP on both scanners, (b) images reconstructed using 3D-OSEM with fixed filter width and varying subsets on both scanners, and (c) images reconstructed using 3D-OSEM with fixed subset and varying filter widths on both scanners.
Patient studies
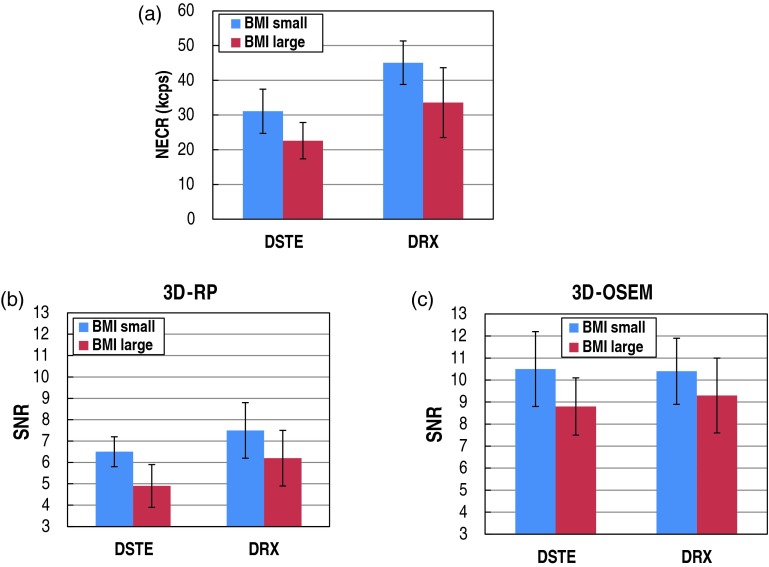
The NECR and the SNR in the liver for each patient subgroup are shown in Fig. 7. Figure 7a shows the average NECR for each BMI and scanner subgroup. The NECR values are on average higher by 47% for the DRX scanner when compared to the DSTE scanner, and this difference is statistically significant (p < 1%). The NECRs decreased by an average of 26% when BMI changed from the small to the large subgroup, and this change was statistically significant (p < 1%).
Figure 7.
The NECR and the SNR in the liver for each patient subgroup: (a) the average NECR for each BMI and scanner subgroup; the average SNR for each BMI and scanner subgroup using (b) 3D-RP and (c) 3D-OSEM.
Figure 7b shows the average SNR for each BMI and scanner subgroup using the 3D-RP reconstruction. The SNR values are on average higher by 21% for the DRX scanner when compared to the DSTE scanner (comparison of blue-to-blue and red-to-red bars) as expected. This difference is statistically significant (p < 5%). SNR on average decreases by 21% when BMI changes from small to large subgroup. This difference is also statistically significant (p < 5%).
Figure 7c shows the average SNR for each BMI and scanner subgroup using the 3D-OSEM reconstruction. The SNR between the two scanners is on average different by 3% (comparison of blue-to-blue and red-to-red bars) and is not statistically significant despite these two systems having different NECRs. On the other hand, SNR on average decreases by 13% when BMI changes from small to large subgroup. This difference is statistically significant (p < 5%).
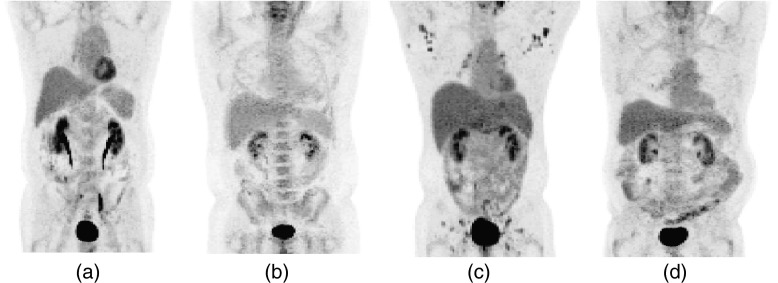
Figure 8 shows PET images of four patients from four subgroups (Table 2) respectively. Subfigures (a) and (b) correspond to patients scanned on DSTE with small and large BMIs respectively, while subfigures (c) and (d) correspond to patients scanned on DRX scanner with small and large BMIs, respectively. All images were reconstructed using 3D-OSEM. The NECRs of the four patients were 27.5, 17.7, 49.0, and 36.2 kcps, respectively, while the corresponding image SNR in the liver using 3D-OSEM were 11.09, 9.18, 11.22, and 9.45, respectively. On the other hand, the SNRs for these patients when using 3D-RP were 6.78, 4.15, 9.09, and 5.82, respectively.
Figure 8.
PET images of four patients from four subgroups (Table 2): (a) small BMI on DSTE, (b) large BMI on DSTE, (c) small BMI on DRX, and (d) large BMI on DRX.
DISCUSSION
The aim of this study was to evaluate the relationship between the PET raw data NECR and the image SNR for fully 3D-OSEM reconstructions. This relationship has been previously shown to be linear for analytical reconstruction algorithms such as FBP.5, 16, 17, 18, 19 but none, to our knowledge, has shown a similar relationship for iterative reconstruction algorithms. Our investigation was based on phantom and patient studies using two different scanners–-the GE DRX and DSTE. Two different reconstruction methods were used: an analytical (3D-RP) and an iterative (3D-OSEM) approach while using different reconstruction parameters (Table 1). The NECR was calculated based on the events within the phantom/patient contour only, and the SNR was calculated using non-neighboring voxels to reduce correlations between neighboring voxels caused by the reconstruction process.
Figure 2a clearly shows a linear correlation between the SNR squared and the NECR in 3D-RP reconstruction. This linear relationship is based on the linear noise propagation of this reconstruction method.16 The average signal in the reconstructed image is proportional to the true counts (T) after correction for scatter (S) and random (R) coincidences. However, when assessing the variance of the signal, one should also account for the existing S and R in the raw data. These contribute to image variance through Poisson distribution, and thus the resulting variance should be T + S + R. This relationship is reflected in the following equation:
| (3) |
However, Figs. 2b, 2c show that the relationship between these two variables was nonlinear when using 3D-OSEM reconstruction irrespective of the scanner and reconstruction parameters used. We speculate the reason for this result is that this algorithm (the GE VuePoint 3D-OSEM algorithm) does not correct for S and R by subtraction of the estimated S and R, respectively, but rather incorporating the corrections inside the iterative loop. Such an approach minimizes the error propagation in correcting S and R and improves image quality.
On the other hand, plotting the square of the SNR versus the coincidence trues rate for the 3D-OSEM reconstruction (Figs. 34) shows a dominant linear relationship (r2 > 0.9) regardless of the choice of scanner and reconstruction parameters and suggests that:
| (4) |
This equation is counter-intuitive, since it suggests that scatter and randoms do not impact image quality. The original relationship between SNR2 and NEC (Refs. 5 and 16) was based on a linear reconstruction algorithm (FBP). Our finding suggests that for nonlinear algorithms such as OSEM, this equation does not hold. As a matter of fact, there is no reason for this relationship to hold given that it was only verified for linear algorithms. One potential explanation of our finding in Eq. 4 may be derived from the evaluation of noise properties by Wilson et al.24, 33 In these papers, the authors showed that image noise in the EM algorithm is related to the true image value, so it seems reasonable to infer that this could also be true for OSEM to some extent. Nevertheless, Eq. 4 is only a reasonable hypothesis that requires further discussion and validation.
One important consequence of Eq. 4 is that for 3D-OSEM reconstruction, the suggested limit of injected activity, which traditionally has been based on NECR, should now be based on the trues count rate, which as shown in Fig. 5, does not roll over as quickly as the NECR curve. This means that images with higher SNR will be produced by increasing the injected activity to match the peak trues count rate for 3D-OSEM. However, further investigation is required to validate such findings.
When 3D-OSEM reconstruction was used, the two scanners had similar SNRs [Figs. 6b, 6c] despite having different NECRs. Similar results are also found from patient studies irrespective of BMI shown in Fig. 7. These findings corroborate our previous results based on 180 patients’ PET scans reconstructed using 3D-OSEM,35 whereby no statistically significant difference in the amount of image noise between the two scanners was found even though the difference in the NECRs was statistically significant. This finding suggests that the SNR may not correlate with the NEC when 3D-OSEM reconstruction is used. SNR in our study was used as a surrogate for image quality, since other factors such as spatial resolution and pixel size that also affect image quality were held constant29, 30 throughout this investigation/comparison and hence had no effect on image quality. In this regard, our results suggest that when comparing DSTE and DRX scanners, a better count rate performance does not translate to a better image quality when using VuePoint 3D-OSEM reconstruction algorithm. Further work is required to validate this finding on other PET/CT scanner types and/or other 3D-OSEM algorithms. In addition, Figs. 6b, 6c also show that a higher SNR can be achieved by using a smaller number of iterations or a larger filter width, suggesting that SNR is impacted by the 3D-OSEM reconstruction algorithm and its associated parameters as expected.
In summary, our investigation does not support a linear relationship between the square of SNR and NECR for 3D-OSEM reconstruction at high activity concentration but rather hints to such a relationship between the square of the SNR and the trues rate. Furthermore, our results also suggest that for the scanners used in this study, a higher NECRs do not necessarily result in better image quality when 3D-OSEM is used.
A potential limitation of the results is that the two PET/CT machines might have different calibration or correction accuracies that might have affected the corresponding image SNR while sparing the NECR performance. However, both scanners used in this study are based on the GE Discovery PET/CT scanner series. Both systems have similar reconstruction engines (VuePoint fully 3D-OSEM), same scatter, random, attenuation, and normalization correction approaches. Moreover the phantom was placed at the same location of the two scanners. In this regard, we believe that the effects of these factors are negligible, and the count rate performance is the dominant effect that affects image quality between the two scanners. However since our results were based on DSTE and DRX scanners and the VuePoint fully 3D-OSEM algorithm that is available on these scanners only, our findings may not be generalized for all 3D-OSEM algorithms and scanners designs/models from different manufacturers. Further work is required to validate this finding on other PET/CT scanner types and/or other 3D-OSEM algorithms.
The main limitation of this study was that the noise calculation was not based on multiple realizations of the phantom acquisitions, but rather on the standard deviation of voxels in one single scan. However, results from our previous work based on Ge-68 phantom studies using high and low activity concentrations (data not shown) showed that these two methods of calculating image noise generate similar noise values. In addition, Tong et al.15 also showed that these two methods lead to similar results. Another limitation in our study is that there might be a bias in calculating the image noise in patients’ liver due to the respiratory motion. Respiratory motion causes the image blurs in the liver, which might affect the liver noise values. In this regard, the VOI used for image noise measurement was placed in the lower portion of the liver to minimize the motion effects since that part of the liver is characterized by less motion when compared to regions adjacent to the diaphragm. Furthermore, the reliability of the image noise calculation is based on patients with disease free liver. Therefore our image noise results cannot be directly extrapolated to those patients with liver tumors.
CONCLUSION
For the scanners and reconstruction algorithm used in this study, the image SNR cannot be predicted by the NECR when using 3D-OSEM reconstruction particularly for those clinical applications requiring high activity concentration (cardiac imaging). The image SNR however is a function of activity concentration and is dominated by the 3D-OSEM reconstruction algorithm and associated parameters, and is not affected by the scanner type for the range of activity concentration found in the clinic.
ACKNOWLEDGMENT
The authors would like to thank Dr. Paul Kinahan for valuable discussions on PET image generation and data management as well as for reviewing the paper and providing constructive comments.
References
- Rigo P., Paulis P., and Kaschten B. J., “Oncological applications of positron emission tomography with fluorine-18 fluorodeoxyglucose,” Eur. J. Nucl. Med. 23, 1641–1674 (1996). 10.1007/BF01249629 [DOI] [PubMed] [Google Scholar]
- Demura Y. et al. , “18F-FDG accumulation with PET for differentiation between benign and malignant lesions in the thorax,” J. Nucl. Med. 44, 540–548 (2003). [PubMed] [Google Scholar]
- Schöder H., Larson S. M., and Yeung H. W. D., “PET/CT in oncology: Integration into clinical management of lymphoma, melanoma, and gastrointestinal malignancies,” J. Nucl. Med. 45(Suppl. 1), 72–81 (2004). [PubMed] [Google Scholar]
- Gordon B. A., Flanagan F. L., and Dehdashti F., “Whole-body positron emission tomography: Normal variations, pitfalls, and technical considerations,” Am. J. Roentgenol. 169, 1675–1680 (1997). [DOI] [PubMed] [Google Scholar]
- Strother S. C., Casey M. E., and Hoffman E. J., “Measuring PET scanner sensitivity: Relating countrates to image signal-to-noise ratios using noise equivalent counts,” IEEE Trans. Nucl. Sci. 37, 783–788 (1990). 10.1109/23.106715 [DOI] [Google Scholar]
- Bailey D. L., Jones T., Spinks T. J., Gilardi M.-C., and Townsend D. W., “Noise equivalent count measurements in a neuro-PET scanner with retractable septa,” IEEE Trans. Med. Imaging 10, 256–260 (1991). 10.1109/42.97573 [DOI] [PubMed] [Google Scholar]
- Stearns C. W., Cherry S. R., and Thompson C. J., “NECR analysis of 3D brain PET scanner designs,” IEEE Trans. Nucl. Sci. 42, 1075–1079 (1995). 10.1109/23.467746 [DOI] [Google Scholar]
- Badawi R. D., Marsden P. K., Cronin B. F., Sutcliffe J. L., and Maisey M. N., “Optimization of noise-equivalent count rates in 3D PET,” Phys. Med. Biol. 41, 1755–1776 (1996). 10.1088/0031-9155/41/9/014 [DOI] [PubMed] [Google Scholar]
- Surti S., Badawi R. D., Holdsworth C. H., El Fakhri G., Kinahan P. E., and Karp J. S., “A multi-scanner evaluation of PET image quality using phantom studies,” IEEE Nucl. Sci. Symp. Conf. Rec. 4, 2425–2427 (2003). 10.1109/NSSMIC.2003.1352384 [DOI] [Google Scholar]
- Lartizien C., Comtat C., Kinahan P. E., Ferreira N., Bendriem B., and Trebossen R., “Optimization of injected dose based on noise equivalent count rates for 2- and 3-dimensional whole-body PET,” J. Nucl. Med. 43, 1268–1278 (2002). [PubMed] [Google Scholar]
- Watson C. C., et al. , “Optimizing injected dose in clinical PET by accurately modeling the counting-rate response functions specific to individual patient scans,” J. Nucl. Med. 46, 1825–1834 (2005). [PubMed] [Google Scholar]
- Danna M., et al. , “Generation of the acquisition-specific NEC (AS-NEC) curves to optimize the injected dose in 3D 18F-FDG whole body PET studies,” IEEE Trans. Nucl. Sci. 53, 86–92 (2006). 10.1109/TNS.2005.862966 [DOI] [Google Scholar]
- Kinahan P. E. and Karp J. S., “Figures of merit for comparing reconstruction algorithms with a volume-imaging PET scanner,” Phys. Med. Biol. 39, 631–642 (1994). 10.1088/0031-9155/39/3/024 [DOI] [PubMed] [Google Scholar]
- Farquhar T. H., Llacer J., Sayre J., Tai Y. C., and Hoffman E. J., “ROC and LROC analyses of the effects of lesion contrast, size, and signal-to-noise ratio on detectability in PET images,” J. Nucl. Med. 41, 745–754 (2000). [PubMed] [Google Scholar]
- Tong S., Alessio A. M., and Kinahan P. E., “Evaluation of noise properties in PSF-based PET image reconstruction,” IEEE Nucl. Sci. Symp. Conf. Rec. 3042–3047 (2009). [DOI] [PMC free article] [PubMed] [Google Scholar]
- Watson C. C., “Count rate dependence of local signal-to-noise ratio in positron emission tomography,” IEEE Trans. Nucl. Sci. 51, 2670–2680 (2004). 10.1109/TNS.2004.835743 [DOI] [Google Scholar]
- Dahlbom M., Schiepers C., and Czernin J., “Comparison of noise equivalent count rates and image noise,” IEEE Trans. Nucl. Sci. 52, 1386–1390 (2005). 10.1109/TNS.2005.858176 [DOI] [Google Scholar]
- Brasse D., Kinahan P. E., Lartizien C., Comtat C., Casey M., and Michel C., “Correction methods for random coincidences in fully 3D whole-body PET: Impact on data and image quality,” J. Nucl. Med. 46, 859–867 (2005). [PubMed] [Google Scholar]
- El Fakhri G., Santos P. A., Badawi R. D., Holdsworth C. H., Van Den Abbeele A. D., and Foley Kijewski M., “Impact of acquisition geometry, image processing, and patient size on lesion detection in whole-body 18F-FDG PET,” J. Nucl. Med. 48, 1951–1960 (2007). 10.2967/jnumed.108.007369 [DOI] [PubMed] [Google Scholar]
- Wilson J. W., Turkington T. G., Wilson J. M., Colsher J. G., and Ross S. G., “Image quality vs. NEC in 2D and 3D PET,” IEEE Nucl. Sci. Symp. Conf. Rec. 4, 2133–2137 (2005). 10.1109/NSSMIC.2005.1596756 [DOI] [Google Scholar]
- Boellaard R., Van Lingen A., and Lammertsma A. A., “Experimental and clinical evaluation of iterative reconstruction (OSEM) in dynamic PET: Quantitative characteristics and effects on kinetic modeling,” J. Nucl. Med. 42, 808–817 (2001). [PubMed] [Google Scholar]
- Watson C. C., “Image noise variance in 3D OSEM reconstruction of clinical time-of-flight PET,” IEEE Nucl. Sci. Symp. Conf. Rec. 3, 1736–1739 (2006). 10.1109/NSSMIC.2006.354232 [DOI] [Google Scholar]
- Walker M. D. et al. , “Optimization of the injected activity in dynamic 3D PET: A generalized approach using patient-specific NECs as demonstrated by a series of 15O-H2O scans,” J. Nucl. Med. 50, 1409–1417 (2009). 10.2967/jnumed.109.062679 [DOI] [PubMed] [Google Scholar]
- Willson D. W., Tsui B. M. W., and Barrett H. H., “Noise properties of the EM algorithm II: Monte Carlo simulations,” Phys. Med. Biol. 39, 847–871 (1994). 10.1088/0031-9155/39/5/005 [DOI] [PubMed] [Google Scholar]
- Qi J., “A unified noise analysis for iterative image estimation,” Phys. Med. Biol. 48, 3505–3519 (2003). 10.1088/0031-9155/48/21/004 [DOI] [PubMed] [Google Scholar]
- Badawi R. D. and Dahlbom M., “NEC: Some coincidences are more equivalent than others,” J. Nucl. Med. 46, 1767–1768 (2005). [PubMed] [Google Scholar]
- Muller J. W., “Dead-time problems,” Nucl. Instrum. Methods 112, 47–57 (1973). 10.1016/0029-554X(73)90773-8 [DOI] [Google Scholar]
- Badawi R. D. et al. , “Count-rate dependent event mispositioning and NEC in PET,” IEEE Trans. Nucl. Sci. 51, 41–45 (2004). 10.1109/TNS.2003.823045 [DOI] [Google Scholar]
- Kinahan P. et al. , “Performance evaluation of an integrated PET/CT scanner: Discovery STE,” J. Nucl. Med. 47(Suppl. 1), 392P (2006). [Google Scholar]
- Kemp B. J., Kim C., Williams J. J., Ganin A., and Lowe V. J., “NEMA NU 2-2001 performance measurements of an LYSO-based PET/CT system in 2D and 3D acquisition modes,” J. Nucl. Med. 47, 1960–1967 (2006). [PubMed] [Google Scholar]
- Rogers J. G., Harrop R., and Kinahan P. E., “The theory of three-dimensional image reconstruction for PET,” IEEE Trans. Med. Imaging 6, 239–243 (1987). 10.1109/TMI.1987.4307832 [DOI] [PubMed] [Google Scholar]
- Iatrou M., Ross S. G., Manjeshwar R. M., and Stearns C. W., “A fully 3D iterative image reconstruction algorithm incorporating data corrections,” IEEE Nucl. Sci. Symp. Conf. Rec. 4, 2493–2497 (2004). 10.1109/NSSMIC.2004.1462761 [DOI] [Google Scholar]
- Barrett H. H., Willson D. W., and Tsui B. M. W., “Noise properties of the EM algorithm I: Theory,” Phys. Med. Biol. 39, 833–846 (1994). 10.1088/0031-9155/39/5/004 [DOI] [PubMed] [Google Scholar]
- Soares E. J., Byrne C. L., and Glick S. J., “Noise characterization of block-iterative reconstruction algorithms: I. Theory,” IEEE Trans. Med. Imaging 19, 261–270 (2000). 10.1109/42.848178 [DOI] [PubMed] [Google Scholar]
- Chang T., Chang G., Kohlmyer S., Clark J. W., Rohren E., and Mawlawi O. R., “Effects of injected dose, BMI and scanner type on NECR and image noise in PET imaging,” Phys. Med. Biol. 56, 5275–5285 (2011). 10.1088/0031-9155/56/16/013 [DOI] [PubMed] [Google Scholar]


