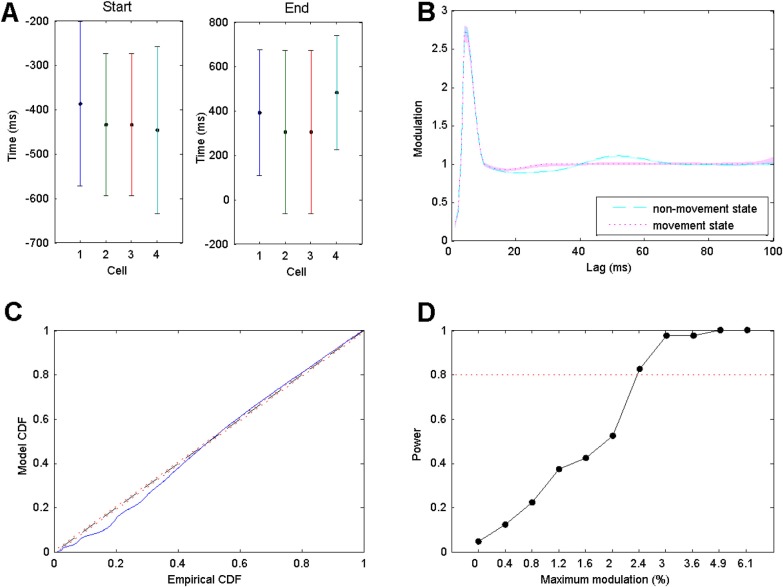
Figure 2.
(a) Estimates and 95% confidence bounds for estimated transition times for the start and end points of the movement spiking state for simulated spike trains of four neurons under the two-state model. Actual transions occurred at −400 ms and 400 ms for start and end transitions, respectively. (b) 95% confidence bounds for the estimated history dependent modulation parameters as a function of lag and the true parameter values for simulated spike data from a single neuron. Cyan dashed line and magenta dotted line represent true modulation during non-movement state and during movement state, respectively. The transparent regions in cyan and magenta correspond to the estimated 95% confidence regions. These regions are narrow and tend to contain the true value at every lag. (c) K-S plot comparing empirical and model CDFs of rescaled simulated ISIs from estimated point process model. (d) Power of the maximum likelihood ratio test as a function of the modulation of the history parameters at 30 ms and 50 ms lags between the non-movement and movement states. The test detects as little as 2.4% modulation in these parameters with 82.5% probability.

