Abstract
Low-grade brain tumors (pilocytic astrocytomas)that result from a genomic rearrangement in which the BRAF kinase domain is fused to the amino terminal of the KIAA1549 gene (KIAA1549:BRAF fusion; f-BRAF) commonly arise in the cerebellum of young children. To model this temporal and spatial specificity in mice, we generated conditional KIAA1549:BRAF strains that co-expresses green fluorescent protein (GFP). While both primary astrocytes and neural stem cells (NSCs) from these mice express f-BRAF and GFP as well as exhibit increased MEK activity, only f-BRAF-expressing NSCs exhibit increased proliferation in vitro. Using Cre driver lines in which KIAA1549:BRAF expression was directed to NSCs (f-BRAF; BLBP-Cre mice), astrocytes (f-BRAF; GFAP-Cre mice), and NG2 progenitor cells (f-BRAF; NG2-Cre mice), increased glial cell numbers were only observed in the cerebellum off-BRAF; BLBP-Cre mice in vivo. The availability of this unique KIAA1549:BRAF conditional transgenic mouse strain will enable future mechanistic studies aimed at defining the developmentally-regulated temporal and spatial determinants that underlie low-grade astrocytoma formation in children.
Keywords: genetically-engineered mice, brain tumor, glioma, pilocytic astrocytoma, astrocyte, neural stem cell
Brain tumors are the most common solid tumors in the pediatric population(Rickert and Paulus, 2001). Among these tumors, the most frequently encountered histological type is the pilocytic astrocytoma (PA), classified by the World Health Organization as a grade I glial fibrillary acidic protein (GFAP)-immunoreactive glial cell tumor (CBTRUS, 2012). The notion that these glial tumors represent developmental disorders is underscored by two observations. First, these tumors typically arise during the first decade of life, and rarely progress to higher grade (malignant) gliomas. Second, PAs usually arise in specific brain regions (e.g., cerebellum, optic pathway).
Until recently, the most common known genetic cause for PA was the neurofibromatosis type 1 (NF1) inherited tumor predisposition syndrome. NF1-associated PAs account for 15% of all PAs, and typically arise in the optic pathway (75% cases) of young children (mean age, 4.5 years)(Guillamo et al., 2003; Listernick et al., 1989; Stern et al., 1980). In these NF1-associated PAs, there is loss of NF1 protein (neurofibromin) expression (Gutmann et al., 2000) and increased RAS pathway (MEK/ERK and AKT/mTOR) activation(Dasgupta et al., 2005; Lee et al., 2010). However, over the past several years, numerous studies focused on sporadic PAs have revealed genomic rearrangements on chromosome 7q in the region of the BRAF kinase gene (Bar et al., 2008; Jacob et al., 2009). In 50–75% of these sporadic PAs, the kinase domain of the BRAF gene is fused to amino terminal exons of the KIAA1549 coding sequence (Jones et al., 2008; Yu et al., 2009). This signature KIAA1549:BRAF fusion event results in the expression of a de-regulated BRAF kinase molecule, leading to increased MEK/ERK signaling and increased cell growth(Jones et al., 2008; Kaul et al., 2012).
While the identification of this PA molecular abnormality represents a major advance for the pediatric brain tumor field, one of the significant obstacles to fully understanding the contribution of the KIAA1549:BRAF fusion to the temporal and spatial patterning of gliomagenesis is the lack of mouse strains harboring this specific genetic alteration. Although oncogenic BRAF(BRAFV600E) strains and constructs have been informative, they have yielded conflicting results. In some studies, BRAFV600E expression had no effect on cell proliferation(Raabe et al., 2011) and glioma formation(Robinson et al., 2010), whereas expression of a truncated kinase domain of BRAFV600E generated low-grade glioma-like lesions in another(Gronych et al., 2011). To create a relevant reagent to define the temporal and spatial determinants that underlie sporadic low-grade glioma formation and maintenance in the intact animal, we developed a novel conditional and regulatable KIAA1549:BRAF (f-BRAF) transgenic mouse strain.
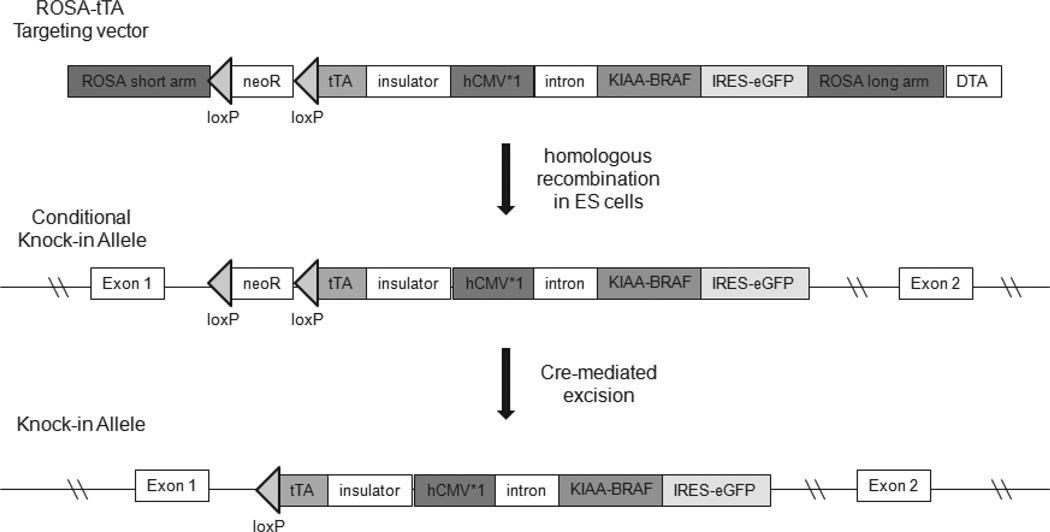
Several different KIAA1549:BRAF alterations have been identified in sporadic PAs; however, the most commonly observed fusion event joins exons 1–16 of the KIAA1549 gene to exons 9–18 of the BRAF gene (KIAA:BRAF 16_9) (Jones et al., 2008; Lin et al., 2012). To recapitulate this PA-associated genetic alteration in mice, the entire coding sequence of KIAA:BRAF 16_9 was cloned into a ROSA26 backbone vector. The targeting construct also contains a tetracycline-responsive(Tet-off) cassette to allow for regulatable expression of the transgene along with an enhanced green fluorescent protein (eGFP) driven from an internal ribosomal entry site (IRES) downstream of f-BRAF for eGFP-mediated cell visualization (Miyazaki et al., 2004). The resulting vector (Fig. 1), following homologous recombination in embryonic stem (ES) cells, blastocyst injection and germline transmission, generated two independent knock-in lines of LSL-KIAA1549:BRAF (f-BRAF) mice (lines 3 and 21).
FIG. 1.
Strategy for the construction of the f-BRAF mouse strain. Schematic of the targeting construct depicts the conditional (LoxP) and regulatable(tTA) elements.
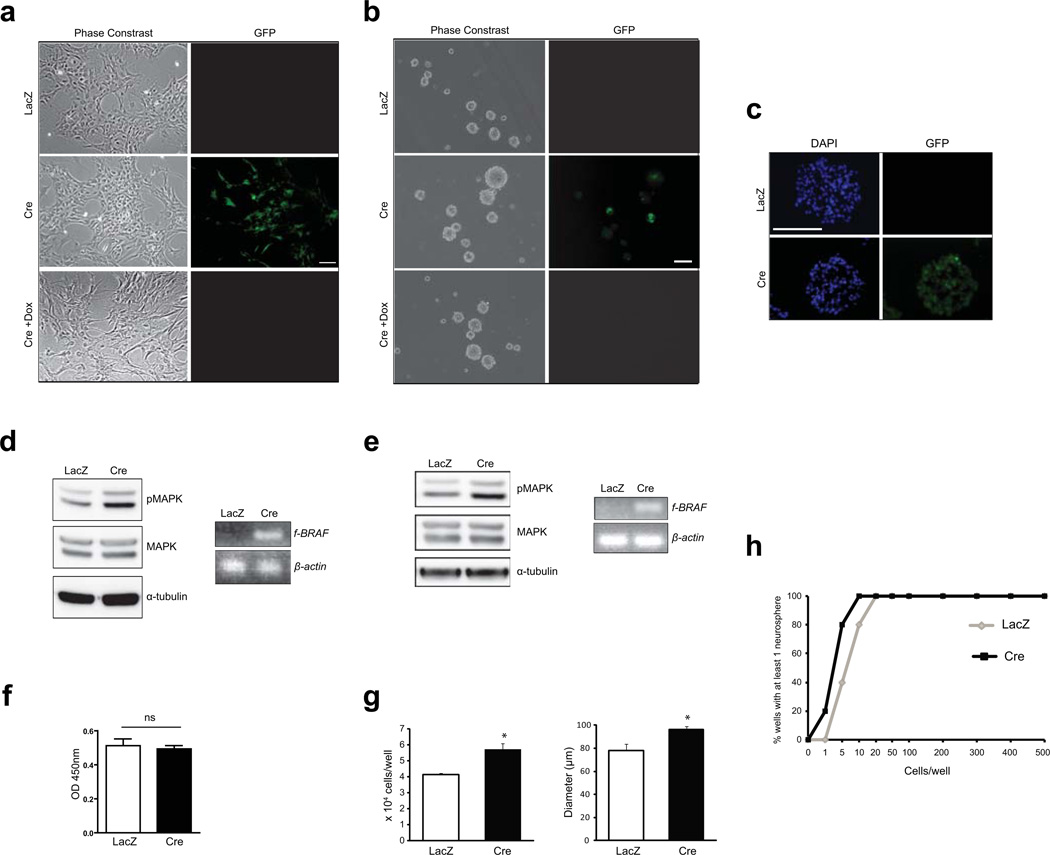
To verify the conditional and regulatable expression of f-BRAF, primary cerebellar astrocytes and neural stem cells (NSCs) were generated from postnatal day 1–2 (PN1-2) f-BRAF mice. Following Ad5-Cre infection, GFP expression was observed in both astrocytes and NSCs, which was silenced upon the addition of 1µg/ml doxycycline (line 21, Fig.2a,b,c; line 3, Supplementary Fig. 1a,b). Because currently-available BRAF antibodies do not recognize f-BRAF, transgene expression was verified by RNA RT-PCR (line 21, Fig. 2d,e, right panels; line 3, Supplementary Fig. 1c,d, right panels). Parallel cultures infected with Ad5-LacZ (controls) did not show GFP or f-BRAF expression. Consistent with previous observations (Kaul et al., 2012), f-BRAF expression resulted in an 1.6–2.0-fold increase in MAPK activation in both cerebellar astrocytes and NSCs (line 21, Fig. 2d,e, left panels; line 3, Supplementary Fig. 1c,d, left panels). However, f-BRAF expression resulted in increased NSC proliferation (25–27% increase in second-generation neurosphere diameters and 1.4–1.5-fold increase in direct cell counts, line 21, Fig. 2g; line 3, Supplementary Fig. 1f) and self-renewal (8 vs.3.7 cells required to form at least one neurosphere, line 21, Fig. 2h), with no effect on astrocyte proliferation (line 21, Fig. 2f; line 3, Supplementary Fig. 1e).
FIG. 2.
Tet-regulatable f-BRAF expression in vitro. Ad5-Cre mediated recombination results in GFP expression in cerebellar astrocytes (a) and NSCs (b), which is silenced following the addition of 1µg/ml doxycycline for 3 days (line 21). (c) GFP immunostaining reveals expression of the transgene (green) in Ad5-Cre-infected neurospheres. f-BRAF expression in astrocytes (d) and NSCs (e) results in increased MAPK activation (Thr-202/Tyr-204 phosphorylation). α-tubulin is included as an internal loading control. RNA RT-PCR confirms the presence of the transgene (d, e; right panel). β-actin is included as an internal control. (f) There was no change in astrocyte proliferation following f-BRAF expression. (g) f-BRAF expression results in increased NSC proliferation. Ad5-LacZ infected cells serve as controls. (h) Limiting dilution assay shows a higher frequency of secondary neurosphere formation in f-BRAF (Cre)-expressing NSCs. Error bars denote mean ± SD. Scale bar, 100µm. (*) P< 0.01. ns, not significant.
To define the differential impact of f-BRAF expression on NSCs and astrocytes in vivo, we next employed Cre transgenic mice in which Cre-mediated recombination first occurs in BLBP+ NSCs at E9.5 (Hegedus et al., 2007), NG2+ neuroglial progenitor cells at E14.5(Zhu et al., 2008), and GFAP+ astroglial progenitor cells at E14.5 (Bajenaru et al., 2002). Both conditional f-BRAF transgenic lines were intercrossed with these Cre driver strains to generate f-BRAFBLBP, f-BRAFNG2,and f-BRAFGFAP mice. All mice were analyzed between 4 and 6 weeks of age.
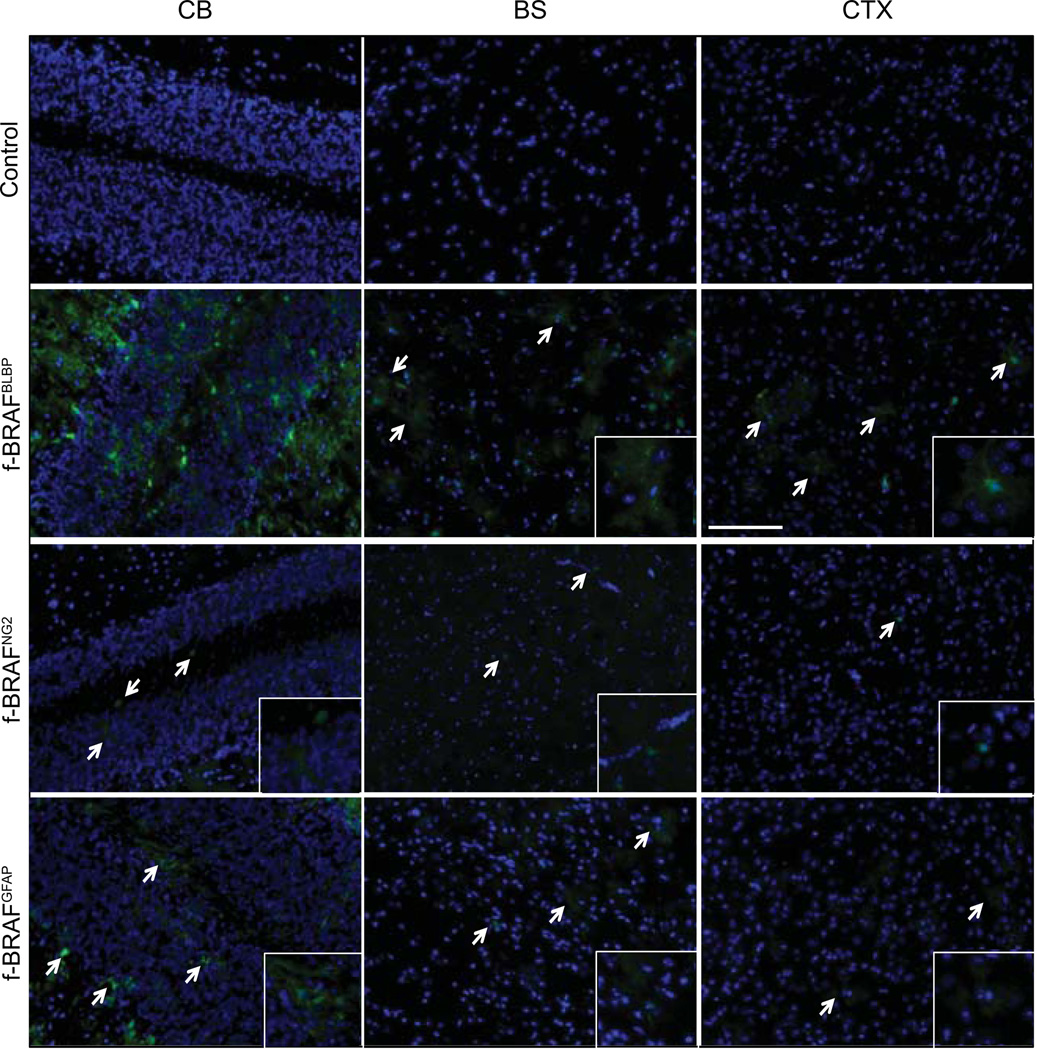
Using these transgenic mice, we made several novel observations. First, the most robust transgene(GFP) expression was observed in f-BRAFBLBP mice (line 21, Fig. 3; line 3, Supplementary Fig. 2). The fact that f-BRAF expression was highest in BLBP+ cells, but not NG2+ or GFAP+ cells, is intriguing in light of our previous observations that ectopic f-BRAF expression only increased NSC, but not astrocyte, proliferation in vitro (Kaul et al., 2012). Experiments are currently underway using other NSC-Cre driver strains (prominin-CreER(Zhu et al., 2009) and nestin-CreER(Lagace et al., 2007) mice to further explore this cell type specificity.
FIG. 3.
Conditional f-BRAF expression in specific neuroglial cell types in vivo. GFP expression is most prominent in the cerebellum (CB) of f-BRAFBLBPmice (line 21). In contrast, significantly less GFP expression is found in the brainstem (BS) or cortex (CTX). Nuclei are counterstained with DAPI (blue). Arrows and insets denote representative GFP+ cells. Scale bar, 100µm.
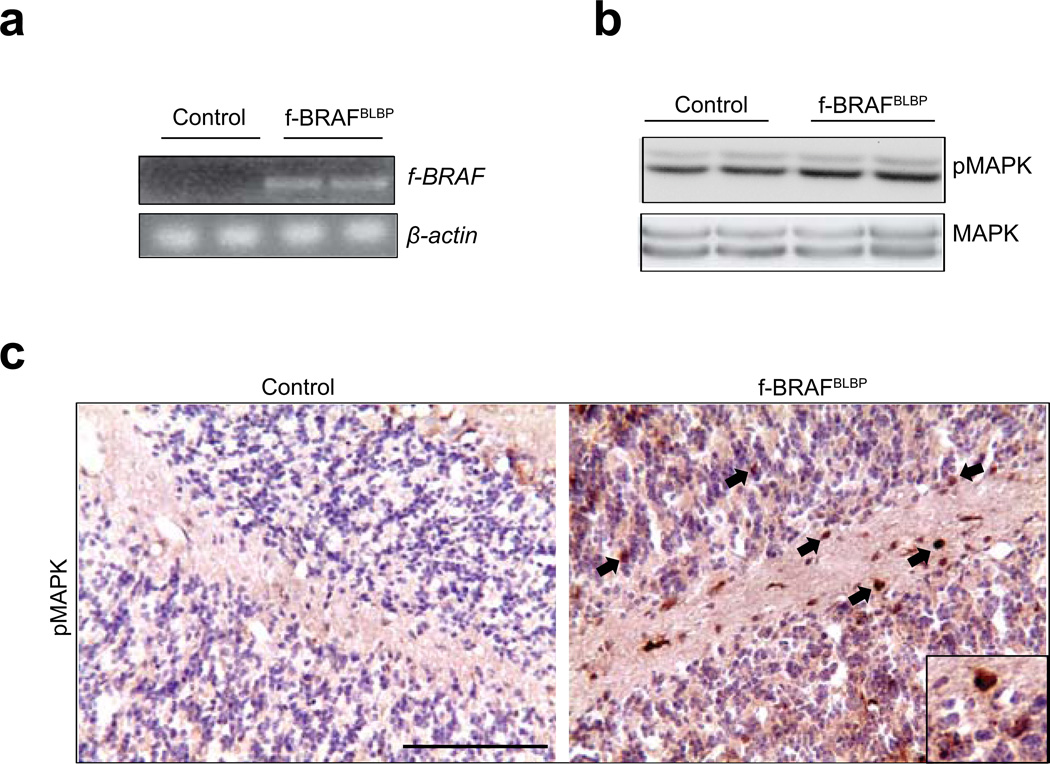
Second, among the different brain regions, transgene expression was highest in the cerebellum of f-BRAFBLBP mice (line 21, Fig. 3; line 3, Supplementary Fig. 2). Consequently, transgene expression in the cerebella of these mice (RNA RT-PCR; Fig. 4a) resulted in a 1.5-fold increase in MAPK phosphorylation (Western blot; Fig. 4b) and immunohistochemistry (line 21, Fig. 4c; line 3, Supplementary Fig. 3a). Additionally, within the cerebellar molecular and granular layers,40–50% of the transgene-expressing (GFP+) cells were GFAP+ astrocytes, while the rest of the GFP+ cells were neurons (30–54% and 25–62% of the GFP+ cells co-labeled with SMI132 and NeuN, respectively)(Supplementary Fig. 3b). There were no APC+/GFP+ double-positive cells (oligodendrocytes),and fewer than 7%of the GFP+ cells co-stained with either the Sox2 or nestin neural stem/progenitor markers.
FIG. 4.
Conditional f-BRAF expression results in increased MAPK activation in the cerebellum in vivo. (a) RNA RT-PCR confirms f-BRAF transcript expression in the cerebella of representative f-BRAFBLBPmice. (b) f-BRAF expression results in increased MAPK phosphorylation in the cerebella of f-BRAFBLBP mice, as determined by Western blotting and (c) immunohistochemistry (arrows; inset shows representative pMAPK+ cells). Scale bar, 100µm.
The observed cerebellar transgene expression in f-BRAFBLBP mice was not the result of mosaic BLBP-Cre expression in the brain. In this regard, robust Cre-mediated recombination was seen throughout the brains of BLBP-Cre × Rosa-GREEN mice, including the cerebral cortex (Supplementary Fig. 4a). Similarly, this unique pattern of f-BRAF expression is unlikely to result from genomic integration effects, as this identical targeting construct has been previously employed to drive Rheb expression throughout the brain(Banerjee et al., 2011). Using genomic DNA PCR, we verified that the f-BRAF transgene was present in astrocytes from the forebrain, brainstem and cerebellum (Supplementary Fig. 4b). However, following Cre-mediated excision in vitro, quantitative reverse transcription PCR (qRT-PCR) analysis revealed 3–4-fold moref-BRAF mRNA expression in cerebellar astrocytes relative to astrocytes from the forebrain or brainstem, respectively(Supplementary Fig. 4c). Additional studies will be required to define the mechanism underlying these brain region-specific f-BRAF mRNA abundance differences.
Third, the observed spatial pattern of f-BRAF expression is also intriguing given the fact that the signature f-BRAF alteration is most commonly detected in cerebellar PAs (Forshew et al., 2009; Jacob et al., 2009). In fact, this regional distribution more closely resembles the brain expression of endogenous KIAA1549 mRNA (Supplementary Fig. 5a; http://www.stjudebgem.org; Magdaleno et al., 2006), where high levels of expression are observed in the cerebellum. In contrast, endogenous wild-type Braf expression is restricted to Purkinje cells in the cerebellum, with higher levels of expression in neurons within the dentate gyrus and cortex (Supplementary Fig. 5b).
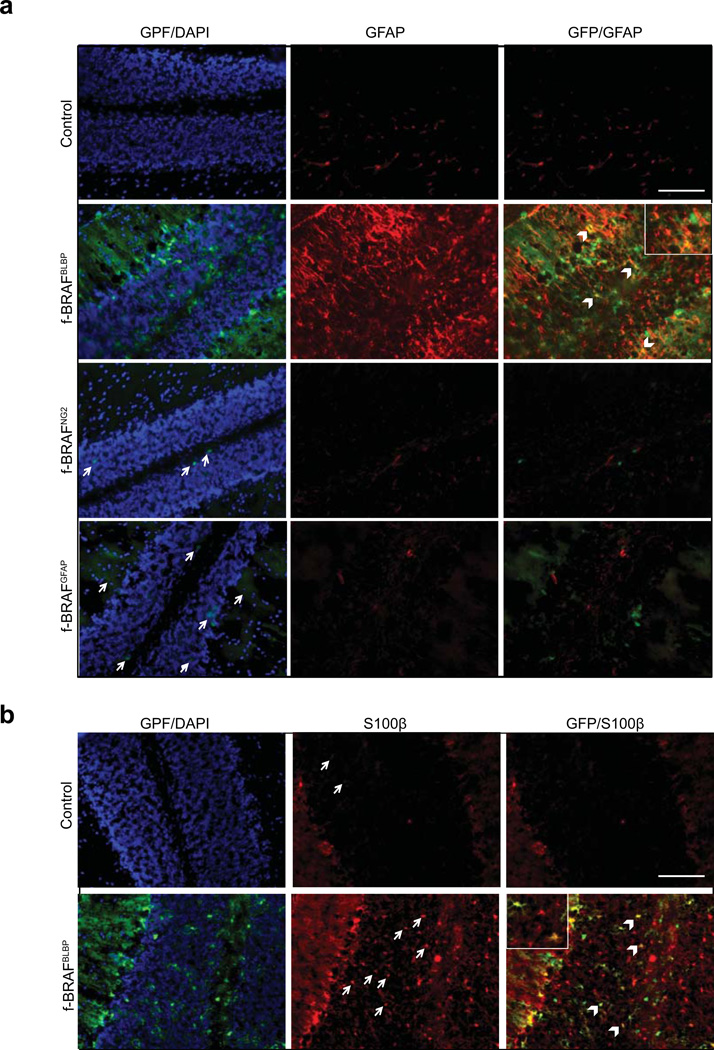
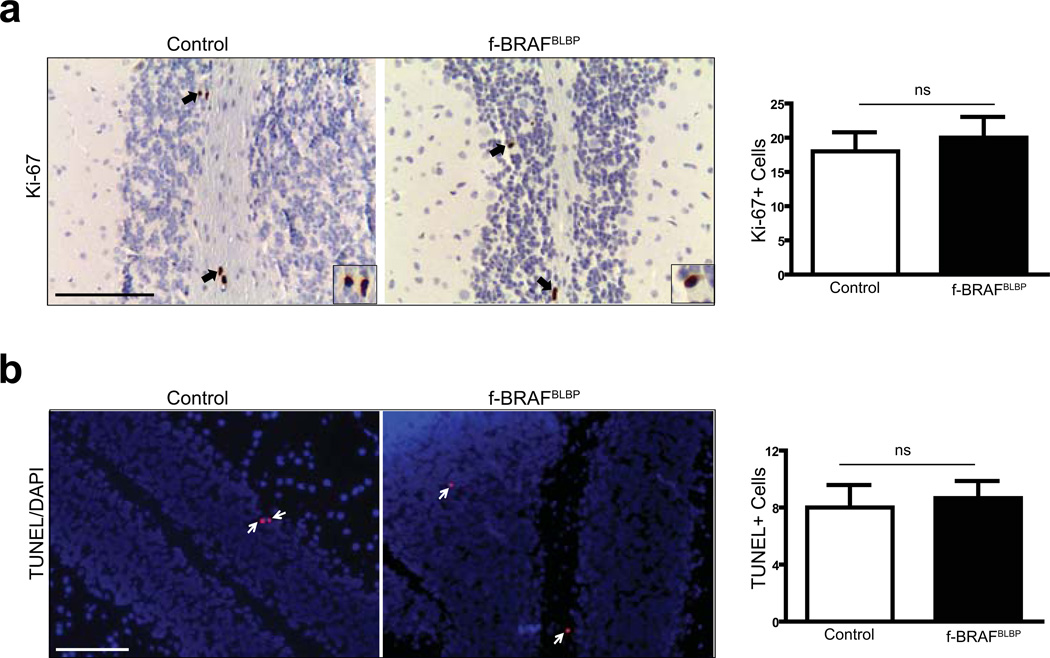
Fourth, since PAs are astrocytic tumors, we examined the impact of f-BRAF expression on astrocyte numbers in vivo. All three Cre driver strains (NG2-Cre, GFAP-Cre, and BLBP-Cre) generate astrocytes following Cre-mediated recombination(Lee et al., 2012; Solga et al., 2013). Although NG2-Cre, GFAP-Cre, and BLBP-Cre mice crossed with Rosa-GREEN reporter mice exhibited Cre-mediated recombination in the cerebellum (Supplementary Fig. 6a), onlyf-BRAFBLBP mice had increased numbers of GFAP+ and S100β+ astrocytes in vivo (Fig. 5a,b). However, we did not observe any change in the number of proliferating or apoptotic cells, as assessed by Ki-67 immunostaining (Fig. 6a), BrdU labeling (Supplementary Fig. 6b), or TUNEL labeling (Fig. 6b).
FIG. 5.
f-BRAF expression increases astrocyte numbers in the cerebellum in vivo. Transgene expression (GFP; green) is observed in the cerebella of f-BRAFBLBP, f-BRAFNG2, and f-BRAFBLBP mice. Increased (a) GFAP (red) (b) S100β (red) immunoreactivity in the cerebellum was only observed in f-BRAFBLBP mice. Arrows denote representative GFP+ or S100β+ cells, respectively. Arrowheads and inset denote cells co-labeled with GFAP and GFP (yellow) or S100β and GFP (yellow). Nuclei are counterstained with DAPI (blue). Scale bar, 100µm.
FIG. 6.
f-BRAF expression does not increase cell proliferation or survival in the cerebellum in vivo. (a) No change in cell proliferation, as determined by Ki-67 immunostaining, was observed in the cerebella of f-BRAFBLBP mice relative to controls (arrows; inset shows representative Ki-67+ cells). (b) There was no change in the number of TUNEL+ cells (red) in the cerebella of f-BRAFBLBP mice as compared to the control mice (arrows; representative TUNEL+ cells). Nuclei are counterstained with DAPI (blue). Age-matched f-BRAF mice served as controls. Bar graph denotes total number of Ki-67+ or TUNEL+ cells in 10 fields of control and f-BRAFBLBP mouse cerebella. Error bars denote mean ± SEM. Scale bar, 100µm. ns, not significant.
While f-BRAFBLBP mice are born at the expected Mendelian ratios, they do not survive beyond 8–10 weeks of age. The exact cause of their premature death remains to be determined; however, these animals became malnourished and their alimentary canals exhibited varying phenotypes, ranging from severely swollen stomachs to blackened hindguts (data not shown). For this reason, we are currently employing tamoxifen-regulatable NSC/neuroglial progenitor Cre driver lines to develop potential mouse PA models.
In summary, we describe the generation of a unique conditional and regulatablef-BRAF mouse strain. This reagent provides a useful tool for studying the role of the f-BRAF transcript in neuroglial cell biology as well as glioma formation and maintenance. The use of a conditional allele permits Cre-mediated f-BRAF expression in specific brain cell types to best define the cell of origin of these common pediatric gliomas. Previous studies from our laboratory have shown that neural stem cells increase their proliferation in response to ectopic f-BRAF expression, whereas differentiated astrocytes do not (Kaul et al., 2012). However, these studies focused on cell autonomous effects of f-BRAF expression in vitro or following re-engraftment in vivo. While f-BRAF expression is sufficient to induce glioma-like lesions in the cerebellum following explant in vivo (tumor initiation;(Kaul et al., 2012), it is not known whether f-BRAF is also necessary for glioma maintenance. The integration of a doxycycline-regulatable promoter element provides an additional opportunity to generate gliomas and to determine the requirement for continued f-BRAF expression in maintaining glioma growth. Taken together, the availability of this novel f-BRAF strain should enable more rapid progress in the fields of developmental neurobiology and pediatric neuro-oncology.
METHODS
Generation of the f-BRAF Conditional Strain
Lox-stop-Lox (LSL)-KIAA1549-BRAF (LSL-f-BRAF) mice were generated using a knock-in strategy described previously (Banerjee et al., 2011; Miyazaki et al., 2004). Briefly, the coding sequence of the KIAA1549:BRAF16_9 gene(generously provided by Dr. Peter Collins, Cambridge, UK) was cloned into a ROSA-26 backbone vector (provided by Dr. S. Miyazaki, Osaka, Japan) containing the tetracycline-regulated transcriptional activator (tTA) cassette upstream of the hCMV*1 promoter (Fig. 1). The tTA protein, expressed under the ROSA-26 promoter, activates hCMV*1 and results in f-BRAF expression. The knock-in vector was introduced into the ES cell line, EDJ22, by electroporation. G418-resistant clones were then picked and targeted insertion of the transgene into the ROSA-26 locus was assessed by PCR. Two positive cell lines were karyotyped and injected into blastocysts to generate f-BRAF knock-in mice. Germline transmission was verified in several chimeric mice, and two independently-generated founders (lines 21 and 3)were chosen for further study. These lines were back-crossed with C57BL/6 mice and subsequently maintained on the C57BL/6 background.
Mice
f-BRAF mice were intercrossed with BLBP-Cre(Hegedus et al., 2007), GFAP-Cre(Bajenaru et al., 2002) or NG2-Cre(B6,FVB-Tg(Cspg4-cre)1Akik/J, Jackson Laboratory) (Zhu et al., 2008) mice to generate f-BRAFBLBP, f-BRAFGFAP and f-BRAFNG2 mice, respectively. At least three mice from each genotype and line were euthanized between 4–6 weeks of age for analyses. Age-matched f-BRAF littermates were used as controls. All studies were conducted in accordance with an approved animal studies protocol at the Washington University School of Medicine.
Genotyping
Toe clips were lysed by incubating in 25mM NaOH at 95°C for 30min and then neutralized using 40mMTris-HCl at pH 5.0(Truett et al., 2000). Transgenic mice were genotyped by performing PCR for f-BRAF and Cre using the following primers, respectively: Fwd: 5’-ACA ATC CCT GCA GTG ACT TGA TTA GAG ACC-3’; Rev: 5’-TTG TAA CTG CTG AGG TGT AGG TGC TGT CAC-3’ ; Fwd: 5’-GCA TTA CCG GTC GAT GCA ACG AGT GAT GAG-3’; Rev: 5’-GAG TGA ACG AAC CTG GTC GAA ATC AGT GCG-3’.
Primary Astrocyte and NSC Cultures
Primary astrocyte and NSC cultures were established from the cerebella of postnatal day1–2 mouse pups(Dasgupta and Gutmann, 2005; Kaul et al., 2012;Yeh et al., 2009). For both astrocytes and NSCs, wild-type and f-BRAF-expressing cultures were generated following infection with Adenovirus type 5 containing β-galactosidase (Ad5-LacZ) or Cre recombinase (Ad5-Cre) (University of Iowa Gene Transfer Vector Core, Iowa City), respectively. Transgene expression was verified by RNA RT-PCR analysis(Lee et al., 2012). f-BRAF-expressing cells were grown in the presence of 1µg/ml doxycycline to silence transgene expressionin vitro.
Cell Proliferation
Astrocyte proliferation (8000 cells/well in a 96-well plate) was assessed using the BrdU Cell Proliferation ELISA kit (Roche) following the manufacturer’s instructions. Briefly, cells were labeled with BrdU for 16 hrs in serum-free medium, and proliferating cells identified using a peroxidase-conjugated anti-BrdU antibody by colorimetric substrate reaction measured at 450nm with a spectrophotometer. NSC proliferation was assessed as described previously(Leeet al., 2010). Briefly, wild-type and f-BRAF-expressing NSCs were trypsinized and plated in ultralow-binding 24-well plates at 5000 cells/well for direct cell counts. For the neurosphere diameter assay, at least 10 neurospheres were individually picked, trypsinized and plated in 24-well plates. The diameters of the resulting neurospheres were measured using Metamorph 7.3.3. Both assays were performed 6 days post-plating. Limiting dilution analysis was performed as described previously (Dasgupta and Gutmann, 2005).
Western Blotting
Mouse cerebella or cells were lysed in 1% NP-40 lysis buffer, supplemented with protease and phosphatase inhibitors, and protein concentrations determined using the bicinchoninic acid (BCA) assay (Pierce). Following SDS-PAGE separation and transfer onto Immobilon membranes, proteins were detected using the following antibodies: MAPK, pMAPK (Cell Signaling Technology) and α-tubulin (Sigma). Detection was accomplished by chemiluminescence using the ChemiDoc-It Imaging System (UVP) and quantified using Visionworks software (UVP).
In Vivo Proliferation Assay
3–4 week old mice were injected intraperitoneally with 50 mg/kg bromodeoxyuridine (BrdU, Sigma) 3 hrs prior to dissection. Brain tissue preparation for paraffin sectioning, BrdU (Abcam) and Ki-67 (BD Pharmingen) immunostaining was performed as previously described (Hegedus et al., 2007).
Immunohistochemistry
Frozen brains were prepared for sectioning and immunostaining as previously described (Hegedus et al., 2007). Sections were incubated with the following primary antibodies: pMAPK (Cell Signaling Technology), GFP (Abcam), GFAP (Millipore), S100β (Abcam). For immunohistochemistry, detection was performed using the Vectastain Elite ABC kit followed by counterstaining with hematoxylin. For immunofluorescence detection, appropriate Alexa-Fluor tagged (Invitrogen) secondary antibody was used followed by counterstaining with DAPI. Terminal deoxynucleotidyl transferase–mediated dUTP nick end labeling (TUNEL) was performed using a fluorescence-based (TMR-red) in situ cell death detection kit, following manufacturer’s protocol (Roche Diagnostics).
Statistical Analysis
All in vitro experiments were performed at least three times with similar results using independent litters. Data was analyzed using Student’s t-test and statistical significance was set at P<0.05.
Supplementary Material
ACKNOWLEDGEMENTS
We thank Renate Lewis in the Mouse Genetics Core for her technical assistance in generating this mouse strain. We also thank Dr. Peter Collins for providing the KIAA1549:BRAF cDNA.
Financial support: This work was supported by grants from the National Institutes of Health (NS065527) and National Brain Tumor Society (to D.H.G.). Y.-H.C. is supported by The Emily Dorfman Foundation for Children in Memory of Emily Ann Dorfman from the American Brain Tumor Association.
Footnotes
Conflicts of interest: The authors declare no conflicts of interest.
LITERATURE CITED
- Bajenaru ML, Zhu Y, Hedrick NM, Donahoe J, Parada LF, Gutmann DH. Astrocyte-specific inactivation of the neurofibromatosis 1 gene (NF1) is insufficient for astrocytoma formation. Mol Cell Biol. 2002;22:5100–5113. doi: 10.1128/MCB.22.14.5100-5113.2002. [DOI] [PMC free article] [PubMed] [Google Scholar]
- Banerjee S, Crouse NR, Emnett RJ, Gianino SM, Gutmann DH. Neurofibromatosis-1 regulates mTOR-mediated astrocyte growth and glioma formation in a TSC/Rheb-independent manner. Proc Natl Acad Sci U S A. 2011;108:15996–16001. doi: 10.1073/pnas.1019012108. [DOI] [PMC free article] [PubMed] [Google Scholar]
- Bar EE, Lin A, Tihan T, Burger PC, Eberhart CG. Frequent gains at chromosome 7q34 involving BRAF in pilocytic astrocytoma. J Neuropathol Exp Neurol. 2008;67:878–887. doi: 10.1097/NEN.0b013e3181845622. [DOI] [PubMed] [Google Scholar]
- CBTRUS. 2012 CBTRUS Statistical Report: Primary Brain and Central Nervous System Tumors Diagnosed in the United States in 2004–2008 Central Brain Tumor Registry of the United States. 2012 [Google Scholar]
- Dasgupta B, Gutmann DH. Neurofibromin regulates neural stem cell proliferation, survival, and astroglial differentiation in vitro and in vivo. J Neurosci. 2005;25:5584–5594. doi: 10.1523/JNEUROSCI.4693-04.2005. [DOI] [PMC free article] [PubMed] [Google Scholar]
- Dasgupta B, Yi Y, Chen DY, Weber JD, Gutmann DH. Proteomic analysis reveals hyperactivation of the mammalian target of rapamycin pathway in neurofibromatosis 1-associated human and mouse brain tumors. Cancer Res. 2005;65:2755–2760. doi: 10.1158/0008-5472.CAN-04-4058. [DOI] [PubMed] [Google Scholar]
- Forshew T, Tatevossian RG, Lawson AR, Ma J, Neale G, Ogunkolade BW, Jones TA, Aarum J, Dalton J, Bailey S, Chaplin T, Carter RL, Gajjar A, Broniscer A, Young BD, Ellison DW, Sheer D. Activation of the ERK/MAPK pathway: a signature genetic defect in posterior fossa pilocytic astrocytomas. J Pathol. 2009;218:172–181. doi: 10.1002/path.2558. [DOI] [PubMed] [Google Scholar]
- Gronych J, Korshunov A, Bageritz J, Milde T, Jugold M, Hambardzumyan D, Remke M, Hartmann C, Witt H, Jones DT, Witt O, Heiland S, Bendszus M, Holland EC, Pfister S, Lichter P. An activated mutant BRAF kinase domain is sufficient to induce pilocytic astrocytoma in mice. J Clin Invest. 2011;121:1344–1348. doi: 10.1172/JCI44656. [DOI] [PMC free article] [PubMed] [Google Scholar]
- Guillamo JS, Creange A, Kalifa C, Grill J, Rodriguez D, Doz F, Barbarot S, Zerah M, Sanson M, Bastuji-Garin S, Wolkenstein P. Prognostic factors of CNS tumours in Neurofibromatosis 1 (NF1): a retrospective study of 104 patients. Brain. 2003;126:152–160. doi: 10.1093/brain/awg016. [DOI] [PubMed] [Google Scholar]
- Gutmann DH, Donahoe J, Brown T, James CD, Perry A. Loss of neurofibromatosis 1 (NF1) gene expression in NF1-associated pilocytic astrocytomas. Neuropathol Appl Neurobiol. 2000;26:361–367. doi: 10.1046/j.1365-2990.2000.00258.x. [DOI] [PubMed] [Google Scholar]
- Hegedus B, Dasgupta B, Shin JE, Emnett RJ, Hart-Mahon EK, Elghazi L, Bernal-Mizrachi E, Gutmann DH. Neurofibromatosis-1 regulates neuronal and glial cell differentiation from neuroglial progenitors in vivo by both cAMP- and Ras-dependent mechanisms. Cell Stem Cell. 2007;1:443–457. doi: 10.1016/j.stem.2007.07.008. [DOI] [PubMed] [Google Scholar]
- Jacob K, Albrecht S, Sollier C, Faury D, Sader E, Montpetit A, Serre D, Hauser P, Garami M, Bognar L, Hanzely Z, Montes JL, Atkinson J, Farmer JP, Bouffet E, Hawkins C, Tabori U, Jabado N. Duplication of 7q34 is specific to juvenile pilocytic astrocytomas and a hallmark of cerebellar and optic pathway tumours. Br J Cancer. 2009;101:722–733. doi: 10.1038/sj.bjc.6605179. [DOI] [PMC free article] [PubMed] [Google Scholar]
- Jones DT, Kocialkowski S, Liu L, Pearson DM, Backlund LM, Ichimura K, Collins VP. Tandem duplication producing a novel oncogenic BRAF fusion gene defines the majority of pilocytic astrocytomas. Cancer Res. 2008;68:8673–8677. doi: 10.1158/0008-5472.CAN-08-2097. [DOI] [PMC free article] [PubMed] [Google Scholar]
- Kaul A, Chen YH, Emnett RJ, Dahiya S, Gutmann DH. Pediatric glioma-associated KIAA1549:BRAF expression regulates neuroglial cell growth in a cell type-specific and mTOR-dependent manner. Genes Dev. 2012;26:2561–2566. doi: 10.1101/gad.200907.112. [DOI] [PMC free article] [PubMed] [Google Scholar]
- Lagace DC, Whitman MC, Noonan MA, Ables JL, DeCarolis NA, Arguello AA, Donovan MH, Fischer SJ, Farnbauch LA, Beech RD, DiLeone RJ, Greer CA, Mandyam CD, Eisch AJ. Dynamic contribution of nestin-expressing stem cells to adult neurogenesis. J Neurosci. 2007;27:12623–12629. doi: 10.1523/JNEUROSCI.3812-07.2007. [DOI] [PMC free article] [PubMed] [Google Scholar]
- Lee DY, Gianino SM, Gutmann DH. Innate neural stem cell heterogeneity determines the patterning of glioma formation in children. Cancer Cell. 2012;22:131–138. doi: 10.1016/j.ccr.2012.05.036. [DOI] [PMC free article] [PubMed] [Google Scholar]
- Lee DY, Yeh TH, Emnett RJ, White CR, Gutmann DH. Neurofibromatosis-1 regulates neuroglial progenitor proliferation and glial differentiation in a brain region-specific manner. Genes Dev. 2010;24:2317–2329. doi: 10.1101/gad.1957110. [DOI] [PMC free article] [PubMed] [Google Scholar]
- Lin A, Rodriguez FJ, Karajannis MA, Williams SC, Legault G, Zagzag D, Burger PC, Allen JC, Eberhart CG, Bar EE. BRAF alterations in primary glial and glioneuronal neoplasms of the central nervous system with identification of 2 novel KIAA1549:BRAF fusion variants. J Neuropathol Exp Neurol. 2012;71:66–72. doi: 10.1097/NEN.0b013e31823f2cb0. [DOI] [PMC free article] [PubMed] [Google Scholar]
- Listernick R, Charrow J, Greenwald MJ, Esterly NB. Optic gliomas in children with neurofibromatosis type 1. J Pediatr. 1989;114:788–792. doi: 10.1016/s0022-3476(89)80137-4. [DOI] [PubMed] [Google Scholar]
- Miyazaki S, Yamato E, Miyazaki J. Regulated expression of pdx-1 promotes in vitro differentiation of insulin-producing cells from embryonic stem cells. Diabetes. 2004;53:1030–1037. doi: 10.2337/diabetes.53.4.1030. [DOI] [PubMed] [Google Scholar]
- Raabe EH, Lim KS, Kim JM, Meeker A, Mao XG, Nikkhah G, Maciaczyk J, Kahlert U, Jain D, Bar E, Cohen KJ, Eberhart CG. BRAF activation induces transformation and then senescence in human neural stem cells: a pilocytic astrocytoma model. Clin Cancer Res. 2011;17:3590–3599. doi: 10.1158/1078-0432.CCR-10-3349. [DOI] [PMC free article] [PubMed] [Google Scholar]
- Rickert CH, Paulus W. Epidemiology of central nervous system tumors in childhood and adolescence based on the new WHO classification. Childs Nerv Syst. 2001;17:503–511. doi: 10.1007/s003810100496. [DOI] [PubMed] [Google Scholar]
- Robinson JP, VanBrocklin MW, Guilbeault AR, Signorelli DL, Brandner S, Holmen SL. Activated BRAF induces gliomas in mice when combined with Ink4a/Arf loss or Akt activation. Oncogene. 2010;29:335–344. doi: 10.1038/onc.2009.333. [DOI] [PMC free article] [PubMed] [Google Scholar]
- Solga AC, Gianino SM, Gutmann DH. NG2-cells are not the cell of origin for murine neurofibromatosis-1 (Nf1) optic glioma. Oncogene. 2013 doi: 10.1038/onc.2012.580. [Epub ahead of print] [DOI] [PMC free article] [PubMed] [Google Scholar]
- Stern J, Jakobiec FA, Housepian EM. The architecture of optic nerve gliomas with and without neurofibromatosis. Arch Ophthalmol. 1980;98:505–511. doi: 10.1001/archopht.1980.01020030501014. [DOI] [PubMed] [Google Scholar]
- Truett GE, Heeger P, Mynatt RL, Truett AA, Walker JA, Warman ML. Preparation of PCR-quality mouse genomic DNA with hot sodium hydroxide and tris (HotSHOT) Biotechniques. 2000;29:52–54. doi: 10.2144/00291bm09. [DOI] [PubMed] [Google Scholar]
- Yeh TH, Lee da Y, Gianino SM, Gutmann DH. Microarray analyses reveal regional astrocyte heterogeneity with implications for neurofibromatosis type 1 (NF1)-regulated glial proliferation. Glia. 2009;57:1239–1249. doi: 10.1002/glia.20845. [DOI] [PMC free article] [PubMed] [Google Scholar]
- Yu J, Deshmukh H, Gutmann RJ, Emnett RJ, Rodriguez FJ, Watson MA, Nagarajan R, Gutmann DH. Alterations of BRAF and HIPK2 loci predominate in sporadic pilocytic astrocytoma. Neurology. 2009;73:1526–1531. doi: 10.1212/WNL.0b013e3181c0664a. [DOI] [PMC free article] [PubMed] [Google Scholar]
- Zhu L, Gibson P, Currle DS, Tong Y, Richardson RJ, Bayazitov IT, Poppleton H, Zakharenko S, Ellison DW, Gilbertson RJ. Prominin 1 marks intestinal stem cells that are susceptible to neoplastic transformation. Nature. 2009;457:603–607. doi: 10.1038/nature07589. [DOI] [PMC free article] [PubMed] [Google Scholar]
- Zhu X, Bergles DE, Nishiyama A. NG2 cells generate both oligodendrocytes and gray matter astrocytes. Development. 2008;135:145–157. doi: 10.1242/dev.004895. [DOI] [PubMed] [Google Scholar]
Associated Data
This section collects any data citations, data availability statements, or supplementary materials included in this article.


