

Abstract
Although personality changes have been associated with brain lesions and atrophy caused by neurodegenerative diseases and aging, neuroanatomical correlates of personality in healthy individuals and their stability over time have received relatively little investigation. In this study, we explored regional gray matter (GM) volumetric associations of the five‐factor model of personality. Eighty‐seven healthy older adults took the NEO Personality Inventory and had brain MRI at two time points 2 years apart. We performed GM segmentation followed by regional analysis of volumes examined in normalized space map creation and voxel based morphometry‐type statistical inference in SPM8. We created a regression model including all five factors and important covariates. Next, a conjunction analysis identified associations between personality scores and GM volumes that were replicable across time, also using cluster‐level Family‐Wise‐Error correction. Larger right orbitofrontal and dorsolateral prefrontal cortices and rolandic operculum were associated with lower Neuroticism; larger left temporal, dorsolateral prefrontal, and anterior cingulate cortices with higher Extraversion; larger right frontopolar and smaller orbitofrontal and insular cortices with higher Openness; larger right orbitofrontal cortex with higher Agreeableness; larger dorsolateral prefrontal and smaller frontopolar cortices with higher Conscientiousness. In summary, distinct personality traits were associated with stable individual differences in GM volumes. As expected for higher‐order traits, regions performing a large number of cognitive and affective functions were implicated. Our findings highlight personality‐related variation that may be related to individual differences in brain structure that merit additional attention in neuroimaging research. Hum Brain Mapp 34:2829–2840, 2013. © 2012 Wiley Periodicals, Inc.
Keywords: individual differences, trait, neuroticism, extraversion, openness, agreeableness, conscientiousness, anterior cingulate, orbitofrontal cortex, frontopolar cortex
INTRODUCTION
There is wide range interpersonal variation in cognitive and affective processing. Individual differences in cognitive task performance are associated with differential recruitment and efficiency of implicated brain networks [Kosslyn et al., 2002; Plomin and Kosslyn, 2001]. Similarly, variation in affective processing, including both trait and state‐level variation, may result from differential recruitment of affective networks [Drabant et al., 2009]. In addition, it is increasingly being recognized that persistent individual differences may reflect structural variation in the neural substrates underlying these behaviors [Erickson et al., 2010; Roppongi et al., 2010; Takeuchi et al., 2010].
Personality is a set of enduring, pervasive, and distinctive patterns of thoughts, feelings, and actions that occur in response to particular situational demands [Mischel, 2004]. To explain the daunting variability in human personality, hierarchical models of trait structure have emerged that combine specific into higher‐order traits. Among these, the five factor model (FFM) demonstrates temporal stability and consensual validity, is pervasive in psychological theory and lay vocabulary [Goldberg, 1990], has strong neurobiological basis and universality (across age, race, sex, and cultures) [Costa and McCrae, 1992; McCrae and Costa, 2003] and emerges from the factor analysis of multiple other personality inventories [Markon et al., 2005]. Moreover, the revised NEO‐Personality Inventory (NEO‐PI‐R), one operationalization of the FFM, has been extensively used in psychological and biomedical research [Costa and McCrae, 1992]. The NEO‐PI‐R has a robust factor structure that has been replicated in more than 50 cultures [McCrae et al., 2005] and has been shown to be stable over time [Terracciano et al., 2006]. Within the NEO‐PI‐R framework, each of the major five factors of personality, neuroticism (N), extraversion (E), openness to experience (O), agreeableness (A), and conscientiousness (C), emerge as the sum of more fundamental traits reflecting intrapsychic, attitudinal, experiential, interpersonal, and motivational individual differences respectively. The five factors influence cognitive [Gusnard et al., 2003; Kumari et al., 2004] and affective [Canli, 2004; Canli et al., 2004; Haas, et al., 2006b] processing, social cognition, and behavior [Lebreton et al., 2009].
The heritability [Bouchard and Loehlin, 2001], temporal stability, and universality [McCrae et al., 2005; Terracciano et al., 2006] of the Factors imply that personality may be an emergent property of the brain's structural and functional organization. Multiple prior structural and functional neuroimaging studies have reported structural and functional neural correlates of these traits. For instance, personality traits have been associated with regional patterns of brain activation and blood flow during performance of trait‐dependant tasks [Canli, 2004; Canli et al., 2004; Gusnard et al., 2003; Haas et al., 2006a, 2006b; Kumari et al., 2004] or during rest [Johnson et al., 1999; Kim et al., 2008; O'Gorman et al., 2006; Sugiura et al., 2000; Tomarken et al., 1990]. Further evidence for a link between personality and structural brain organization is provided by personality changes seen in neurodegenerative diseases [Pocnet et al., 2011; Rankin et al., 2004, 2006; Sollberger et al., 2009]. Moreover, several associations of cortical variability with personality have been reported [Blankstein et al., 2009; DeYoung et al., 2009; Wright et al., 2006, 2007].
Findings in these studies have shown a low degree of correspondence. Considering E and N alone, we note little replicability in their association with specific prefrontal cortex (PFC) and subcortical regions across studies [Blankstein et al., 2009; Omura et al., 2005; Roppongi et al., 2010; Wright et al., 2006, 2007]. This inconsistency may be partly due to studying different populations, for example, teenagers [Blankstein et al., 2009] versus young [Omura et al., 2005; Wright et al., 2006] or older adults [Wright et al., 2007]. It may also be partly attributable to implementing divergent analytical approaches, such as implementing a common general linear model (GLM) for all Factors versus implementing a separate GLM for each Factor and performing regions‐of‐interest (ROIs)‐based versus whole‐brain analysis. While limiting the analysis to ROIs based on solid a priori hypotheses is a valid approach, it presupposes a rather mature field and certain already established facts upon which novel hypotheses can be based. In our opinion, this requirement has yet to be fulfilled for neuroanatomical studies of personality. Therefore, our preferred methodological approach is to conduct exploratory voxel‐wise studies in large cohorts, employing strict statistical criteria and correction for multiple comparisons. A similar approach is being taken in genetics, in which exploratory genome‐wide association studies employ strict statistical criteria to identify associations, which may be confirmed subsequently with other targeted analyses. To our knowledge, the only study to date that has adopted such an approach is the one by DeYoung et al. [ 2010].
In this study, we explored how regional variability in gray matter (GM) is associated with the five factors in a relatively large prospectively evaluated cohort of older adults. The analysis we conducted was exploratory and implemented strict statistical criteria and correction for multiple comparisons. Moreover, we were able to replicate our findings based on longitudinal data from the same subjects.
SUBJECTS, MATERIAL, AND METHODS
The sample included 45 men and 42 women (91% Caucasians; years of education = 16.20 +/− 2.86) who had taken the NEO‐PI‐R and had brain MRI at two time points with an average interval of 2 years. Participants were drawn from the neuroimaging study of the Baltimore Longitudinal Study of Aging (BLSA) [Resnick et al., 2000]. At enrollment into the imaging study, participants were 72 (+/−7.7) years old and were free of CNS disease, severe cardiovascular disease, severe pulmonary disease, and metastatic cancer. Participants completed a battery of neuropsychological tests: cognitive status was assessed using the Mini Mental State Exam, memory using the California Verbal Learning Test and Benton Visual Retention Test, visuospatial function using the Card Rotations Test, verbal fluency using the Letter and Category fluency tests, attention and executive function using the Trail Making Test A and B.
Personality traits were assessed with the NEO‐PI‐R form S (completed by the participants), a comprehensive measure of the FFM [Costa and McCrae, 1992]. Participants were blind to data from the previous visit when taking the NEO‐PI‐R for the second time. The NEO‐PI–R consists of 240 items answered on a 5‐point Likert format ranging from strongly disagree to strongly agree. Raw scores were standardized as T‐scores (M = 50, SD = 10) using combined‐sex norms reported in the manual [Costa and McCrae, 1992]. When participants filled the NEO‐PI‐R for the second time, they were kept blind to their prior answers. Stability of the five factors across the 87 participants was assessed with a double‐entry intraclass correlation.
MRI scans were acquired on a GE Signa 1.5T scanner (Milwaukee, WI) using a high‐resolution volumetric spoiled‐grass axial series (repetition time = 35 msec, echo time = 5 msec, field of view = 24 cm, flip angle = 45°, matrix = 256 × 256, number of excitations = 1, voxel dimensions 0.94 × 0.94 × 1.5 mm). The images were preprocessed according to previously validated and published techniques [Davatzikos et al., 2001; Goldszal et al., 1998]. They were corrected for head tilt and rotation and were reformatted parallel to the anterior‐posterior commissure plane. Extracranial tissue was removed using a semiautomated procedure followed by manual editing. The cerebellum and brainstem below the rostral midbrain level were also removed to improve the accuracy of segmentation and normalization. Next, images were segmented into GM, white matter (WM), and cerebrospinal fluid (CSF), using a brain tissue segmentation method proposed in [Pham and Prince, 1999], followed by high‐dimensional image warping [Shen and Davatzikos, 2002] to a standardized coordinate system, a brain atlas (template) aligned with the MNI coordinate space [Kabani et al., 2008]. Tissue‐preserving image warping was used to create regional volumetric maps (RAVENS maps) for GM, WM, and CSF separately [Davatzikos et al., 2001; Goldszal et al., 1998]. If the image warping transformation registering an individual scan with the template applies an expansion to a GM structure, the GM density of the structure decreases accordingly to insure that the total GM volume is preserved. Conversely, a RAVENS value increases during contraction, if tissue from a relatively larger region is compressed to fit a smaller region in the template [Misra et al., 2009]. Therefore, RAVENS values in the template's space are directly proportional to the volume of the respective structures in the original brain scan and regional volumetric measurements and comparisons can be performed via measurements and comparisons of the respective RAVENS maps [Misra et al., 2009]. The RAVENS approach has been extensively validated [Davatzikos et al., 2001; Goldszal et al., 1998] and applied to a variety of studies [Misra et al., 2009; Resnick et al., 2000]. It uses a highly conforming high‐dimensional image‐warping algorithm that captures fine structural details. Moreover, it uses tissue‐preserving transformations, which ensures that image warping preserves the amount of GM tissue present in an individual's scan, thereby allowing for local volumetric analysis [Misra et al., 2009].
Intracranial volume (ICV) was calculated using the template‐warping algorithm modified for head image registration [Driscoll et al., 2009]. GM RAVENS maps were smoothed using a 12‐mm full‐width at half‐maximum filter; the relatively large smoothing kernel was selected because complex personality traits are more likely to be associated with larger cortical areas.
For statistical inference, we used VBM methodology [Ashburner and Friston, 2000] as implemented in SPM8 (Wellcome Department of Imaging Neuroscience, Institute of Neurology, UCL). We fitted the data into a GLM, according to the following equation:
where y is the observation vector (intensity value of each RAVENS voxel) over all participants, βs are the coefficients associated with each predictor, at time points 1 and 2 (T 1 and T 2), the N, E, O, A, and C domain scores, age (in years), sex, education (in years) and ICV. The ICV from the initial scanning was used for global normalization at both times to avoid potential bias of ensuing brain atrophy on ICV estimation. Global normalization for ICV was performed to identify regions where the trends in GM volume differ from global variation in intracranial size. From the results of the GLM, a t‐test was computed for each voxel and statistical parametric maps were created with a significance threshold of P < 0.001.
Subsequently, a conjunction analysis was performed to identify areas of spatial overlap between the statistical maps from the two time points. (For an illustration of how the conjunction analysis was performed, we refer to Supporting Information Fig. 1, which contains the statistical parametric maps for the contrast of positive association with O for T 1, T 2 and their conjunction.) The statistical parametric maps from the conjunction analysis were then subjected to correction for multiple comparisons using the theory of Gaussian random fields. Specifically, we performed Family Wise Error (FWE)‐correction at the cluster‐level adopting a significance threshold of P < 0.05 for corrected results.
Figure 1.
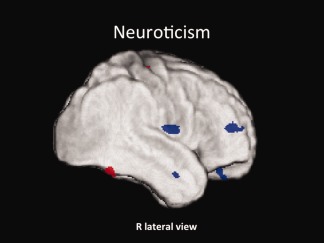
Neuroticism: Conjunction SPM T‐map of positive (red) and negative (blue) correlations of N rendered on the subjects' average GM image (z > 3.5).
SPM creates a separate spatial map of β coefficients (or beta weights) for each regressor during model estimation (beta_00*.img files). The β coefficient for a particular regressor represents the slope of the regression of voxel values (in this case, GM RAVENS values, which represents GM volumes contained in each voxel) by this variable (in this case, N, E, O, A, or C Factor T‐scores). Therefore, reported β coefficients are expressed in (GM RAVENS voxel value)/(NEO Factor T‐score) units. They are a meaningful estimate of effect size, since they represent the change in GM volume contained in a voxel for a change of 1/10 of a standard deviation of a NEO Factor. To provide an estimate for the effect of each regressor on reported clusters, we used the Marsbar toolbox for SPM to extract significant clusters; then, we extracted voxel‐by‐voxel beta weights for these clusters from the beta_00*.img images corresponding to the effect of interest; and, finally, we calculated the average beta weight for the cluster.
To report the coordinates of the peak voxel of each cluster in the Montreal Neurological Institute (MNI) space (Table 2), we coregistered statistical maps (in RAVENS space) into the MNI space by performing rotation with minimum transformation. The coregistration procedure was implemented using the SPM8 template T1 images according to the following transformation:
where X1, Y1, and Z1 are the transformed and X, Y, and Z the original coordinates.
Table 2.
Neuropsychological testing results
| Test score | Mean and standard deviation |
|---|---|
| MMSE | 28.8 (1.58) |
| CVLT‐CA | 54.01 (10.50) |
| CVLT‐long delay | 11.40 (3.38) |
| BVRT | 5.80 (3.75) |
| Card rotations | 78.06 (31.64) |
| Category fluency | 15.10 (2.84) |
| Letter fluency | 14.56 (4.24) |
| Trails A | 35.66 (12.85) |
| Trails B | 84.14 (35.58) |
Results are from the initial evaluation of the cohort (Time 1). MMSE, Mini Mental State Exam; CVLT, California Verbal Learning Test; BVRT, Benton Visual Retention Test; BVRT and Trails are reverse‐keyed with higher scores indicating poorer performance.
To localize clusters anatomically and identify Brodmann areas we consulted the Talaraich Atlas [Lancaster et al., 2000] and the atlases embedded in MRIcron (Chris Rorden's MRIcron). To visualize results, we used MRIcron to overlay significant clusters on the average GM RAVENS image, which was calculated by SPM8 from the 87 subjects' unsmoothed RAVENS maps.
RESULTS
Neuropsychological Testing
Factor means and standard deviations are reported in Table 1. We used a double‐entry intraclass correlation to measure profile stability for all five factors across the 87 participants, obtaining an average intraclass correlation of 0.80. Means and standard deviations for select cognitive tests at the time of enrollment are reported in Table 2.
Table 1.
Personality traits in the cohort
| Domains | Time 1 mean and standard deviation | Time 2 mean and standard deviation | Intraclass correlation (P < 0.001) |
|---|---|---|---|
| Neuroticism | 46.38 (8.59) | 46.00 (8.54) | 0.85 |
| Extraversion | 48.38 (9.11) | 47.31 (8.54) | 0.90 |
| Openness | 50.75 (10.69) | 50.61 (10.79) | 0.91 |
| Agreeableness | 52.15 (7.55) | 53.02 (8.52) | 0.85 |
| Conscientiousness | 48.50 (8.16) | 48.53 (9.09) | 0.83 |
Neuroimaging
In the reported results, among other covariates, we are controlling for (years of) education. Similar results were obtained excluding education from the model.
Neuroticism
N correlated positively with GM volume within: (R) lingual, BA 18; (R) fusiform, BA 37/20; (R) middle occipital and calcarine, BA 18, and (R) precentral, BA 4, cortices; and negatively with GM volume within: (R) orbitofrontal (OF; inferior orbital frontal gyrus, BA 47); (R) rolandic opperculum, BA 22; (R) dorsolateral PF (middle frontal gyrus, BA 46); (R) parahippocampal, BA 28; and (R) middle temporal, BA 21, cortices (Fig. 1 and Table 3).
Table 3.
GM areas associated with personality
| Contrast | Localization (neuroanatomical region and Brodmann's area) | Cluster size (voxels) | Peak‐voxel t‐statistic (Z value) | Significance level (after FWE‐ correction) | β Coefficient (GM RAVENS voxel value)/(NEO Factor T‐score) | Peak‐voxel(s) MNI coordinates |
|---|---|---|---|---|---|---|
| Positive linear correlation with N | (R) LG, BA 17 | 3604 | 4.78 | Cluster‐level: P < 0.001 | 0.80 | 14, −66, and 2 |
| (R) FG, BA 37/20 | 3131 | 4.40 | Cluster‐level: P < 0.001 | 1.40 | 53, −58, and −24 | |
| (R) MOG, BA 18 | 439 | 4.38 | Cluster‐level: P = 0.035 | 0.14 | 29, −98, and 1 | |
| (R) precentral gyrus, BA 4 | 1874 | 3.57 | Cluster‐level: P < 0.001 | 1.90 | 36, −27, and 66 | |
| (R) CG, BA 18 | 700 | 3.51 | Cluster‐level: P = 0.002 | 2.08 | 10, −82, and 16 | |
| Negative linear correlation with N | (R) IOFG, BA 47 (lateral OFC) | 1036 | 5.23 | Cluster‐level: P < 0.001 | −0.62 | 42, 38, and −23 |
| (R) Rolandic opperculum, BA 22 | 3372 | 4.83 | Cluster‐level: P < 0.001 | −0.75 | 70, −7, and 12 | |
| (R) MFG, BA 46 | 2863 | 4.55 | Cluster‐level: P < 0.001 | −1.30 | 52, 46, and 15 | |
| (R) PHG, BA 28 | 898 | 4.27 | Cluster‐level: P < 0.001 | −1.30 | 20, 2, and −30 | |
| (R) MTG, BA 21 | 1087 | 3.89 | Cluster‐level: P < 0.001 | −2.06 | 59, 1, and −26 | |
| Positive linear correlation with E | (L) STG, BA 22 extending into the (L) MTG, BA 21; ITG, BA20; PHG, BA 36 | 21,333 | 5.60 | Peak‐level: P = 0.008; Cluster‐level: P < 0.001 | 1.66 | −50, −8, and −7 |
| (R) MFG, BA 44/46 | 6646 | 5.45 | Peak‐level: P = 0.018; Cluster‐level: P < 0.001 | 1.18 | 34, 22, 34 | |
| (L) aCG, BA 32 | 13,199 | 5.26 | Peak‐level: P = 0.044; Cluster‐level: P < 0.001 | 1.86 | −6, 42, and 15 | |
| (L) MFG, BA 46 | 7280 | 4.95 | Cluster‐level: P < 0.001 | 1.72 | −26, 38, and 26 | |
| (L) SMA, BA 3 | 2171 | 4.44 | Cluster‐level: P < 0.001 | 1.69 | −60, −20, and 42 | |
| (L) IOG, BA 19 | 622 | 4.36 | Cluster‐level: P = 0.004 | 0.75 | −53, −74, and −7 | |
| (L) STG, BA 22 | 1029 | 3.95 | Cluster‐level: P < 0.001 | 1.50 | −54, −26, and 6 | |
| (L) SFG, BA 6 | 736 | 3.80 | Cluster‐level: P = 0.001 | 1.37 | −25, −8, and 60 | |
| (R) insula | 638 | 3.80 | Cluster‐level: P = 0.004 | 1.48 | 38, 4, and 1 | |
| Negative linear correlation with E | (R) PHG, BA 35 | 892 | 5.03 | Cluster‐level: P < 0.001 | −0.51 | 24, −8, and −32 |
| (L) IOG, BA 18 | 1914 | 5.02 | Cluster‐level: P < 0.001 | −0.78 | −22, −101, and −12 | |
| (L) SPL, BA 7 | 652 | 4.04 | Cluster‐level: P = 0.003 | −0.58 | −39, −63, and 58 | |
| Positive linear correlation with O | (R) SFG, BA 10 (frontopolar cortex) | 5552 | 5.73 | Peak‐level: P = 0.004; Cluster‐level: P < 0.001 | 0.75 | 16, 64, and 22 |
| (L) thalamus | 1172 | 3.59 | Cluster‐level: P < 0.001 | 2.55 | −11, −14, and 17 | |
| Negative linear correlation with O | (R) SOFG, BA 11 (medial OFC) | 2758 | 6.34 | Peak‐level: P < 0.001; Cluster‐level: P < 0.001 | −0.72 | 24, 33, and −13 |
| (L) MFG, BA 47 | 655 | 5.64 | Peak‐level: P = 0.007; Cluster‐level: P = 0.003 | −0.16 | −54, 43, and −4 | |
| (R) FG, BA 36 | 4917 | 5.49 | Peak‐level: P = 0.014; Cluster‐level: P < 0.001 | −0.83 | 19, 8, and −44 | |
| (L) STG (fronto‐insular cortex) | 3493 | 5.00 | Cluster‐level: P < 0.001 | −1.88 | −41, −10, and −9 | |
| (R) SFG, BA 6 | 1535 | 4.88 | Cluster‐level: P < 0.001 | −0.86 | 24, −5, and 70 | |
| (R) RG, BA 11 (medial OFC) | 4863 | 4.86 | Cluster‐level: P < 0.001 | −1.41 | 8, 52, and −18 | |
| (L) postcentral gyrus, BA 5 | 3469 | 4.84 | Cluster‐level: P < 0.001 | −0.65 | −20, −46, and 76 | |
| (R) precuneus, BA 7 | 1432 | 4.35 | Cluster‐level: P < 0.001 | −1.12 | 3, −48, and 39 | |
| (L) FG, BA 20 | 895 | 4.08 | Cluster‐level: P < 0.001 | −1.49 | −36, −17, and −36 | |
| (L) IPG, BA 40 | 1208 | 3.89 | Cluster‐level: P < 0.001 | −1.59 | −48, −47, and 42 | |
| (L) SMA, BA 6 | 789 | 3.80 | Cluster‐level: P = 0.001 | −1.17 | −3, 9, and 60 | |
| Positive linear correlation with A | (R) IOFG, BA 47 (lateral OFC) | 1512 | 5.23 | Peak‐level: P = 0.050; Cluster‐level: P < 0.001 | 0.57 | 31, 33, and −25 |
| (R) MOFG, BA 46 (lateral OFC) | 5476 | 4.59 | Cluster‐level: P < 0.001 | 1.36 | 45, 56, and −2 | |
| (R) MTP, BA 20 | 1375 | 4.31 | Cluster‐level: P < 0.001 | 1.63 | 46, 15, and −42 | |
| (L) SPG, BA 7 | 917 | 3.78 | Cluster‐level: P < 0.001 | 1.08 | −17, −57, and 72 | |
| Negative linear correlation with A | (B) SMFG, BA 8 | 12987 | 5.75 | Peak‐level: P = 0.004; Cluster‐level: P < 0.001 | −1.15 | −11, 36, 58 and 4, 40, and 53 |
| (L) PHG, BA 28/36 | 2023 | 5.46 | Peak‐level: P = 0.017; Cluster‐level: P < 0.001 | −1.22 | −16, −7, and −28 | |
| (L) MFG, BA 46 | 1604 | 5.31 | Peak‐level: P = 0.035; Cluster‐level: P < 0.001 | −0.90 | −44, 54, and 18 | |
| (L) STG, BA 22 | 6105 | 5.26 | Peak‐level: P = 0.044; Cluster‐level: P < 0.001 | −2.25 | −55, −23, and 3 | |
| (L) SMFG, BA 32 | 698 | 4.05 | Cluster‐level: P = 0.002 | −0.92 | −6, 31, and 36 | |
| (L) PHG, BA 37 | 992 | 3.90 | Cluster‐level: P < 0.001 | −1.78 | −23, −36, and −6 | |
| (R) calcarine gyrus, BA 17 | 2003 | 3.75 | Cluster‐level: P < 0.001 | −1.96 | 15, −57, and 10 | |
| Positive linear correlation with C | (B) SFG, BA 8; (R) > (L) | 17801 | 6.42 | Peak‐level: P < 0.001; Cluster‐level: P < 0.001 | 1.30 | 9, 45, 54 and −9, 49, and 52 |
| (R) postcentral gyrus, BA 3 | 4159 | 5.34 | Peak‐level: P = 0.031; Cluster‐level: P < 0.001 | 1.77 | 62, −13, and 44 | |
| (L) precuneus, BA 5 | 6715 | 5.24 | Peak‐level: P = 0.048; Cluster‐level: P < 0.001 | 1.79 | −13, −57, and 65 | |
| (R) precentral gyrus, BA 6 | 2003 | 5.23 | Peak‐level: P = 0.049; Cluster‐level: P < 0.001 | 0.87 | 38, −9, and 67 | |
| (L) FG, BA 19 | 1896 | 4.84 | Cluster‐level: P < 0.001 | 1.76 | −41, −64, and −17 | |
| (L) caudate nucleus | 2814 | 4.67 | Cluster‐level: P < 0.001 | 1.33 | −6, 7, and 13 | |
| (R) SFG, BA 8 | 3835 | 4.63 | Cluster‐level: P < 0.001 | 1.46 | 30, 9, and 63 | |
| (L) SFG, BA 6 | 3646 | 4.61 | Cluster‐level: P < 0.001 | 1.10 | −25, 3, and 71 | |
| (L) aCG, BA 32 | 2858 | 4.52 | Cluster‐level: P < 0.001 | 1.51 | −10, 42, and 18 | |
| (R) STG, BA 22 and (R) IFG, pars opercularis, BA 44 | 5928 | 4.31 | Cluster‐level: P < 0.001 | 1.96 | 59, −9, 10 and 56, 14, and 12 | |
| (L) LG, BA 18 | 797 | 3.88 | Cluster‐level: P = 0.001 | 1.29 | −15, −64, and −8 | |
| (L) hippocampus | 1814 | 3.75 | Cluster‐level: P < 0.001 | 1.56 | −22, −37, and 6 | |
| Negative linear correlation with C | (R) MTP, BA 38 | 3560 | 6.11 | Peak‐level: P = 0.001; Cluster‐level: P < 0.001 | −0.21 | 20, 16, and −36 |
| (L) STG, BA 21 | 736 | 5.46 | Peak‐level: P = 0.017; Cluster‐level: P = 0.003 | −0.26 | −64, −3, and 1 | |
| (B) SMFG, BA 10 (frontopolar cortex) | 14,345 | 5.28 | Peak‐level: P = 0.041; Cluster‐level: P < 0.001 | −0.37 | 12, 69, 10 and −7, 72, and 4 | |
| (L) SPL, BA 7 | 1782 | 5.18 | Cluster‐level: P < 0.001 | −0.44 | −37, −66, 60 | |
| (L) CG, BA 17 | 4795 | 4.67 | Cluster‐level: P < 0.001 | −0.54 | −2, −101, 11 | |
| (R) postcentral gyrus, BA 4 | 3843 | 4.61 | Cluster‐level: P < 0.001 | −1.01 | 34, −34, 72 | |
| (R) IOFG, BA 11 (medial OFC) | 1289 | 4.26 | Cluster‐level: P < 0.001 | −0.98 | 16, 39, −9 |
(R), right; (L), left; (B), bilateral; IFG, inferior frontal gyrus; MFG, middle frontal gyrus; SFG, superior frontal gyrus; SMFG, superior medial frontal gyrus; SMA, supplemental motor area; IOFG, inferior orbital frontal gyrus; MOFG, middle orbital frontal gyrus; SOFG, superior orbital frontal gyrus; RG, rectal gyrus; ITG, inferior temporal gyrus; MTG, middle temporal gyrus; STG, superior temporal gyrus; MTP, middle temporal pole; aCG, anterior cingulate gyrus; PHG, parahippocampal gyrus; IPG, inferior parietal gyrus; SPL, superior parietal lobule; SMG, supramarginal gyrus; LG, lingual gyrus; FG, Fusiform gyrus; CG, calcarine gyrus; MOG, middle occipital gyrus; IOG, inferior occipital gyrus; MNI, Montreal Neurological Institute; NS, nonsignificant (association).
Extraversion
E correlated positively with GM volume within: (L) temporal lobe (cluster extending from its peak at the superior temporal to the middle temporal, inferior temporal, and parahippocampal gyri); (L) dorsolateral PFC (clusters in BA 44, 46, and 6); (L) supplemental motor area, BA 3; (L) anterior cingulate (aCG), BA 32; (L) superior temporal gyrus, BA 22; and (R) insular cortices. E correlated negatively with GM volume within: (L) parahippocampal, BA 35; (L) inferior occipital, BA 18; and (L) superior parietal lobule, BA 7, cortices (Fig. 2 and Table 3).
Figure 2.
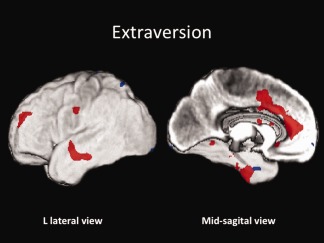
Extraversion: Conjunction SPM T‐map of positive (red) and negative (blue) correlations of E rendered on the subjects' average GM image (z > 3.5).
Openness
O correlated positively with GM volume within (R) frontopolar (FP) cortex, BA 10, and (L) thalamus; and negatively with GM volume within OF, BA 11 and 47; bilateral FG, BA 36/20; (L) fronto‐insular; (R) superior frontal and (L) supplemental motor area, BA 6; (L) post‐central, BA 5; (R) precuneus, BA 7; and (L) inferior parietal, BA 40, cortices (Fig. 3 and Table 3).
Figure 3.
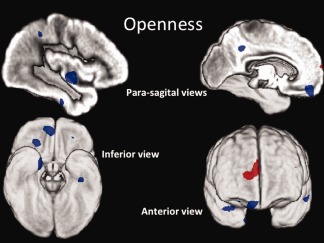
Openness: Conjunction SPM T‐map of positive (red) and negative (blue) correlations of O rendered on the subjects' average GM image (z > 3.5).
Agreeableness
A correlated positively with GM volume within: (R) lateral OF, BA 47/46; middle temporal pole, BA 20; and superior parietal, BA 7, cortices; and negatively with GM volume within bilateral dorsomedial PF (superior medial frontal gyrus, BA 8 and 32); (L) dorsolateral PF (middle frontal gyrus, BA 46); (L) parahippocampal gyrus, BA 36/37; (R) calcarine, BA 17; and (L) superior temporal gyrus, BA 22 (Wernicke's area), cortices (Fig. 4 and Table 3).
Figure 4.
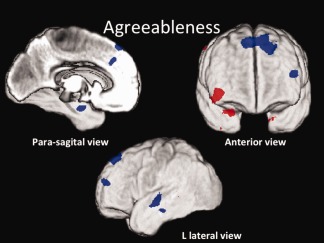
Agreeableness: Conjunction SPM T‐map of positive (red) and negative (blue) correlations of A rendered on the subjects' average GM image (z > 3.5).
Conscientiousness
C correlated positively with GM volume within bilateral dorsomedial PFC (superior frontal gyrus, BA 8); (R) postcentral gyrus, BA 3; (L) precuneus, BA 5; (R) IFG, pars opercularis, BA 44; (R) superior temporal gyrus, BA 22; (R) precentral and (L) superior frontal gyri, BA 6; (L) aCG, BA 32; (L) caudate nucleus; (L) lingual gyrus; and (L) hippocampus; and negatively with GM volume within (R) middle temporal pole, BA 38; (L) superior temporal gyrus, BA 21; bilateral FP, BA 10; (L) superior parietal lobule, BA 7; (L) calcarine, BA 17; (R) postcentral gyrus, BA 4; and (R) medial OF, BA 11, cortices (Fig. 5 and Table 3).
Figure 5.
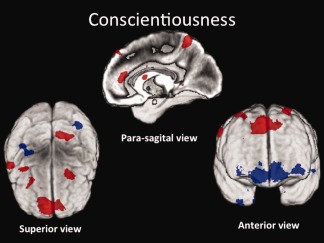
Conscientiousness: Conjunction SPM T‐map of positive (red) and negative (blue) correlations of C rendered on the subjects' average GM image (z > 3.5).
DISCUSSION
We identified a number of GM regions associated with personality traits. This study focused on the GM, although there is evidence from a prior VBM study that there may also be WM volumetric differences associated with personality [DeYoung et al., 2010]. Given that, we are currently acquiring diffusion tensor imaging (DTI) sequences from the same cohort, which may reveal differences in the orientation, integrity, and relative strength of WM tracts, analysis of WM volume will be performed in combination with DTI in a future study. This study is exploratory and employed stringent statistical criteria. Methodological differences (such as our use of RAVENS maps methodology and the use of different statistical thresholds), as well as the much older age of our cohort, likely explain the different findings of our study and of a previous exploratory study of personality [DeYoung et al., 2010]. To increase confidence that reported associations reflect nonartifactual relations between brain structure and trait personality, we only report associations replicable across two time points surviving FWE‐correction for multiple comparisons. Our main goal has been to establish a set of reliable associations and motivate future hypothesis‐driven research on the brain correlates of personality.
N reflects proneness to experience negative emotions [Canli, 2004; Haas et al., 2006a; McCrae and Costa, 2003]. In this study, higher N was associated with smaller (R) lateral OFC, in agreement with similar OFC findings in trait anxiety [Roppongi et al., 2010], anxiety disorder [van Tol et al., 2010] and depression [Lacerda et al., 2004]. Moreover, our observation of lower (R) dorsolateral PFC volume in relation to higher N may be related to the recent finding of decreased volume of this region in individuals at genetic risk for depression [Amico et al., 2010]. The positive association of N with ventral visual stream areas may reflect their engagement during emotional memory processing [Murty et al., 2010], which may be overactive in individuals with high N.
E, a trait reflecting proneness to experience positive emotions and engage in social interactions [Canli et al., 2001; Lucas and Diener, 2001; McCrae and Costa, 2003], was associated with larger cortical volume within (L) aCG, dorsolateral PFC and temporal regions. Regions of L PFC have been previously associated with E in a methodologically sound study in teenagers [Blankstein et al., 2009]. Left lateralized frontal activation has been observed in many positive emotion processing paradigms and has been related to E: individuals with high E show greater (L) aCG activation at rest [Johnson et al., 1999] and in response to positive emotional stimuli [Canli et al., 2004; Haas et al., 2006b], asymmetric (L) predominant frontal activation marks positive affect and approach tendencies [Davidson, 2004; Tomarken et al., 1992] and (L) dorsolateral PFC activation leads to suppression of sadness [Johnstone et al., 2007; Levesque et al., 2003; Ohira et al., 2006]. Our present findings suggest that chronic engagement of these frontal regions in individuals with high E may result in larger regional volumes or that pre‐existing volumetric differences in these regions result in differential levels of E. In regards to pro‐social aspects of E, the part of aCG associated with E is critical for decision making in social situations and for guiding social behavior [Behrens et al., 2009; Kennerley et al., 2006; Rushworth et al., 2007], while the (L) MTG (BA 21) is involved in emotion and intent‐related Theory of Mind (ToM) [Calarge et al., 2003; Ethofer et al., 2006], both important aspects of social cognition.
Our findings in regards to N and E do not overlap with some of of the findings of Wright et al. [ 2006, 2007]. This may be due to the older age of our cohort (in regards to the findings of [Wright et al., 2006]) and a different analytical approach (such as the facts that we adjusted for total ICV and implemented a single linear model including all personality Factors). As a result, the strong associations we detected between certain regions reported by Wright et al. with other Factors [such as the association between (R) BA 6 and (L) BA 10 with C] may have rendered any weaker associations with N and E nonsignificant. Similarly, unlike previous studies [DeYoung et al., 2010; Omura et al., 2005; Rauch et al., 2005], we did not find any positive association between E and medial OFC, perhaps due to the much older age of our cohort (compared with [DeYoung et al., 2010]), the fact that we adjusted for total ICV, and the fact that, having included all personality Factors in the same GLM (unlike [Omura et al., 2005; Rauch et al., 2005]), we found two large (R) medial OFC clusters to be negatively associated with O.
In general, O was negatively associated with areas implicated in cautionary and inhibitory responses, including the (R) medial OFC, and (L) fronto‐insular cortex, which responds to aversive physical [Jabbi et al., 2008; Wicker et al., 2003] and social stimuli [Kapogiannis et al., 2009; Sanfey, 2007] and fear of loss [Liu et al., 2007]. Moreover, Higher O was associated with larger frontopolar cortex, consistently with the prior finding of our team that frontopolar cortex resting‐state regional cerebral blood flow positively correlates with O in both sexes [Sutin et al., 2009]. The FP cortex plays important roles in cognitive control by maintaining certain tasks in temporary suspension while other tasks are being executed [Koechlin and Hyafil, 2007] and is a key area for creativity [de Souza et al., 2010]; its enlargement in individuals with high O may enable them to hold alternative courses of action in working memory and experiment with new options and ideas.
A is primarily a dimension of interpersonal tendencies and its positive association with (R) OFC volume may relate to the region's key role in social and moral cognition [Behrens et al., 2009; Moll et al., 2005] and trust [Phan et al., 2010]. Our finding is also in agreement with the positive correlation of (R) OFC volume with A in Frontotemporal Dementia [Rankin et al., 2004] and with empathy in a range of neurodegenerative diseases [Rankin et al., 2006]. On the other hand, the increase in A with smaller bilateral dorsomedial PFC, BA 8, is in agreement with the finding of decreased other‐critical sentiments associated with hypometabolism in this region in Frontotemporal Dementia patients [Moll et al., 2011].
Higher C was associated with enlargement of sensorimotor areas involved in motor planning (BA 3, 5, and 6), perhaps reflecting increased tendency for motor deliberation prior to execution. In particular, C was positively associated with rostral premotor cortex that is concerned with planning cognitively demanding tasks [Lindner et al., 2010; Picard and Strick, 2001], perhaps reflecting a tendency to think carefully before acting (C6 or Deliberation is a facet of C). In agreement with DeYoung et al. [ 2010], we found larger bilateral dorsomedial PFC, BA 8, in individuals with higher C, which we also interpret as a reflection of superior top down control on behavior based on rules and distant goals [DeYoung et al., 2010; du Boisgueheneuc et al., 2006; Rowe et al., 2000]. However, the compulsive tendencies, rigidity, and cognitive inflexibility associated with high C may be reflected by the finding of higher putamen and lower FP and OFC volumes [Fineberg et al., 2010].
CONCLUSIONS
Our findings provide a comprehensive account of structural GM correlates of personality based on reliable associations across two time points. Given that this study is correlational, our findings do not indicate causality and various interpretations are viable. First, systematically differing experiences because of personality may alter cortical plasticity over time. Regional plastic changes have been demonstrated for a range of persistently practiced activities, including development of complex visuomotor and musical skills [Draganski et al., 2004; Erickson et al., 2010; Gaser and Schlaug, 2003], formation of hippocampus‐mediated memories [Maguire et al., 2000, 2006] and enhancement of cognitive performance [Dickerson et al., 2008]. MRI‐measured plastic changes in GM are presumably due to changes in neuronal number and size [Mechelli et al., 2005] and synaptic density [Kleim et al., 1996]. Second, early individual differences in brain development may lead to predispositions toward certain personality traits in adulthood [Schwartz et al., 2010] and complex abilities, such as creativity or musical skills [Gaser and Schlaug, 2003; Takeuchi et al., 2010]. Finally, persistent application of personality traits may amplify inherent trends in the regional pattern of GM. Future research on the neural basis of personality is needed to elucidate causality.
Supporting information
Supporting Information
ACKNOWLEDGMENTS
The authors thank the neuroimaging and BLSA staffs at the NIA and Johns Hopkins University and the BLSA participants for their continued dedication to the study. They thank Joshua Goh and Jessica Metzler for assistance with the analysis.
Conflict of Interest: Paul Costa receives royalties for the NEO‐PI‐R.
REFERENCES
- Amico F, Meisenzahl E, Koutsouleris N, Reiser M, Moller HJ, Frodl T (2010): Structural MRI correlates for vulnerability and resilience to major depressive disorder. J Psychiatry Neurosci 36:15–22. [DOI] [PMC free article] [PubMed] [Google Scholar]
- Ashburner J, Friston KJ (2000): Voxel‐based morphometry‐the methods. Neuroimage 11( 6 Pt 1):805–821. [DOI] [PubMed] [Google Scholar]
- Behrens TE, Hunt LT, Rushworth MF (2009): The computation of social behavior. Science 324( 5931):1160–1164. [DOI] [PubMed] [Google Scholar]
- Blankstein U, Chen JY, Mincic AM, McGrath PA, Davis KD (2009): The complex minds of teenagers: Neuroanatomy of personality differs between sexes. Neuropsychologia 47:599–603. [DOI] [PubMed] [Google Scholar]
- Bouchard TJJr., Loehlin JC (2001): Genes, evolution, and personality. Behav Genet 31:243–273. [DOI] [PubMed] [Google Scholar]
- Calarge C, Andreasen NC, O'Leary DS (2003): Visualizing how one brain understands another: A PET study of theory of mind. Am J Psychiatry 160:1954–1964. [DOI] [PubMed] [Google Scholar]
- Canli T (2004): Functional brain mapping of extraversion and neuroticism: Learning from individual differences in emotion processing. J Pers 72:1105–1132. [DOI] [PubMed] [Google Scholar]
- Canli T, Zhao Z, Desmond JE, Kang E, Gross J, Gabrieli JD (2001): An fMRI study of personality influences on brain reactivity to emotional stimuli. Behav Neurosci 115:33–42. [DOI] [PubMed] [Google Scholar]
- Canli T, Amin Z, Haas B, Omura K, Constable RT (2004): A double dissociation between mood states and personality traits in the anterior cingulate. Behav Neurosci 118:897–904. [DOI] [PubMed] [Google Scholar]
- Costa PT, McCrae RR (1992): Revised NEO personality inventory (NEO PI‐R) and NEP five‐factor inventory (NEO‐FFI): Professional manual. Odessa, Fla. (P.O. Box 998, Odessa 33556): Psychol Assess Resour vi, pp101.
- Davatzikos C, Genc A, Xu D, Resnick SM (2001): Voxel‐based morphometry using the RAVENS maps: Methods and validation using simulated longitudinal atrophy. Neuroimage 14:1361–1369. [DOI] [PubMed] [Google Scholar]
- Davidson RJ (2004): Well‐being and affective style: Neural substrates and biobehavioural correlates. Philos Trans R Soc Lond 359:1395–1411. [DOI] [PMC free article] [PubMed] [Google Scholar]
- de Souza LC, Volle E, Bertoux M, Czernecki V, Funkiewiez A, Allali G, Leroy B, Sarazin M, Habert MO, Dubois B, Kas A, Levy R (2010): Poor creativity in frontotemporal dementia: A window into the neural bases of the creative mind. Neuropsychologia 48:3733–3742. [DOI] [PubMed] [Google Scholar]
- DeYoung CG, Shamosh NA, Green AE, Braver TS, Gray JR (2009): Intellect as distinct from openness: Differences revealed by fMRI of working memory. J Pers Soc Psychol 97:883–892. [DOI] [PMC free article] [PubMed] [Google Scholar]
- DeYoung CG, Hirsh JB, Shane MS, Papademetris X, Rajeevan N, Gray JR (2010): Testing predictions from personality neuroscience: Brain structure and the big five. Psychol Sci 21:820–828. [DOI] [PMC free article] [PubMed] [Google Scholar]
- Dickerson BC, Fenstermacher E, Salat DH, Wolk DA, Maguire RP, Desikan R, Pacheco J, Quinn BT, Van der Kouwe A, Greve DN, Blacker D, Albert MS, Killiany RJ, Fischl B (2008): Detection of cortical thickness correlates of cognitive performance: Reliability across MRI scan sessions, scanners, and field strengths. Neuroimage 39:10–18. [DOI] [PMC free article] [PubMed] [Google Scholar]
- Drabant EM, McRae K, Manuck SB, Hariri AR, Gross JJ (2009): Individual differences in typical reappraisal use predict amygdala and prefrontal responses. Biol Psychiatry 65:367–373. [DOI] [PMC free article] [PubMed] [Google Scholar]
- Draganski B, Gaser C, Busch V, Schuierer G, Bogdahn U, May A (2004): Neuroplasticity: Changes in grey matter induced by training. Nature 427:311–312. [DOI] [PubMed] [Google Scholar]
- Driscoll I, Davatzikos C, An Y, Wu X, Shen D, Kraut M, Resnick SM (2009): Longitudinal pattern of regional brain volume change differentiates normal aging from MCI. Neurology 72:1906–1913. [DOI] [PMC free article] [PubMed] [Google Scholar]
- du Boisgueheneuc F, Levy R, Volle E, Seassau M, Duffau H, Kinkingnehun S, Samson Y, Zhang S, Dubois B (2006): Functions of the left superior frontal gyrus in humans: A lesion study. Brain 129( Pt 12):3315–3328. [DOI] [PubMed] [Google Scholar]
- Erickson KI, Boot WR, Basak C, Neider MB, Prakash RS, Voss MW, Graybiel AM, Simons DJ, Fabiani M, Gratton G, Kramer AF (2010): Striatal volume predicts level of video game skill acquisition. Cereb Cortex 20:2522‐2530. [DOI] [PMC free article] [PubMed] [Google Scholar]
- Ethofer T, Anders S, Erb M, Herbert C, Wiethoff S, Kissler J, Grodd W, Wildgruber D (2006): Cerebral pathways in processing of affective prosody: A dynamic causal modeling study. Neuroimage 30:580–587. [DOI] [PubMed] [Google Scholar]
- Fineberg NA, Potenza MN, Chamberlain SR, Berlin HA, Menzies L, Bechara A, Sahakian BJ, Robbins TW, Bullmore ET, Hollander E (2010): Probing compulsive and impulsive behaviors, from animal models to endophenotypes: A narrative review. Neuropsychopharmacology 35:591–604. [DOI] [PMC free article] [PubMed] [Google Scholar]
- Gaser C, Schlaug G (2003): Brain structures differ between musicians and non‐musicians. J Neurosci 23:9240–9245. [DOI] [PMC free article] [PubMed] [Google Scholar]
- Goldberg LR (1990): An alternative “description of personality”: The big‐five factor structure. J Pers Soc Psychol 59:1216–1229. [DOI] [PubMed] [Google Scholar]
- Goldszal AF, Davatzikos C, Pham DL, Yan MX, Bryan RN, Resnick SM (1998): An image‐processing system for qualitative and quantitative volumetric analysis of brain images. J Comput Assist Tomogr 22:827–837. [DOI] [PubMed] [Google Scholar]
- Gusnard DA, Ollinger JM, Shulman GL, Cloninger CR, Price JL, Van Essen DC, Raichle ME (2003): Persistence and brain circuitry. Proc Natl Acad Sci USA 100:3479–3484. [DOI] [PMC free article] [PubMed] [Google Scholar]
- Haas BW, Omura K, Amin Z, Constable RT, Canli T (2006a)Functional connectivity with the anterior cingulate is associated with extraversion during the emotional Stroop task. Soc Neurosci 1:16–24. [DOI] [PubMed] [Google Scholar]
- Haas BW, Omura K, Constable RT, Canli T (2006b)Interference produced by emotional conflict associated with anterior cingulate activation. Cogn Affect Behav Neurosci 6:152–156. [DOI] [PubMed] [Google Scholar]
- Jabbi M, Bastiaansen J, Keysers C (2008): A common anterior insula representation of disgust observation, experience and imagination shows divergent functional connectivity pathways. PLoS One 3:e2939. [DOI] [PMC free article] [PubMed] [Google Scholar]
- Johnson DL, Wiebe JS, Gold SM, Andreasen NC, Hichwa RD, Watkins GL, Boles Ponto LL (1999): Cerebral blood flow and personality: A positron emission tomography study. Am J Psychiatry 156:252–257. [DOI] [PubMed] [Google Scholar]
- Johnstone T, van Reekum CM, Urry HL, Kalin NH, Davidson RJ (2007): Failure to regulate: Counterproductive recruitment of top‐down prefrontal‐subcortical circuitry in major depression. J Neurosci 27:8877–8884. [DOI] [PMC free article] [PubMed] [Google Scholar]
- Kabani N, Dorr AE, Lerch JP, Spring S, Henkelman RM (2008): High resolution three‐dimensional brain atlas using an average magnetic resonance image of 40 adult C57Bl/6J mice. Neuroimage 42:60–69. [DOI] [PubMed] [Google Scholar]
- Kapogiannis D, Barbey AK, Su M, Zamboni G, Krueger F, Grafman J (2009): Cognitive and neural foundations of religious belief. Proc Natl Acad Sci USA 106:4876–4881. [DOI] [PMC free article] [PubMed] [Google Scholar]
- Kennerley SW, Walton ME, Behrens TE, Buckley MJ, Rushworth MF (2006): Optimal decision making and the anterior cingulate cortex. Nat Neurosci 9:940–947. [DOI] [PubMed] [Google Scholar]
- Kim SH, Hwang JH, Park HS, Kim SE (2008): Resting brain metabolic correlates of neuroticism and extraversion in young men. Neuroreport 19:883–886. [DOI] [PubMed] [Google Scholar]
- Kleim JA, Lussnig E, Schwarz ER, Comery TA, Greenough WT (1996): Synaptogenesis and Fos expression in the motor cortex of the adult rat after motor skill learning. J Neurosci 16:4529–4535. [DOI] [PMC free article] [PubMed] [Google Scholar]
- Koechlin E, Hyafil A (2007): Anterior prefrontal function and the limits of human decision‐making. Science 318:594–598. [DOI] [PubMed] [Google Scholar]
- Kosslyn SM, Cacioppo JT, Davidson RJ, Hugdahl K, Lovallo WR, Spiegel D, Rose R (2002): Bridging psychology and biology. The analysis of individuals in groups. Am Psychol 57:341–351. [PubMed] [Google Scholar]
- Kumari V, ffytche DH, Williams SC, Gray JA (2004): Personality predicts brain responses to cognitive demands. J Neurosci 24:10636–10641. [DOI] [PMC free article] [PubMed] [Google Scholar]
- Lacerda AL, Keshavan MS, Hardan AY, Yorbik O, Brambilla P, Sassi RB, Nicoletti M, Mallinger AG, Frank E, Kupfer DJ, Soares JC (2004): Anatomic evaluation of the orbitofrontal cortex in major depressive disorder. Biol Psychiatry 55:353–358. [DOI] [PubMed] [Google Scholar]
- Lancaster JL, Woldorff MG, Parsons LM, Liotti M, Freitas CS, Rainey L, Kochunov PV, Nickerson D, Mikiten SA, Fox PT (2000): Automated Talairach atlas labels for functional brain mapping. Hum Brain Mapp 10:120–131. [DOI] [PMC free article] [PubMed] [Google Scholar]
- Lebreton M, Barnes A, Miettunen J, Peltonen L, Ridler K, Veijola J, Tanskanen P, Suckling J, Jarvelin MR, Jones PB, Isohanni M, Bullmore ET, Murray GK (2009): The brain structural disposition to social interaction. Eur J Neurosci 29:2247–2252. [DOI] [PubMed] [Google Scholar]
- Levesque J, Eugene F, Joanette Y, Paquette V, Mensour B, Beaudoin G, Leroux JM, Bourgouin P, Beauregard M (2003): Neural circuitry underlying voluntary suppression of sadness. Biol Psychiatry 53:502–510. [DOI] [PubMed] [Google Scholar]
- Lindner A, Iyer A, Kagan I, Andersen RA (2010): Human posterior parietal cortex plans where to reach and what to avoid. J Neurosci 30:11715–11725. [DOI] [PMC free article] [PubMed] [Google Scholar]
- Liu X, Powell DK, Wang H, Gold BT, Corbly CR, Joseph JE (2007): Functional dissociation in frontal and striatal areas for processing of positive and negative reward information. J Neurosci 27:4587–4597. [DOI] [PMC free article] [PubMed] [Google Scholar]
- Lucas RE, Diener E (2001): Understanding extraverts' enjoyment of social situations: The importance of pleasantness. J Pers Soc Psychol 81:343–356. [DOI] [PubMed] [Google Scholar]
- Maguire EA, Gadian DG, Johnsrude IS, Good CD, Ashburner J, Frackowiak RS, Frith CD (2000): Navigation‐related structural change in the hippocampi of taxi drivers. Proc Natl Acad Sci USA 97:4398–4403. [DOI] [PMC free article] [PubMed] [Google Scholar]
- Maguire EA, Woollett K, Spiers HJ (2006): London taxi drivers and bus drivers: A structural MRI and neuropsychological analysis. Hippocampus 16:1091–1101. [DOI] [PubMed] [Google Scholar]
- Markon KE, Krueger RF, Watson D (2005): Delineating the structure of normal and abnormal personality: An integrative hierarchical approach. J Pers Soc Psychol 88:139–157. [DOI] [PMC free article] [PubMed] [Google Scholar]
- McCrae RR, Costa PT (2003): Personality in adulthood: A five‐factor theory perspective. New York:Guilford Press; xii, pp268. [Google Scholar]
- McCrae RR, Terracciano A, Project PPC (2005): Universal features of personality traits from the observer's perspective: Data from 50 cultures. J Pers Soc Psychol 88:547–561. [DOI] [PubMed] [Google Scholar]
- Mechelli A, Friston KJ, Frackowiak RS, Price CJ (2005): Structural covariance in the human cortex. J Neurosci 25:8303–8310. [DOI] [PMC free article] [PubMed] [Google Scholar]
- Mischel W (2004): Toward an integrative science of the person. Annu Rev Psychol 55:1–22. [DOI] [PubMed] [Google Scholar]
- Misra C, Fan Y, Davatzikos C (2009): Baseline and longitudinal patterns of brain atrophy in MCI patients, and their use in prediction of short‐term conversion to AD: Results from ADNI. Neuroimage 44:1415–1422. [DOI] [PMC free article] [PubMed] [Google Scholar]
- Moll J, Zahn R, de Oliveira‐Souza R, Krueger F, Grafman J (2005): Opinion: The neural basis of human moral cognition. Nat Rev 6:799–809. [DOI] [PubMed] [Google Scholar]
- Moll J, Zahn R, de Oliveira‐Souza R, Bramati IE, Krueger F, Tura B, Cavanagh AL, Grafman J (2011): Impairment of prosocial sentiments is associated with frontopolar and septal damage in frontotemporal dementia. Neuroimage 54:1735–1742. [DOI] [PMC free article] [PubMed] [Google Scholar]
- Murty VP, Ritchey M, Adcock RA, LaBar KS (2010): fMRI studies of successful emotional memory encoding: A quantitative meta‐analysis. Neuropsychologia 48:3459–3469. [DOI] [PMC free article] [PubMed] [Google Scholar]
- O'Gorman RL, Kumari V, Williams SC, Zelaya FO, Connor SE, Alsop DC, Gray JA (2006): Personality factors correlate with regional cerebral perfusion. Neuroimage 31:489–495. [DOI] [PubMed] [Google Scholar]
- Ohira H, Nomura M, Ichikawa N, Isowa T, Iidaka T, Sato A, Fukuyama S, Nakajima T, Yamada J (2006): Association of neural and physiological responses during voluntary emotion suppression. Neuroimage 29:721–733. [DOI] [PubMed] [Google Scholar]
- Omura K, Todd Constable R, Canli T (2005): Amygdala gray matter concentration is associated with extraversion and neuroticism. Neuroreport 16:1905–1908. [DOI] [PubMed] [Google Scholar]
- Pham DL, Prince JL (1999): Adaptive fuzzy segmentation of magnetic resonance images. IEEE Trans Med Imaging 18:737–752. [DOI] [PubMed] [Google Scholar]
- Phan KL, Sripada CS, Angstadt M, McCabe K (2010): Reputation for reciprocity engages the brain reward center. Proc Natl Acad Sci USA 107:13099–13104. [DOI] [PMC free article] [PubMed] [Google Scholar]
- Picard N, Strick PL (2001): Imaging the premotor areas. Curr Opin Neurobiol 11:663–672. [DOI] [PubMed] [Google Scholar]
- Plomin R, Kosslyn SM (2001): Genes, brain and cognition. Nat Neurosci 4:1153–1154. [DOI] [PubMed] [Google Scholar]
- Pocnet C, Rossier J, Antonietti JP, von Gunten A (2011): Personality changes in patients with beginning Alzheimer disease. Can J Psychiatry 56:408–417. [DOI] [PubMed] [Google Scholar]
- Rankin KP, Rosen HJ, Kramer JH, Schauer GF, Weiner MW, Schuff N, Miller BL (2004): Right and left medial orbitofrontal volumes show an opposite relationship to agreeableness in FTD. Dement Geriatr Cogn Disord 17:328–332. [DOI] [PMC free article] [PubMed] [Google Scholar]
- Rankin KP, Gorno‐Tempini ML, Allison SC, Stanley CM, Glenn S, Weiner MW, Miller BL (2006): Structural anatomy of empathy in neurodegenerative disease. Brain 129( Pt 11):2945–2956. [DOI] [PMC free article] [PubMed] [Google Scholar]
- Rauch SL, Milad MR, Orr SP, Quinn BT, Fischl B, Pitman RK (2005): Orbitofrontal thickness, retention of fear extinction, and extraversion. Neuroreport 16:1909–1912. [DOI] [PubMed] [Google Scholar]
- Resnick SM, Goldszal AF, Davatzikos C, Golski S, Kraut MA, Metter EJ, Bryan RN, Zonderman AB (2000): One‐year age changes in MRI brain volumes in older adults. Cereb Cortex 10:464–472. [DOI] [PubMed] [Google Scholar]
- Roppongi T, Nakamura M, Asami T, Hayano F, Otsuka T, Uehara K, Fujiwara A, Saeki T, Hayasaka S, Yoshida T, Shimizu R, Inoue T, Hirayasu Y (2010): Posterior orbitofrontal sulcogyral pattern associated with orbitofrontal cortex volume reduction and anxiety trait in panic disorder. Psychiatry Clin Neurosci 64:318–326. [DOI] [PubMed] [Google Scholar]
- Rowe JB, Toni I, Josephs O, Frackowiak RS, Passingham RE (2000): The prefrontal cortex: Response selection or maintenance within working memory? Science 288:1656–1660. [DOI] [PubMed] [Google Scholar]
- Rushworth MF, Behrens TE, Rudebeck PH, Walton ME (2007): Contrasting roles for cingulate and orbitofrontal cortex in decisions and social behaviour. Trends Cogn Sci 11:168–176. [DOI] [PubMed] [Google Scholar]
- Sanfey AG (2007): Social decision‐making: Insights from game theory and neuroscience. Science 318:598–602. [DOI] [PubMed] [Google Scholar]
- Schwartz CE, Kunwar PS, Greve DN, Moran LR, Viner JC, Covino JM, Kagan J, Stewart SE, Snidman NC, Vangel MG, Wallace SR (2010): Structural differences in adult orbital and ventromedial prefrontal cortex predicted by infant temperament at 4 months of age. Arch Gen Psychiatry 67:78–84. [DOI] [PMC free article] [PubMed] [Google Scholar]
- Shen D, Davatzikos C (2002): HAMMER: hierarchical attribute matching mechanism for elastic registration. IEEE Trans Med Imaging 21:1421–1439. [DOI] [PubMed] [Google Scholar]
- Sollberger M, Stanley CM, Wilson SM, Gyurak A, Beckman V, Growdon M, Jang J, Weiner MW, Miller BL, Rankin KP (2009): Neural basis of interpersonal traits in neurodegenerative diseases. Neuropsychologia 47:2812–2827. [DOI] [PMC free article] [PubMed] [Google Scholar]
- Sugiura M, Kawashima R, Nakagawa M, Okada K, Sato T, Goto R, Sato K, Ono S, Schormann T, Zilles K, Fukuda H (2000): Correlation between human personality and neural activity in cerebral cortex. Neuroimage 11( 5 Pt 1):541–546. [DOI] [PubMed] [Google Scholar]
- Sutin AR, Beason‐Held LL, Resnick SM, Costa PT (2009): Sex differences in resting‐state neural correlates of openness to experience among older adults. Cereb Cortex 19:2797–2802. [DOI] [PMC free article] [PubMed] [Google Scholar]
- Takeuchi H, Taki Y, Sassa Y, Hashizume H, Sekiguchi A, Fukushima A, Kawashima R (2010): Regional gray matter volume of dopaminergic system associate with creativity: Evidence from voxel‐based morphometry. Neuroimage 51:578–585. [DOI] [PubMed] [Google Scholar]
- Terracciano A, Costa PT, McCrae RR (2006): Personality plasticity after age 30. Pers Soc Psychol Bull 32:999–1009. [DOI] [PMC free article] [PubMed] [Google Scholar]
- Tomarken AJ, Davidson RJ, Henriques JB (1990): Resting frontal brain asymmetry predicts affective responses to films. J Pers Soc Psychol 59:791–801. [DOI] [PubMed] [Google Scholar]
- Tomarken AJ, Davidson RJ, Wheeler RE, Doss RC (1992): Individual differences in anterior brain asymmetry and fundamental dimensions of emotion. J Pers Soc Psychol 62:676–687. [DOI] [PubMed] [Google Scholar]
- van Tol MJ, van der Wee NJ, van den Heuvel OA, Nielen MM, Demenescu LR, Aleman A, Renken R, van Buchem MA, Zitman FG, Veltman DJ (2010): Regional brain volume in depression and anxiety disorders. Arch Gen Psychiatry 67:1002–1011. [DOI] [PubMed] [Google Scholar]
- Wicker B, Keysers C, Plailly J, Royet JP, Gallese V, Rizzolatti G (2003): Both of us disgusted in My insula: The common neural basis of seeing and feeling disgust. Neuron 40:655–664. [DOI] [PubMed] [Google Scholar]
- Wright CI, Williams D, Feczko E, Barrett LF, Dickerson BC, Schwartz CE, Wedig MM (2006): Neuroanatomical correlates of extraversion and neuroticism. Cereb Cortex 16:1809–1819. [DOI] [PubMed] [Google Scholar]
- Wright CI, Feczko E, Dickerson B, Williams D (2007): Neuroanatomical correlates of personality in the elderly. Neuroimage 35:263–272. [DOI] [PMC free article] [PubMed] [Google Scholar]
Associated Data
This section collects any data citations, data availability statements, or supplementary materials included in this article.
Supplementary Materials
Supporting Information