

Abstract
The human frontal lobe has undergone accelerated evolution, leading to the development of unique human features such as language and self-reflection. Cortical grey matter and underlying white matter reflect distinct cellular compositions in the frontal lobe. Surprisingly little is known about the transcriptomal landscape of these distinct regions. Here, for the first time, we report a detailed transcriptomal profile of the frontal grey (GM) and white matter (WM) with resolution to alternatively spliced isoforms obtained using the RNA-Seq approach. We observed more vigorous transcriptome activity in GM compared to WM, presumably because of the presence of cellular bodies of neurons in the GM and RNA associated with the nucleus and perinuclear space. Among the top differentially expressed genes, we also identified a number of long intergenic non-coding RNAs (lincRNAs), specifically expressed in white matter, such as LINC00162. Furthermore, along with confirmation of expression of known markers for neurons and oligodendrocytes, we identified a number of genes and splicing isoforms that are exclusively expressed in GM or WM with examples of GABRB2 and PAK2 transcripts, respectively. Pathway analysis identified distinct physiological and biochemical processes specific to grey and white matter samples with a prevalence of synaptic processes in GM and myelination regulation and axonogenesis in the WM. Our study also revealed that expression of many genes, for example, the GPR123, is characterized by isoform switching, depending in which structure the gene is expressed. Our report clearly shows that GM and WM have perhaps surprisingly divergent transcriptome profiles, reflecting distinct roles in brain physiology. Further, this study provides the first reference data set for a normal human frontal lobe, which will be useful in comparative transcriptome studies of cerebral disorders, in particular, neurodegenerative diseases.
Introduction
The human cerebrum is extraordinarily complex and is composed of billions of neurons and trillions of synaptic connections. Neurons are organized into circuit assemblies that are modulated by specific interneurons and non-neuronal cells. The frontal lobe is often considered the most highly developed and most human featured brain region. As the prefrontal and frontal cortexes exert executive type control over other structures, they are expected to show significant connectivity to other brain regions. This part of the brain manages the most complex thought, decision making, planning, conceptualization, attention control, and working memory [1,2].
Broadly speaking, the human cortex can be divided into the phylogenetically older allocortex and the newer neocortex. The neocortex has expanded the most in humans and is composed of six superimposed layers with distinct cellular compositions; the thickness of each layer differs in each cortical lobe [3]. The most prominent distinction of the cerebrum is its division into outer cortical grey matter (GM) and inner white matter (WM). GM consists of neural cell bodies, their dendrites, and parts of their axons, as well as glial cells, mainly astrocytes. In contrast, WM is mainly aggregations of myelinated and non-myelinated axons linking different cortical and subcortical regions [4]. Of long-neglected significance, WM has recently started to be a subject of intensive studies due its involvement in the development of working memory capacity and reading ability [5]. Recently, the frontal WM has been proposed as a major contributor to human brain enlargement and higher structural connectivity, as compared to other primates [6,7].
Despite several RNA-Seq-based studies investigating whole transcriptome profiles of cerebral tissue in pathological conditions such as Alzheimer’s disease (AD) [8,9] or autism [10] there has been no systematic attempt to investigate transcriptomic landscape of normal brain tissue with resolution of RNA sequencing. Hawrylycz and colleagues recently published a microarray-based transcriptome profile of the distinct brain regions in two individuals [11]. They provided important insights into the spatial distribution of expression across well-defined neuroanatomical regions. The critical conclusion of this study was the importance of local gene expression patterns for the maintenance of physiological uniqueness within these regions. Because this analysis was performed using microarray technology, it does not provide further information on posttranscriptional control in the brain, namely, alternative splicing.
Here, we report, for the first time, detailed transcriptome profiles of GM and WM of the human lobe using RNA-Seq. Comparative analysis of the gene and isoform expression, combined with the pathway analysis, revealed surprisingly distinct transcriptome patterns reflecting the contribution of different glial cell types and neuronal structures to WM and GM, respectively. Moreover we observe elevated expression of lincRNAs in WM, as well as isoform switching between WM and GM for genes encoding DNA binding proteins and proteins involved in signal transduction.
Materials and Methods
Human brain tissue
Human brain tissues were obtained from the Sydney Brain Bank and NSW Tissue Resource Centre, part of The Australian Brain Bank Network funded by the National Health and Medical Research Council of Australia. Ethics approval was from the University of New South Wales Human Research Ethics Committee. Frozen brain tissue samples from superior frontal gyrus (SFG) GM and WM were collected from three individuals aged 79, 94 and 98. The PMI of samples ranged 8-24 hrs and pH 5.77-6.65. All three brains were pathologically diagnosed and were free of any pathology or neurodegeneration.
RNA isolation, library preparation and sequencing
Total RNA was isolated using RNeasy Lipid Tissue Midi Kit (Qiagen) followed by RNase-free DNase treatment to remove traces of genomic DNA. The RNA quality of the total RNA was assessed using the Agilent 2100 Bioanalyser RNA Nano Chip and the RIN values ranged between 6.0 and 7.0. This RIN range was previously shown to have a little effect on relative gene expression ratios [12] (and our unpublished observations). Six RNA samples (three WM and three GM) were prepared for sequencing according to the Illumina TruSeq RNA sample preparation guide and subjected to 100 bp paired-end sequencing using Illumina HiSeq1000. The sequence data have been submitted to the NCBI Short Read Archive with accession number SRA091951.
Mapping of RNA-Seq reads using TopHat
Bioinformatics analysis was carried out using Galaxy; an open access web-based program that contains a variety of next-generation sequencing analysis tools including, TopHat and the Cufflinks package [13-15]. The Galaxy server was based at the Garvan Institute, Sydney, Australia. Using TopHat the reads were processed and aligned to the H. sapiens reference genome (build hg19). TopHat utilizes the ultra high-throughput short read aligner Bowtie to align the RNA-Seq reads, the reads are then analyzed and splice junctions between the exons are identified [16].The default parameters for TopHat were used. Subsequently the aligned reads from each sample were analyzed for 5’-3’ end bias using RSeQC [17].
Transcript assembly with Cufflinks
The aligned reads were processed with Cufflinks. Cufflinks assembles the RNA-Seq reads into individual transcripts, inferring the splicing structure of the genes [18]. Cufflinks assembles the data parsimoniously giving a minimal set of transcripts that fits the data. Cufflinks normalizes the RNA-Seq fragment counts to estimate the abundance of each transcript. Abundance was measured in the units of fragments per kilobase of exon per million fragments mapped (FPKM). For this analysis a .GTF annotation file (iGenomes UCSC hg19 gene annotation) was used to guide the assembly.
Differential analysis with Cuffmerge and Cuffdiff
The alignment files produced by TopHat are merged for CuffDiff processing so that combinatorial pairwise sample comparison is performed. The output GTF files from each of the Cufflinks analysis and the .GTF annotation file were sent to Cuffmerge [18]. Cuffmerge takes these files and amalgamates them into a single unified transcript catalog; it also filters out any transcribed fragments that may be artifacts. The inclusion of the reference annotation allows gene names and other details such as, transcript ID, exon number, transcription start site ID and coding sequence ID to be added to the merged transcript catalogue. It also allows for the gene and transcripts to be classified as known or novel. The merged GTF file was then fed to Cuffdiff along with the original alignment files produced from TopHat. Cuffdiff takes the replicates from each condition and looks for statistically significant changes in gene expression, transcript expression, splicing and promoter use. Cuffdiff uses a corrected p-value, known as the q-value to determine if the differences between the two groups are significant (q-value<0.05).
Visualization with CummeRbund and Interactive Genome Viewer
The resultant Cuffdiff output files were fed into CummeRbund. CummeRbund is an R package that is designed to simplify the analysis of the Cuffdiff outputs. CummeRbund is user friendly and allows for easy data exploration and figure generation [19]. The Broad Institutes Integrative Genome Viewer (IGV) (http://www.broadinstitute.org/igv/), was used to visualize Cufflinks GTF outputs, this allowed for comparisons to be made between genes of known structure and the gene structure of novel transcripts identified by Cufflinks [20,21].
Gene-set enrichment analysis with DAVID
The gene list of differential expressed genes was split into two groups; those up-regulated in GM and those up-regulated in WM. Only annotated genes can be utilized by enrichment tools, all novel genes and indecisively annotated genes were removed. Each of these lists was fed into the Database for Annotation, Visualization and Integrated Discovery (DAVID) (http://david.abcc.ncifcrf.gov/) [22]. DAVID tested the gene ontology (GO) terms for over representation in each of the gene lists. The GO terms list produced by DAVID, were processed using the ‘Enrichment Map’ plug in for Cytoscape (http://www.cytoscape.org/) [23]. This produces a visual output of the text based GO term lists.
In situ hybridization validation
Our RNA-Seq expression data were compared with in situ hybridization (ISH) data from the Allen brain atlas database (http://www.brain-map.org/), which uses RNA probes to measure gene expression in normal human dorsolateral frontal cortex.
Results
Total transcription in GM and WM
An expression catalogue containing 32,740 genes was created by the Cufflinks package. Of this catalogue, 18,362 of the genes were considered expressed in the analyzed brain samples. This number includes 3,615 unannotated genes, 44 small nucleolar RNAs (snoRNAs), 67 micro RNAs (miRNAs), 40 lincRNAs and 52 RNAs of uncharacterized function (locRNAs). Short non-coding RNA sequences were presumably derived from their polyadenylated long non-coding RNA parent transcript or might be carryovers captured during library preparation. The cumulative coverage of the expressed transcripts in GM and WM was approximately 37% of the entire human genome; this figure includes the transcribed introns that were spliced out. There was no significant difference between the total human genome coverage of GM and WM.
The developed isoform catalogue assembled by Cufflinks contained over 85,000 distinct isoforms (splice variants). Among these isoforms, 36,306 were identified as being expressed in the selected regions of brain tissue, including 3844 unannotated isoforms, which equates to approximately two isoforms per gene. The actual distribution of isoforms per gene reveals a different picture; there were 9,427 genes with 1 isoform and 8,653 genes with between two and seven isoforms. There were only 107 genes with eight or more isoforms. This suggests that almost 50% of genes undergo alternative splicing.
Analysis using RSeQC showed that the aligned reads from each RNA sample had a similar degree of bias towards the 3’ end of each transcript (Figure S1). This result was expected due to the poly-A selection of RNA for sequencing. Of note, the Cufflinks package, utilized in this study, has been designed to correct for any sequence bias that occurs due to steps undertaken during template preparation [24].
Differentially expressed genes and isoforms
Within in the set of 18,362 expressed genes, a total of 1,652 were identified as differentially expressed between the two conditions (q-value<0.05) (Figure 1). This included 1,218 that were up-regulated in GM and 434 that were up-regulated in WM (Table S1). Overall, there was a transcription bias toward GM. To preclude possible discordant results the gene lists were filtered so that any gene with an FPKM<1 for both conditions was excluded. An FPKM<1 means that there is less than one fragment per million aligned fragments mapped onto a 1-kb exon; this can be considered the result of background noise arising from erroneous sequencing or statistical errors during mapping. This reduced the overall list of differentially expressed genes to 1,591, of which 1,162 genes were up-regulated in GM and 429 genes were up-regulated in WM, the respective top 10 up-regulated genes in GM and WM by fold-change are shown in Table 1. Of the top 10 up-regulated genes in GM, there were two unannotated genes, and among the top 10 up-regulated genes in WM, there were three unannotated genes. On further inspection of the size and location of these genes, it was established that these genes fit the criteria for lincRNAs. Further, there was one annotated lincRNA (LINC00162) in the top 10 up-regulated genes in WM.
Figure 1. Volcano plot of gene expression in GM and WM.

The fold-change of the genes was relative to their expression in WM. Those genes with a negative fold-change were up-regulated in GM (down-regulated in WM) and those genes with a positive fold-change were up-regulated in WM (down-regulated in GM). Genes that were statistically significant (q-value<0.05) are shown in red and were listed in Table S1. This figure demonstrates that a larger number of genes were significantly up-regulated in GM (1218) than were up-regulated in WM (434). Overall there was a greater spread of data for the genes that are up-regulated in GM.
Table 1. Top 10 up-regulated genes in GM and WM.
|
Up-regulated in GM
|
|
||||||||
|---|---|---|---|---|---|---|---|---|---|
| Gene |
Description
|
Chrom. | FPKM GM | FPKM WM | Fold Change | q-value | Ensembl ID | ||
| CBLN4 | cerebellin 4 precursor |
chr20 | 9.98418 | 0.0288865 | 345.6348121 | 0.00290815 | ENSG00000054803 | ||
| - | intergenic, 1 exon, 5391bps |
chr10 | 1.04349 | 0.00475891 | 219.2707994 | 0.0473629 | not annotated | ||
| KCNS2 | potassium voltage-gated channel, delayed-rectifier, subfamily S, member 2 |
chr8 | 1.56421 | 0.00718485 | 217.7094859 | 4.20E-06 | ENSG00000156486 | ||
| SDR16C5 | short chain dehydrogenase/reductase family 16C, member 5 |
chr8 | 1.46311 | 0.00753222 | 194.2468489 | 0.0200461 | ENSG00000170786 | ||
| KIAA1239 | KIAA1239 | chr4 | 1.12395 | 0.00660563 | 170.1503112 | 0.000270041 | ENSG00000174145 | ||
| GLRA3 | glycine receptor, alpha 3 | chr4 | 1.31853 | 0.00902946 | 146.0253437 | 0.000379934 | ENSG00000145451 | ||
| C1QL3 | complement component 1, q subcomponent-like 3 | chr10 | 6.69439 | 0.0476218 | 140.5740648 | 0.00597669 | ENSG00000165985 | ||
| - | intergenic, 2 splice variants: 1st: 1 exon, 3048 bps 2nd: 2 exons, 2469 bps | chr17 | 2.88395 | 0.0245143 | 117.6435795 | 0.00298648 | not annotated | ||
| FLJ41278 | uncharacterized LOC400046 | chr12 | 1.74655 | 0.0150581 | 115.9874088 | 0.000318564 | ENSG00000255693 | ||
| SLC17A6 | solute carrier family 17 (sodium-dependent inorganic phosphate cotransporter), member 6 | chr11 | 2.44851 | 0.0226146 | 108.2712053 | 0.00269117 | ENSG00000091664 | ||
| Up-regulated in WM | |||||||||
| Gene | Description | Chrom. | FPKM GM | FPKM WM | Fold Change | q-value | Ensembl ID | ||
| SLC47A2 | solute carrier family 47, member 2 | chr17 | 0.0592195 | 4.7187 | 79.68152382 | 0.00109939 | ENSG00000180638 | ||
| - | intergenic, 1 exon, 6039 bps | chr7 | 0.0201173 | 1.58368 | 78.72229375 | 0.04031 | not annotated | ||
| CCDC19 | coiled-coil domain containing 19 | chr1 | 0.0212159 | 1.35457 | 63.84692613 | 0.0248006 | ENSG00000213085 | ||
| LINC00162 | long intergenic non-protein coding RNA 162 | chr21 | 0.0968483 | 5.6667 | 58.51109415 | 0.00926851 | ENSG00000224930 | ||
| SERPINA5 | serpin peptidase inhibitor, clade A (alpha-1 antiproteinase, antitrypsin), member 5 | chr14 | 0.0486903 | 1.87777 | 38.56558699 | 0.00467642 | ENSG00000188488 | ||
| - | intergenic, 2 splice varaints, both 2 exons. 1st: 3294 bps 2nd: 356 bps | chr5 | 0.0833172 | 2.88574 | 34.63558545 | 0.0163335 | not annotated | ||
| DAO | D-amino-acid oxidase | chr12 | 0.180005 | 6.11662 | 33.98027833 | 0.000196888 | ENSG00000110887 | ||
| - | intergenic, 2 exons, 6042 bps | chr17 | 0.0364359 | 1.18023 | 32.39195409 | 0.0345805 | not annotated | ||
| FFAR3 | free fatty acid receptor 3 | chr19 | 0.0459175 | 1.13566 | 24.73261828 | 0.0496471 | ENSG00000185897 | ||
| LTF | lactotransferrin | chr3 | 0.520221 | 12.5738 | 24.17011232 | 4.14E-06 | ENSG00000012223 | ||
Comparing the entirety of the lists, there were more lincRNAs in WM than GM (3 to 1). While there were more unannotated up-regulated genes in GM (80) than WM (57), the unannotated genes in WM represented a greater proportion of the up-regulated genes in WM than the proportion of up-regulated genes in GM represented by unannotated genes. A chi-squared statistical test was performed to determine if there was any statistically significant difference between the proportions of unannotated genes in each of the data sets. The chi-squared test conclusively showed that the difference in the proportions of unannotated genes in each data set was greater than what would be expected by chance alone (p<0.00005), suggesting that, overall, there was a statistically significant higher proportion of unannotated genes identified in WM.
Cuffdiff identified 36,306 isoforms in both GM and WM, including 3844 unannotated isoforms (Figure 2). Of this set, 882 isoforms were significantly differentially expressed between GM and WM (q-value<0.05), including 681 isoforms up-regulated in GM and 201 up-regulated in WM (Table S2). When the criteria of having at least one condition with an FPKM>1 was applied this list was reduced to a total of 856 isoforms, with 657 isoforms up-regulated in GM and 199 up-regulated in WM. The top ten differentially expressed isoforms sorted by fold-change from GM and WM respectively are listed in Table 2. This list shares almost no commonality with Table 1; only C1QL3 and FLJ41278 (up-regulated in GM) appear in both tables. All of the top 10 up-regulated isoforms in WM are unique to WM and have no expression in GM (Table 2). In fact, the top 24 up-regulated isoforms in WM were not detected at all in GM; in contrast, there was only one unique up-regulated isoform present in GM (Table S2).
Figure 2. Volcano plot of isoform expression in GM and WM.

The fold-change of the isoforms was relative to their expression in WM. Those isoforms with a negative fold-change were up-regulated in GM (down-regulated in WM) and those isoforms with a positive fold-change were up-regulated in WM (down-regulated in GM). Isoforms that were statistically significant (q-value<0.05) are shown in red and were listed in Table S2. This figure demonstrates that a larger number of isoforms were significantly up-regulated in GM (681) than were up-regulated in WM (201). Overall there was a greater spread of data for the isoforms that were up-regulated in GM, both in terms of fold-change and p-values.
Table 2. Top 10 up-regulated isoforms in GM and WM.
|
Up-regulated in GM
|
|||||||||
|---|---|---|---|---|---|---|---|---|---|
| Gene |
Description
|
Chrom. | FPKM GM | FPKM WM | Fold Change | q-value | Ensembl ID | ||
| KCNK12 | potassium channel, subfamily K, member 12 |
chr2 | 2.81439 | 0 | Unique to GM | 0.0441582 | ENSG00000184261 | ||
| OLFM3 | olfactomedin 3 |
chr1 | 2.6659 | 0.00538715 | 494.8627753 | 0.0477668 | ENSG00000118733 | ||
| KCNC1 | potassium voltage-gated channel, Shaw-related subfamily, member 1 |
ch 11 | 12.8201 | 0.0341285 | 375.6420587 | 0.0473807 | ENSG00000129159 | ||
| RIMS3 | regulating synaptic membrane exocytosis 3 |
chr1 | 28.2837 | 0.14296 | 197.8434527 | 0.0423304 | ENSG00000117016 | ||
| C1QL3 | complement component 1, q subcomponent-like 3 | chr10 | 6.69439 | 0.0433715 | 154.3499764 | 0.00357408 | ENSG00000165985 | ||
| GABRB2 | gamma-aminobutyric acid (GABA) A receptor, beta 2 | chr5 | 17.313 | 0.112452 | 153.9590225 | 8.69E-08 | ENSG00000145864 | ||
| RAB27B | RAB27B, member RAS oncogene family | chr18 | 3.83441 | 0.0286122 | 134.0131133 | 0.0100352 | ENSG00000041353 | ||
| GALNT9 | UDP-N-acetyl-alpha-D-galactosamine:polypeptide N-acetylgalactosaminyltransferase 9 (GalNAc-T9) | chr12 | 15.68 | 0.123142 | 127.3326728 | 0.0454933 | ENSG00000182870 | ||
| CAMK2A | calcium/calmodulin-dependent protein kinase II alpha | chr5 | 79.8284 | 0.664104 | 120.2046667 | 0.018091 | ENSG00000070808 | ||
| RGS4 | regulator of G-protein signaling 4 | chr1 | 56.2238 | 0.476735 | 117.9351212 | 2.53E-05 | ENSG00000117152 | ||
| Up-regulated in WM | |||||||||
| Gene | Description | Chrom. | FPKM GM | FPKM WM | Fold Change | q-value | Ensembl ID | ||
| EIF3F | eukaryotic translation initiation factor 3, subunit F | chr11 | 0 | 16.3903 | Unique to WM | 0.00528201 | ENSG00000175390 | ||
| SUPT5H | suppressor of Ty 5 homolog (S. cerevisiae) | chr19 | 0 | 13.427 | Unique to WM | 0.0474906 | ENSG00000196235 | ||
| KIFAP3 | kinesin-associated protein 3 | chr1 | 0 | 8.74404 | Unique to WM | 0.000345075 | ENSG00000075945 | ||
| ATP6V1H | ATPase, H+ transporting, lysosomal 50/57kDa, V1 subunit H | chr8 | 0 | 8.14233 | Unique to WM | 0.00382367 | ENSG00000047249 | ||
| FLNB | filamin B, beta | chr3 | 0 | 7.70063 | Unique to WM | 0.00648399 | ENSG00000136068 | ||
| PAK2 | p21 protein (Cdc42/Rac)-activated kinase 2 | chr3 | 0 | 6.18142 | Unique to WM | 0.00233423 | ENSG00000180370 | ||
| ZDHHC3 | zinc finger, DHHC-type containing 3 | chr3 | 0 | 6.10182 | Unique to WM | 0.0064209 | ENSG00000163812 | ||
| SEZ6L2 | seizure related 6 homolog (mouse)-like 2 | chr16 | 0 | 5.73869 | Unique to WM | 0.0315557 | ENSG00000174938 | ||
| DCAF7 | DDB1 and CUL4 associated factor 7 | chr17 | 0 | 4.83543 | Unique to WM | 0.0155276 | ENSG00000136485 | ||
| MECP2 | methyl CpG binding protein 2 (Rett syndrome) | chrX | 0 | 4.18897 | Unique to WM | 0.00357408 | ENSG00000169057 | ||
G protein-coupled receptor 123
The G protein-coupled receptor 123 (GPR123) gene had one such isoform that was uniquely expressed in WM. However, when analyzed as an entire gene, GPR123 was found to be 5-fold up-regulated in GM, with overall expression levels of 10 FPKM in GM and 2 FPKM in WM. Further investigation revealed unique splicing patterns that underline the importance of analyzing genes at the isoform level.
Overall, there were four splice variants identified in both GM and WM, including two previously identified splice variants—GPR123-002 (ENST00000392607) and GPR123-003 (ENST0000039606)—and two novel splice variants—GPR123-004 and GPR123-005 (Figure 3). The two previously identified isoforms (GPR123-002 and GPR123-003) are both protein coding; GPR123-003, with its extended N-terminal, can be considered a full-length, fully functional protein. By comparison, GPR123-002 was missing the first four exons. Its first exon is an untranslated alternate exon. The translation of GPR123-002 results in a 97-amino acid N-terminal truncated protein. The exon structure of the novel isoform GPR123-004 was most similar to GPR123-003, but it lacks the 5th exon. The lack of this exon is predicated to result in a 199-amino acid truncation at the C-Terminal end of the GPR123-004 protein when compared to GPR123-003. GPR123-005 was most similar to GPR123-002, albeit with a slight modification to the 5’ region. Translation of GPR123-005 was predicted to result in a protein similar to GPR123-002. Among the four GPR123 isoforms, three different transcription start sites (TSS) were identified and GPR123-003 and GPR123-004 had the same TSS, while the two N-terminal truncated isoforms (GPR123-002 and GPR123-005) both utilized unique TSS.
Figure 3. Splice variants of GPR123.

The intron/exon structure of the four GPR123 isoforms. GPR123-002 and GPR123-003 have been identified previously. GPR123-003 is considered the full-length isoform. GPR123-004 and GPR123-005 were previously unannotated.
In GM, the dominant isoform was found to be the novel truncated isoform GPR123-005. This isoform contributed to approximately 70% of the total GPR123 expression in GM, and the full length protein coding isoform GPR123-003 and the truncated protein coding isoform GPR123-002 contributed to approximately 20% and 10% of the total GPR123 expression seen in GM, respectively (Figure 4). These three isoforms were all expressed at a higher level in GM when compared to WM, with the 13-fold up-regulation of the GPR123-005 considered to be statistically significant. The TSS of GPR123-005 was also up-regulated in GM. GPR123-004 was not expressed at all in GM. In WM, the three GM expressed isoforms were expressed at very low levels (<0.6 FPKM). In GPR123-004, the isoform that was not expressed in GM becomes the dominant isoform, contributing to 70% of all expression of GPR123 in WM. In this case, the full length protein coding isoform GPR123-003 contributed to only 1.5% of the total GPR123 expression. Between GM and WM, there was a switch in the dominant GPR123 isoforms from GPR123-005 to GPR123-004. Interestingly, although total GPR123 was expressed at a lower level in WM than GM, the dominant isoform contributed to the same percentage of the overall expression.
Figure 4. Expression levels of the GPR123 isoforms.

GPR123-004 was not expressed at all in GM, but became the dominant isoform in WM. GPR123-002, GPR123-003 and GPR123-005 all had reduced expressed in WM. The TSS for GPR123-005 was also up-regulated in GM. The changes in expression of GPR123-003 and GPR123-003 were statisitically significant (q-value<0.05). Error bars are ± standard error.
The isoform expression patterns of the genes that had the top three annotated differently expressed isoforms in GM and the top three annotated differently expressed isoforms in WM were also analyzed (Figure S2-S7) and shown that the total expression levels of many genes result from dominant expression of one of the isoforms whereas the remaining splice variants are marginally present. Thus it is important to examine gene expression with resolution to individual transcriptional isoforms.
Expression of well-known cell type markers
While few studies explore the transcriptome profiles of GM and WM, there are a number of well-characterized cell type markers [25]. As the cellular make up of GM and WM is considerably different, certain cell type markers were used to reflect the composition of the respective regions; in this case, established neuronal markers were used as surrogate markers for GM and established oligodendrocyte markers were used as surrogate markers for WM (Table 3). While oligodendrocytes are not entirely specific to WM, they would be expected to appear at a higher expression level in WM than GM.
Table 3. Cell type markers.
|
Neuronal markers
|
||||||||
|---|---|---|---|---|---|---|---|---|
| Gene | Description | Chrom. | FPKM GM | FPKM WM | Fold Change | q-value | Significant | Ensembl ID |
| NEFL | neurofilament, light polypeptide | chr8 | 204.57 | 2.89839 | 70.58056369 | 1.00E-06 | yes | ENSG00000104725 |
| GABRA1 | gamma-aminobutyric acid (GABA) A receptor, alpha 1 | chr5 | 18.8275 | 0.358014 | 52.58872558 | 0.00155552 | yes | ENSG00000022355 |
| SYT1 | synaptotagmin I | chr12 | 87.9017 | 1.49415 | 58.83057257 | 0.000873923 | yes | ENSG00000067715 |
| SLC12A5 | solute carrier family 12 (potassium/chloride transporter), member 5 | chr20 | 31.4802 | 0.808493 | 38.93688628 | 1.17E-08 | yes | ENSG00000124140 |
| SV2B | synaptic vesicle glycoprotein 2B | chr15 | 16.0663 | 1.40407 | 11.44266312 | 0.000361367 | yes | ENSG00000185518 |
| SNAP25 | synaptosomal-associated protein, 25kDa | chr20 | 974.198 | 34.271 | 28.42630796 | 0.173004 | no | ENSG00000132639 |
| KCNQ2 | potassium voltage-gated channel, KQT-like subfamily, member 2 | chr20 | 1.31699 | 0 | Unique to GM | 0.780598 | no | ENSG00000075043 |
| Oligodendrocyte markers | ||||||||
| Gene | Description | Chrom. | FPKM GM | FPKM WM | Fold Change | q-value | Significant | Ensembl ID |
| SOX10 | SRY (sex determining region Y)-box 10 | chr22 | 20.4556 | 133.049 | 6.504282446 | 0.0450965 | yes | ENSG00000100146 |
| GJC2 | gap junction protein, gamma 2, 47kDa | chr1 | 7.88551 | 57.9386 | 7.347476574 | 4.56E-07 | yes | ENSG00000198835 |
| MOG | myelin oligodendrocyte glycoprotein | chr6 | 8.33271 | 49.0835 | 5.890460606 | 0.000313549 | yes | ENSG00000204655 |
| MAG | myelin associated glycoprotein | chr19 | 62.8597 | 530.705 | 8.442690627 | 1.60E-05 | yes | ENSG00000105695 |
| MAL | mal, T-cell differentiation protein | chr2 | 68.0608 | 546.616 | 8.03128967 | 0.0139824 | yes | ENSG00000172005 |
| GAL3ST1 | galactose-3-O-sulfotransferase 1 | chr22 | 6.15286 | 41.0321 | 6.668784923 | 0.000107928 | yes | ENSG00000128242 |
| UGT8 | UDP glycosyltransferase 8 | chr4 | 23.6732 | 88.8345 | 3.752534512 | 0.00966086 | yes | ENSG00000174607 |
| CSPG4 | chondroitin sulfate proteoglycan 4 | chr15 | 2.95805 | 4.12994 | 1.396169774 | 0.732599 | no | ENSG00000173546 |
| PDGFRA | platelet-derived growth factor receptor, alpha polypeptide | chr4 | 4.67575 | 4.8763 | 1.042891515 | 0.992145 | no | ENSG00000134853 |
| MOBP | myelin-associated oligodendrocyte basic protein | chr3 | 160.105 | 851.149 | 5.316192499 | 0.374118 | no | ENSG00000168314 |
Seven neuronal markers were chosen, all of which were expressed at higher levels in GM than WM. For five of these genes (NEFL, GABRA1, SYT1, SLC12A5, SV2B), the up-regulation in GM was statistically significant (q-value<0.05) (Figure 5). The neuronal markers clearly correlate with GM, showing limited to no expression in WM. Ten different oligodendrocyte markers were chosen; all were expressed at a higher level in WM than in GM. Seven of these genes (SOX10, GJC2, MOG, MAG, MAL, GAL3ST1, and UGT8) were considered differentially expressed, being up-regulated in WM (q-value<0.05) (Figure 6). These results demonstrate that a correlation exists between the cellular composition of GM and WM and the results produced by the transcriptome sequencing.
Figure 5. Heatmap of gene expression of neuronal cell markers.

Shows the expression profile of neuronal cell markers in GM and WM. There was an expression bias towards GM with the up-regulation of NEFL, GABRA1, SYT1, SLC12A5, SV2B being statistically significant (q-value<0.05).
Figure 6. Heatmap of gene expression of oligodendrocyte cell markers.

Shows the expression profile of oligodendrocyte cell markers in GM and WM. There was an expression bias towards WM with the up-regulation of SOX10, GJC2, MOG, MAG, MAL, GAL3ST1, UGT8 being statistically significant (q-value<0.05).
Validation with in situ hybridization
Six genes from the RNA-Seq dataset were selected for further validation through the use of the Allen Brain Atlas ISH database. The first two selected genes were neurofilament heavy polypeptide (NEFH) and myelin oligodendrocyte glycoprotein (MOG). NEFH encodes for neurofilament-heavy polypeptides, which are present in the chains that form one of the integral components in neuronal cytoskeleton neurofilaments, making it a relevant gene for the neuron rich GM [26,27]. NEFH had a FPKM of 57.76 in GM and a FPKM of 0.95 in WM. MOG is myelin specific in the central nervous system, and its expression level parallels the myelination of axons, suggesting that it plays an integral role in WM [28]. MOG had a FPKM of 8.33 in GM and 49.08 in WM. The ISH results (Figure 7) correlate strongly with the RNA-Seq data. As expected, the NEFH ISH slide shows a higher level of expression in GM, while there is almost no expression in WM. Conversely, the ISH slides of MOG confirm that MOG is expressed at its highest level in WM. The other four genes (RGS4, CAMK2A, SLC17A7, NEFM) which were selected for validation with in situ hybridization also correlated well with the RNA-Seq data (Figure S8). Again, these results demonstrate the accuracy of the RNA-Seq results.
Figure 7. Allen Human Brain Atlas in situ hybridisation for NEFH and MOG genes.
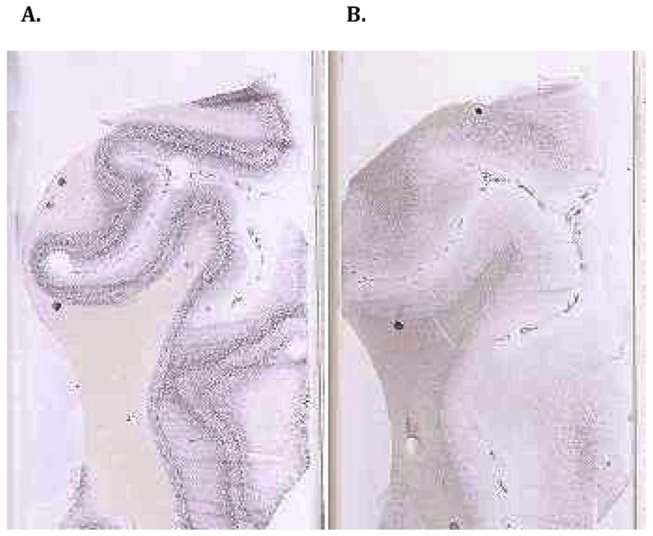
A. NEFH: Neurofilament, Heavy Polypeptide GM FPKM: 57.76 WM FPKM: 0.95. Slide from the dorsolateral cortex of a healthy 20-year-old male. The slide shows high levels of expression in GM B. MOG: Myelin Oligodendrocyte Glycoprotein GM FPKM: 8.33 WM FPKM: 49.08. Slide from the dorsolateral cortex of a healthy 20-year-old male. The slide shows high level of expression in WM. Source: Allen Human Brain Atlas (Hawrylycz et al. 2012 and ©2012 Allen Institute for Brain Science. Allen Human Brain Atlas [Internet]. Available from: http://human.brain-map.org/).
Novel gene markers for grey matter and white matter
Validation of the RNA-Seq results via in situ hybridization and correlation with well-known cell type makers demonstrated that RNA-Seq is biologically accurate and thus a useful tool for transcriptome profiling of the human brain. Strict selection criteria were applied to all genes that were up-regulated in GM to define a normal healthy GM transcriptome. The criteria included genes that were >20-fold up-regulated in GM, had an FPKM>5 in GM, and had an FPKM<1 in WM. The aim of this selection stringency was to find genes that were expressed at significantly high levels in GM while not being expressed at all in WM. The criteria reduced the number of genes differentially expressed in GM from 1,218 to 145 (Table S3). As there is less transcriptional activity in WM, the selection criteria were relaxed to the following: >4 fold up-regulation in WM, an FPKM>5 in WM, and a FPKM <5 in GM. These criteria reduced the list of significantly expressed genes in WM from 434 to 76 (Table S3). The top 40 genes from both GM and WM are shown in the form of a heat map (Figure 8). The heat map shows that a marked contrast exists between the refined expression profiles of the two tissue types. In the genes selected as GM markers, the differences between the two tissue types were more distinct than the expression differences seen in the WM. As WM is a less transcriptionally active tissue when compared to GM, WM may experience a flow of RNA from the more transcriptionally active GM. These two gene lists set a baseline for the expression profiles for healthy GM and WM.
Figure 8. Heatmap of high abundant genes specifically expressed in GM and WM.

The following cut-offs were applied to the WM differentially expressed gene list; >4 fold up-regulation in WM, an FPKM>5 in WM and a FPKM <5 in GM. The following cut-offs were applied to the GM differentially expressed gene list; >20-fold up-regulated in GM, had an FPKM>5 in GM and an FPKM<1 in WM. This heatmap shows the top 40 genes from each list. The top half of the heatmap show genes deemed as WM specific, while the lower half shows genes expressed specifically in GM.
Enrichment map of pathway analysis
The gene lists of differentially expressed genes from GM and WM were fed into DAVID. DAVID sorts genes by gene ontology (GO) terms. The GO terms loosely define the functional relevance of the gene; a gene may belong to numerous ontologies. DAVID then collates the GO terms and determines which ontologies are enriched in the gene list. For GM, a total of 516 different GO terms were considered enriched (Table S4). The top 10 GO terms in GM sorted by p-value are listed in Table 4. For GM, the top 10 GO terms related predominately to synapses and various transport activities. For WM, 284 GO terms were identified as enriched (Table S4). The top 10 GO terms in WM sorted by p-value are listed in Table 4. Of note in this list are the 9th and 10th GO terms, which relate to the ensheathment of neurons and axons.
Table 4. Top 10 GO terms in GM and WM.
| GO term GM | |
|---|---|
| Term | p-value |
| 1. Synapse | 9.62E-45 |
| 2. Synapse part | 5.98E-40 |
| 3. Synaptic transmission | 1.10E-39 |
| 4. Transmission of nerve impulse | 1.63E-39 |
| 5. Plasma membrane part | 2.97E-33 |
| 6. Gated channel activity | 2.38E-30 |
| 7. Plasma membrane | 3.86E-29 |
| 8. Neuron projection | 8.53E-28 |
| 9. Ion channel complex | 1.08E-27 |
| 10. Ion channel activity | 4.01E-27 |
| GO terms WM | |
| Term | p-value |
| 1.Plasma membrane | 4.78E-06 |
| 2. Negative regulation of axonogenesis | 7.22E-06 |
| 3. Regulation of cell projection organization | 9.78E-06 |
| 4. Regulation of action potential in neuron | 9.83E-06 |
| 5. Regulation of cell morphogenesis | 1.08E-05 |
| 6. Negative regulation of cell projection organization | 1.46E-05 |
| 7. Regulation of axonogenesis | 1.48E-05 |
| 8. Ensheathment of neurons | 1.61E-05 |
| 9. Axon ensheathment | 1.61E-05 |
| 10. Sterol metabolic process | 3.00E-05 |
The list of GO terms from GM and WM were then fed into Cytoscape and used to modify the total gene list, creating an enrichment map (Figure 9). The enrichment map revealed several large and distinct clusters related to vesicles and membrane: ion-gated channels, transporters and receptors, neuron morphogenesis, ensheathment and myelination, neuron projection, synaptosomes, neuron morphogenesis, transmission of nerve impulse, and plasticity and axon/dendrite projection. From the enrichment map, it can be seen that there are more GO terms enriched in GM. Also, there are more GM connections between GO terms, which reinforce the observed trend of higher levels of transcriptional activity in GM than in WM. The major clusters of GO terms for GM related to vesicles and membranes are ion-gated channels, transporters and receptors. These groups are related to the transport of substances such as ions throughout cells. Clusters of GO terms related to neuron morphogenesis and neuron projection were enriched by genes from WM and GM. Neuron morphogenesis refers to changes in the underlying neuronal cytoskeleton and its interaction with the plasma membrane [29]. It can involve processes pertaining to axon initiation, growth, guidance and branching; dendritic growth, guidance, and branching; and synapse formation and stability. Similarly, neuron projection relates to any process involved in the initiation of neurite protrusion, and subsequent elongation often involving axons and dendrites [30]. Neuron morphogenesis and neuron projection are related to improving communication between neurons and hence will involve a complex interaction between GM and WM. Only one cluster was clearly dominated by WM and was related to ensheathment and myelination, a process performed by glia enriched in WM.
Figure 9. Gene Ontology terms enrichment map for GM and WM transcriptomes.

Each node represents a different GO term, the size of the node relates to the level of enrichment of each term. Red in the centre of the node represents up-regulation in GM, red on the edge of the node represents up-regulation in WM. The connections between each GO term are either green or blue. A green connection between node means that the both GO terms are in the GM lists, blue connections represent appearance of the GO terms in the WM lists. The more closely related GO terms are, the closer they appear on the enrichment map. A large number of closely related GO terms forms a cluster. Each cluster has been labelled with a general terms that captures all GO terms.
Discussion
This study is the first comparative transcriptome analysis of GM and WM from the human brain using RNA-Seq. It has shown that, overall, there are high levels of transcription in the human brain, with the identified transcripts covering approximately 37% of the genome. This number is close to the figure described by the ENCODE consortium [31]; the ENCODE study reported that, among 15 different human cell lines, the mean coverage of the human genome by primary transcripts was 39%. The ENCODE study included non-polyadenylated RNAs, while the current study utilized poly-T oligo-attached magnetic beads for the selection of the RNA fraction for analysis. If the RNA selection for this study also included non-polyadenylated RNAs, it would be expected that the coverage of the genome would be much higher than the 39% suggested by ENCODE. This would suggest that transcription is pervasive in the human brain. Furthermore, this study has also shown that a number of differentially expressed genes and transcripts exist across GM and WM from the same anatomical region of the human brain, namely, the superior frontal gyrus. These results highlight the complexity and variability of the transcriptome and the presence of numerous non-coding elements. Importantly, the transcriptome profiles for each region, and the GO enrichment map correlated well with what is known about the function and composition of WM and GM. This previous information has been predominately established through the use of other techniques, such as histopathology and in situ hybridization.
The human brain is an extremely complex organ. This complexity is not only derived from the sheer number and variety of cells present in the brain, but also through the heterogeneity of the brain, with cellular composition and density having the propensity to vary over short distances. The tissue samples used for the RNA-Seq analysis were taken from two different tissue types (GM and WM) from adjacent regions of the superior frontal gyrus. While the samples were taken from regions of close proximity, their transcriptome profiles were distinct, suggesting that each of the two tissue types have separate functions and further highlights the heterogeneity of the brain tissue across small distances. The heterogeneity of the brain becomes an issue when attempting to gauge differing gene expression levels between case and control samples. If the brain tissue is not selected and matched properly, differences highlighted in the transcriptome profiles may be differences resulting from variation in the composition and function of different brain regions rather than disease-related changes in the transcriptome. While the heterogeneity of brain tissue could make it difficult to study, the problem can be overcome through appropriate experimental design. The brain regions being compared must have the same cellular composition and be of the same functional capabilities. Laser capture of specific cell populations could be used to create homogenous samples for RNA-Seq analysis [32].
Several previous attempts were made to establish specific gene expression patterns as markers for GM and WM [33,34]. These studies, performed using microarrays, provided only partially overlapping results in terms of GM- and WM-specific genes. These discrepancies are due to the different cortical regions analyzed between studies; thus, the contribution of genes specifically expressed in neurons and oligodendrocytes variably contributed to the calculated GM/WM ratio [3]. Another difficulty stems from the microarray technique itself, which is limited in dynamic range to quantify gene expression [35]. In the present study, we provide a range of over 40 new gene marker candidates based on their unequivocal abundance in expression in GM and WM. Further, we propose that cumulative gene expression signatures, as now commonly used in cancer research [36], rather than individual genes should be used as markers for GM and WM. The utility of such marker signatures should however be further evaluated using larger cohort of samples.
Within the last few years, the RNA-Seq technique became widely used in transcriptome research, progressively replacing microarray techniques. Surprisingly, little has been done in the field of brain diseases using this sequencing approach. This can be partially caused by the lack of comprehensive reference data sets that might be used for comparative transcriptome analysis. Wu and colleagues recently reported comparative analysis of the transcriptome profiles derived from the superior temporal gyrus (STG) [37]. This study was however limited to the GM of STG and performed in the context of schizophrenia. Our study provides the first well-defined data sets that can be used to explore transcriptome aberrations affecting the frontal lobe and, in particular, frontal WM as in the case of multiple system atrophy and bipolar disorders [38,39]. By combining differential gene and isoform expression analysis with pathway analysis we were able to demonstrate that biological processes specific for WM and GM, such as myelination and ions transportation, respectively are reflected on the transcriptional level. Thus the transcriptome profiling may be effectively used to investigate cellular physiology, while a more global view of genomic expression may be used to study phenotypic features of complex structures such as human cortex.
This study identified high levels of various non-coding RNA classes, including snoRNAs, miRNAs, and lincRNAs; further, there were also high levels of locRNAs, novel genes, and novel isoforms produced from splicing events. It is possible that these last three classes could contribute further to the number of non-coding RNAs found in the human brain. Interestingly, while higher levels of transcriptional activity were found in GM, WM was identified as having higher levels of lincRNAs and a higher proportion of unannotated isoforms. Non coding RNAs (ncRNAs) were previously suggested to be widely expressed across the brain, where they often have cell specific regulatory functions [40]. These ncRNAs may play a role in regulating myelination patterns of axon in WM, a dynamic process that can be altered by experience and can carry on for decades in the human brain [41]. The functionality of the unannotated RNAs will need to be explored further in the future. It should also be underlined that possible influence of age on the transcriptional patterns presented here cannot be excluded and will require utilization of larger number of samples to enable regression analysis of covariates.
GPR123 is a member of the human G protein-coupled receptor (GPCR) family. GPCRs play important roles in a variety of sensory systems and help modulate blood pressure, food intake, immune responses, and development. It has been suggested that GPR123 is expressed specifically in the central nervous system (CNS); it also shows high levels of conservation across the vertebrate lineage [42]. These factors suggest that GPR123 expression may be a fundamental component of the vertebrate CNS.
The expression patterns of GPR123 between GM and WM reveal an interesting individual insight into the complexity of the transcriptome. At the gene level, GPR123 was up-regulated 5-fold in GM, suggesting that GPR123 is of greater functional relevance in GM; however, when analyzed at the isoform level, it was shown that the full length isoform GPR123-003 was not the major contributor to the GPR123 overexpression. Instead, the dominant isoform was the C-terminal truncated GPR123-004, which contributed to approximately 70% of total GPR123 expression in GM. The level of GPR123-004 FPKM expression in GM and the use of an alternate TSS suggest that it may be relevant to functional GM. In contrast, the dominant isoform in WM was the N-terminal truncated isoform GPR123-005, which contributed approximately 70% of the total GPR123 expression in WM. It is known that the domain structure of GPR123-004 and GPR123-005 would differ, which would lead to distinct functions for proteins encoded by each isoform. This fact points to the possibility that the GPR123 proteins may carry out distinct tissue-specific functions while being transcribed and translated from the same genomic locus.
While more research needs to be directed at elucidating the role of the differing GPR123 isoforms in the human brain, this gene does demonstrate the complexity of the transcriptome and also shows how the repertoire of transcripts is greatly increased by splicing events. It also illustrates that it is not just total gene expression levels that are important, but which isoforms are contributing to the expression levels. Unfortunately, current pathway analysis bioinformatic tools, such as DAVID, have not yet been set up to delineate between different splice variants.
Conclusions
This study identified a large number of differentially expressed genes between GM and WM that matched up well with previous studies and the known biology of the human cerebrum, underlining the accuracy and the advantages of using RNA-Seq for the analysis of complex transcriptomes. This set of results form a baseline expression database for healthy GM and WM and can be used as a resource to help detect abnormal gene expression between GM and WM tissues from sufferers of neurodegenerative diseases or psychiatric disorders. This is particularly relevant to WM which may play a major role in AD and multiple system atrophy [43,44].
Supporting Information
Full list of significant DEGs between GM and WM.
(XLSX)
Full list of significant DEIs between GM and WM.
(XLSX)
Novel gene markers for GM and WM.
(XLSX)
Gene Ontology terms enrichment analysis for DEGs between GM and WM.
(XLSX)
Gene body coverage for GM and WM RNA samples used in this study. A - C. GM samples D - F. WM samples. Each figure shows the number of reads that map to particular portions of the gene body. The x-axis starts at the 5’ end of the transcript and moves towards the 3’ end (left to right). The y-axis represents the average wigsum. The wigusm is a normalised ‘total read count’ where a wigsum of 100,000,000 is equal to the coverage achieved by 1 million 100 base reads or 2 million 50 base reads. All figures are skewed to the 3’ end of the transcripts, showing a 3’ bias, caused by poly-A selection of the RNA fraction.
(TIFF)
Expression levels of visinin-like 1 (VSNL1) isoforms. There were two VSNL1 splice variants expressed across GM and WM. VSNL1-001 was up regulated 34x in GM when compared to WM. The second splice variant VSLN1-007 was novel and was expressed at low levels across both GM and WM. Error bars are ± standard error.
(TIFF)
Expression levels of syniclein, beta (SNCB) isoforms. There were two SNCB splice variants expressed across GM and WM. SNCB-002 was the dominant isoform and was up regulated 29x in GM when compared to WM. The second splice variant SNCB-001 was expressed at low levels across both GM and WM. Error bars are ± standard error.
(TIFF)
Expression levels of reticulon 1 (RTN1) isoforms. There were four RTN1 splice variants expressed across GM and WM. RTN1-202 was the dominant isoform and was up regulated 10x in GM when compared to WM. The splice variant RTN1-201 was expressed at approximately 20 FPKM in both conditions. RTN1-203 and RTN1-204 were expressed at low levels in both conditions. All four identified splice variants were novel. Error bars are ± standard error.
(TIFF)
Expression levels of transferrin (TF) isoforms. There were two TF splice variants expressed across GM and WM. Both splice vairants contributed almost equal levels of expression to both GM and WM. TF-001 was upregulated 7x in WM when compared to GM. TF-202 was a novel splice varaints, it was expressed at higher levels in WM than in GM, however the changes in expression was not considered to be statistically significant. Error bars are ± standard error.
(TIFF)
Expression levels of myelin associated glycoprotein (MAG) isoforms. There were four MAG splice variants expressed across GM and WM. MAG-001 was the dominant isoform and was up regulated 8x in WM when compared to GM. The three other splice variants (MAG-002, MAG-003, MAG-009) were expressed at low levels in both GM and WM. MAG-009 was a novel splice variant. Error bars are ± standard error.
(TIFF)
Expression levels of MARCKS-like 1 (MARCKSL1) isoforms. There were two MARCKSL1 splice variants expressed across GM and WM. Both splice vairants contributed high levels of expression to both GM and WM. MARKSL1-001 was upregulated 7x in WM when compared to GM. MARCKSL1-002 was a novel splice varaints, it was also expressed at higher levels in WM than in GM, however the changes in expression was not considered to be statistically significant. Error bars are ± standard error.
(TIFF)
Allen Human Brain Atlas insitu hybridisation for the RGS4, CAMK2A, SLC17A7 and NEFM genes. A. RGS4: Regulator of G-protein signalling 4 GM FPKM: 100.75 WM FPKM: 1.52. Slide from the dorsolateral cortex of a healthy 20-year-old male. The slide shows high levels of expression in GM. B. CAMK2A: Calcium/calmodulin-dependent protein kinase II alpha GM FPKM: 233.16 WM FPKM: 5.27. Slide from the dorsolateral cortex of a healthy 20-year-old male. The slide shows high levels of expression in GM. C. SLC17A7: Solute carrier family 17 (sodium-dependent inorganic phosphate cotransporter), member 7 GM FPKM: 270.79 WM FPKM: 7.39. Slide from the dorsolateral cortex of a healthy 20-year-old male. The slide shows high levels of expression in GM. D. NEFM: Neurofilament, medium polypeptide GM FPKM: 224.01 WM FPKM: 4.09. Slide from the dorsolateral cortex of a healthy 20-year-old male. The slide shows high levels of expression in GM. Source: Allen Human Brain Atlas (Hawrylycz et al. 2012 and ©2012 Allen Institute for Brain Science. Allen Human Brain Atlas [Internet]. Available from: http://human.brain-map.org/).
(TIFF)
Acknowledgments
The authors would like to thank Dr. Caroline Janitz for her expert advice and critical comments during manuscript preparation, Adam J. Mills for his computing expertise and acknowledge the Garvan Institute providing Galaxy server (http://galaxy.garvan.unsw.edu.au).
Funding Statement
This work was supported by a National Health and Medical Research Council of Australia (NHMRC) project grant (#1022325). GMH is a NHMRC Senior Principal Research Fellow (#630434). Tissues were received from the Sydney Brain Bank at Neuroscience Research Australia and the New South Wales Tissue Resource Centre at the University of Sydney which are supported by the National Health and Medical Research Council of Australia (NHMRC), University of New South Wales, Neuroscience Research Australia, Schizophrenia Research Institute and National Institute of Alcohol Abuse and Alcoholism (NIH (NIAAA) R24AA012725). The funders had no role in study design, data collection and analysis, decision to publish, or preparation of the manuscript.
References
- 1. Kimberg DY, Farah MJ (1993) A unified account of cognitive impairments following frontal lobe damage: the role of working memory in complex, organized behavior. J Exp Psychol Gen 122: 411-428. doi: 10.1037/0096-3445.122.4.411. PubMed: 8263463. [DOI] [PubMed] [Google Scholar]
- 2. Miller EK, Freedman DJ, Wallis JD (2002) The prefrontal cortex: categories, concepts and cognition. Philos Trans R Soc Lond B Biol Sci 357: 1123-1136. doi: 10.1098/rstb.2002.1099. PubMed: 12217179. [DOI] [PMC free article] [PubMed] [Google Scholar]
- 3. Ziles K, Amunts K (2011) Architecture of cerebral cortex. In: Mai KM, Paxinos G. The Human Nervous System. 3rd ed. Academic Press; pp. 836-895. [Google Scholar]
- 4. Lui JH, Hansen DV, Kriegstein AR (2011) Development and evolution of the human neocortex. Cell 146: 18-36. doi: 10.1016/j.cell.2011.06.030. PubMed: 21729779. [DOI] [PMC free article] [PubMed] [Google Scholar]
- 5. Nagy Z, Westerberg H, Klingberg T (2004) Maturation of white matter is associated with the development of cognitive functions during childhood. J Cogn Neurosci 16: 1227-1233. doi: 10.1162/0898929041920441. PubMed: 15453975. [DOI] [PubMed] [Google Scholar]
- 6. Schoenemann PT, Sheehan MJ, Glotzer LD (2005) Prefrontal white matter volume is disproportionately larger in humans than in other primates. Nat Neurosci 8: 242-252. doi: 10.1038/nn1394. PubMed: 15665874. [DOI] [PubMed] [Google Scholar]
- 7. Smaers JB, Schleicher A, Zilles K, Vinicius L (2010) Frontal white matter volume is associated with brain enlargement and higher structural connectivity in anthropoid primates. PLOS ONE 5: e9123. doi: 10.1371/journal.pone.0009123. PubMed: 20161758. [DOI] [PMC free article] [PubMed] [Google Scholar]
- 8. Mills JD, Nalpathamkalam T, Jacobs HI, Janitz C, Merico D et al. (2013) RNA-Seq analysis of the parietal cortex in Alzheimer's disease reveals alternatively spliced isoforms related to lipid metabolism. Neurosci Lett 536: 90-95. doi: 10.1016/j.neulet.2012.12.042. PubMed: 23305720. [DOI] [PubMed] [Google Scholar]
- 9. Twine NA, Janitz K, Wilkins MR, Janitz M (2011) Whole transcriptome sequencing reveals gene expression and splicing differences in brain regions affected by Alzheimer's disease. PLOS ONE 6: e16266. doi: 10.1371/journal.pone.0016266. PubMed: 21283692. [DOI] [PMC free article] [PubMed] [Google Scholar]
- 10. Voineagu I, Wang X, Johnston P, Lowe JK, Tian Y et al. (2011) Transcriptomic analysis of autistic brain reveals convergent molecular pathology. Nature 474: 380-384. doi: 10.1038/nature10110. PubMed: 21614001. [DOI] [PMC free article] [PubMed] [Google Scholar]
- 11. Hawrylycz MJ, Lein ES, Guillozet-Bongaarts AL, Shen EH, Ng L et al. (2012) An anatomically comprehensive atlas of the adult human brain transcriptome. Nature 489: 391-399. doi: 10.1038/nature11405. PubMed: 22996553. [DOI] [PMC free article] [PubMed] [Google Scholar]
- 12. Ho——Pun-Cheung A, Bascoul-Mollevi C, Assenat E, Boissière-Michot F, Bibeau F et al. (2009) Reverse transcription-quantitative polymerase chain reaction: description of a RIN-based algorithm for accurate data normalization. BMC Mol Biol 10: 31. doi: 10.1186/1471-2199-10-31. PubMed: 19368728. 10.1186/1471-2199-10-31 PubMed: 19368728 [DOI] [PMC free article] [PubMed] [Google Scholar]
- 13. Blankenberg D, Von Kuster G, Coraor N, Ananda G, Lazarus R et al. (2010) Galaxy: a web-based genome analysis tool for experimentalists. Curr Protoc Mol Biol Chapter 19: Unit 19.10.1: Unit 19 10 11-21 PubMed: 20069535. [DOI] [PMC free article] [PubMed] [Google Scholar]
- 14. Giardine B, Riemer C, Hardison RC, Burhans R, Elnitski L et al. (2005) Galaxy: a platform for interactive large-scale genome analysis. Genome Res 15: 1451-1455. doi: 10.1101/gr.4086505. PubMed: 16169926. [DOI] [PMC free article] [PubMed] [Google Scholar]
- 15. Goecks J, Nekrutenko A, Taylor J (2010) Galaxy: a comprehensive approach for supporting accessible, reproducible, and transparent computational research in the life sciences. Genome Biol 11: R86. doi: 10.1186/gb-2010-11-8-r86. PubMed: 20738864. [DOI] [PMC free article] [PubMed] [Google Scholar]
- 16. Trapnell C, Pachter L, Salzberg SL (2009) TopHat: discovering splice junctions with RNA-Seq. Bioinformatics 25: 1105-1111. doi: 10.1093/bioinformatics/btp120. PubMed: 19289445. [DOI] [PMC free article] [PubMed] [Google Scholar]
- 17. Wang L, Wang S, Li W (2012) RSeQC: quality control of RNA-seq experiments. Bioinformatics 28: 2184-2185. doi: 10.1093/bioinformatics/bts356. PubMed: 22743226. [DOI] [PubMed] [Google Scholar]
- 18. Trapnell C, Williams BA, Pertea G, Mortazavi A, Kwan G et al. (2010) Transcript assembly and quantification by RNA-Seq reveals unannotated transcripts and isoform switching during cell differentiation. Nat Biotechnol 28: 511-515. doi: 10.1038/nbt.1621. PubMed: 20436464. [DOI] [PMC free article] [PubMed] [Google Scholar]
- 19. Trapnell C, Roberts A, Goff L, Pertea G, Kim D et al. (2012) Differential gene and transcript expression analysis of RNA-seq experiments with TopHat and Cufflinks. Nat Protoc 7: 562-578. doi: 10.1038/nnano.2012.118. PubMed: 22383036. [DOI] [PMC free article] [PubMed] [Google Scholar]
- 20. Robinson JT, Thorvaldsdóttir H, Winckler W, Guttman M, Lander ES et al. (2011) Integrative genomics viewer. Nat Biotechnol 29: 24-26. doi: 10.1038/nbt.1754. PubMed: 21221095. [DOI] [PMC free article] [PubMed] [Google Scholar]
- 21. Thorvaldsdóttir H, Robinson JT, Mesirov JP (2012) Integrative Genomics Viewer (IGV): high-performance genomics data visualization and exploration. Brief Bioinform, 14: 178–92. PubMed: 22517427. [DOI] [PMC free article] [PubMed] [Google Scholar]
- 22. Huang DW, Sherman BT, Lempicki RA (2009) Systematic and integrative analysis of large gene lists using DAVID bioinformatics resources. Nat Protoc 4: 44-57. PubMed: 19131956. [DOI] [PubMed] [Google Scholar]
- 23. Cline MS, Smoot M, Cerami E, Kuchinsky A, Landys N et al. (2007) Integration of biological networks and gene expression data using Cytoscape. Nat Protoc 2: 2366-2382. doi: 10.1038/nprot.2007.324. PubMed: 17947979. [DOI] [PMC free article] [PubMed] [Google Scholar]
- 24. Roberts A, Trapnell C, Donaghey J, Rinn JL, Pachter L (2011) Improving RNA-Seq expression estimates by correcting for fragment bias. Genome Biol 12: R22. doi: 10.1186/gb-2011-12-s1-p22. PubMed: 21410973. [DOI] [PMC free article] [PubMed] [Google Scholar]
- 25. Cahoy JD, Emery B, Kaushal A, Foo LC, Zamanian JL et al. (2008) A transcriptome database for astrocytes, neurons, and oligodendrocytes: a new resource for understanding brain development and function. J Neurosci 28: 264-278. doi: 10.1523/JNEUROSCI.4178-07.2008. PubMed: 18171944. [DOI] [PMC free article] [PubMed] [Google Scholar]
- 26. Kim MS, Chang X, LeBron C, Nagpal JK, Lee J et al. (2010) Neurofilament heavy polypeptide regulates the Akt-beta-catenin pathway in human esophageal squamous cell carcinoma. PLOS ONE 5: e9003. doi: 10.1371/journal.pone.0009003. PubMed: 20140245. [DOI] [PMC free article] [PubMed] [Google Scholar]
- 27. Lee MK, Cleveland DW (1996) Neuronal intermediate filaments. Annu Rev Neurosci 19: 187-217. doi: 10.1146/annurev.ne.19.030196.001155. PubMed: 8833441. [DOI] [PubMed] [Google Scholar]
- 28. Johns TG, Bernard CC (1999) The structure and function of myelin oligodendrocyte glycoprotein. J Neurochem 72: 1-9. doi: 10.1111/j.1471-4159.1999.tb11579.x. PubMed: 9886048. [DOI] [PubMed] [Google Scholar]
- 29. Luo L (2002) Actin cytoskeleton regulation in neuronal morphogenesis and structural plasticity. Annu Rev Cell Dev Biol 18: 601-635. doi: 10.1146/annurev.cellbio.18.031802.150501. PubMed: 12142283. [DOI] [PubMed] [Google Scholar]
- 30. Khodosevich K, Monyer H (2010) Signaling involved in neurite outgrowth of postnatally born subventricular zone neurons in vitro. BMC Neurosci 11: 18. doi: 10.1186/1471-2202-11-18. PubMed: 20146799. [DOI] [PMC free article] [PubMed] [Google Scholar]
- 31. Djebali S, Davis CA, Merkel A, Dobin A, Lassmann T et al. (2012) Landscape of transcription in human cells. Nature 489: 101-108. doi: 10.1038/nature11233. PubMed: 22955620. [DOI] [PMC free article] [PubMed] [Google Scholar]
- 32. Emmert-Buck MR, Bonner RF, Smith PD, Chuaqui RF, Zhuang Z et al. (1996) Laser capture microdissection. Science 274: 998-1001. doi: 10.1126/science.274.5289.998. PubMed: 8875945. [DOI] [PubMed] [Google Scholar]
- 33. Rosell A, Vilalta A, García-Berrocoso T, Fernández-Cadenas I, Domingues-Montanari S et al. (2011) Brain perihematoma genomic profile following spontaneous human intracerebral hemorrhage. PLOS ONE 6: e16750. doi: 10.1371/journal.pone.0016750. PubMed: 21311749. [DOI] [PMC free article] [PubMed] [Google Scholar]
- 34. Sibille E, Arango V, Joeyen-Waldorf J, Wang Y, Leman S et al. (2008) Large-scale estimates of cellular origins of mRNAs: enhancing the yield of transcriptome analyses. J Neurosci Methods 167: 198-206. doi: 10.1016/j.jneumeth.2007.08.009. PubMed: 17889939. [DOI] [PMC free article] [PubMed] [Google Scholar]
- 35. Courtney E, Kornfeld S, Janitz K, Janitz M (2010) Transcriptome profiling in neurodegenerative disease. J Neurosci Methods 193: 189-202. doi: 10.1016/j.jneumeth.2010.08.018. PubMed: 20800617. [DOI] [PubMed] [Google Scholar]
- 36. Costa V, Aprile M, Esposito R, Ciccodicola A (2013) RNA-Seq and human complex diseases: recent accomplishments and future perspectives. Eur J Hum Genet 21: 134-142. doi: 10.1038/ejhg.2012.129. PubMed: 22739340. [DOI] [PMC free article] [PubMed] [Google Scholar]
- 37. Wu JQ, Wang X, Beveridge NJ, Tooney PA, Scott RJ et al. (2012) Transcriptome sequencing revealed significant alteration of cortical promoter usage and splicing in schizophrenia. PLOS ONE 7: e36351. doi: 10.1371/journal.pone.0036351. PubMed: 22558445. [DOI] [PMC free article] [PubMed] [Google Scholar]
- 38. Borgwardt S, Fusar-Poli P (2012) White matter pathology--an endophenotype for bipolar disorder? BMC Psychiatry 12: 138. doi: 10.1186/1471-244X-12-138. PubMed: 22970986. [DOI] [PMC free article] [PubMed] [Google Scholar]
- 39. Halliday GM, Holton JL, Revesz T, Dickson DW (2011) Neuropathology underlying clinical variability in patients with synucleinopathies. Acta Neuropathol 122: 187-204. doi: 10.1007/s00401-011-0852-9. PubMed: 21720849. [DOI] [PubMed] [Google Scholar]
- 40. Mercer TR, Qureshi IA, Gokhan S, Dinger ME, Li G et al. (2010) Long noncoding RNAs in neuronal-glial fate specification and oligodendrocyte lineage maturation. BMC Neurosci 11: 14. doi: 10.1186/1471-2202-11-S1-P14. PubMed: 20137068. [DOI] [PMC free article] [PubMed] [Google Scholar]
- 41. Fields RD (2008) White matter in learning, cognition and psychiatric disorders. Trends Neurosci 31: 361-370. doi: 10.1016/j.tins.2008.04.001. PubMed: 18538868. [DOI] [PMC free article] [PubMed] [Google Scholar]
- 42. Lagerström MC, Rabe N, Haitina T, Kalnina I, Hellström AR et al. (2007) The evolutionary history and tissue mapping of GPR123: specific CNS expression pattern predominantly in thalamic nuclei and regions containing large pyramidal cells. J Neurochem 100: 1129-1142. doi: 10.1111/j.1471-4159.2006.04281.x. PubMed: 17212699. [DOI] [PubMed] [Google Scholar]
- 43. Sachdev PS, Zhuang L, Braidy N, Wen W (2013) Is Alzheimer's a disease of the white matter? Curr Opin Psychiatry 26: 244-251. doi: 10.1097/YCO.0b013e32835ed6e8. PubMed: 23493128. [DOI] [PubMed] [Google Scholar]
- 44. Wakabayashi K, Ikeuchi T, Ishikawa A, Takahashi H (1998) Multiple system atrophy with severe involvement of the motor cortical areas and cerebral white matter. J Neurol Sci 156: 114-117. doi: 10.1016/S0022-510X(98)00018-5. PubMed: 9559999. [DOI] [PubMed] [Google Scholar]
Associated Data
This section collects any data citations, data availability statements, or supplementary materials included in this article.
Supplementary Materials
Full list of significant DEGs between GM and WM.
(XLSX)
Full list of significant DEIs between GM and WM.
(XLSX)
Novel gene markers for GM and WM.
(XLSX)
Gene Ontology terms enrichment analysis for DEGs between GM and WM.
(XLSX)
Gene body coverage for GM and WM RNA samples used in this study. A - C. GM samples D - F. WM samples. Each figure shows the number of reads that map to particular portions of the gene body. The x-axis starts at the 5’ end of the transcript and moves towards the 3’ end (left to right). The y-axis represents the average wigsum. The wigusm is a normalised ‘total read count’ where a wigsum of 100,000,000 is equal to the coverage achieved by 1 million 100 base reads or 2 million 50 base reads. All figures are skewed to the 3’ end of the transcripts, showing a 3’ bias, caused by poly-A selection of the RNA fraction.
(TIFF)
Expression levels of visinin-like 1 (VSNL1) isoforms. There were two VSNL1 splice variants expressed across GM and WM. VSNL1-001 was up regulated 34x in GM when compared to WM. The second splice variant VSLN1-007 was novel and was expressed at low levels across both GM and WM. Error bars are ± standard error.
(TIFF)
Expression levels of syniclein, beta (SNCB) isoforms. There were two SNCB splice variants expressed across GM and WM. SNCB-002 was the dominant isoform and was up regulated 29x in GM when compared to WM. The second splice variant SNCB-001 was expressed at low levels across both GM and WM. Error bars are ± standard error.
(TIFF)
Expression levels of reticulon 1 (RTN1) isoforms. There were four RTN1 splice variants expressed across GM and WM. RTN1-202 was the dominant isoform and was up regulated 10x in GM when compared to WM. The splice variant RTN1-201 was expressed at approximately 20 FPKM in both conditions. RTN1-203 and RTN1-204 were expressed at low levels in both conditions. All four identified splice variants were novel. Error bars are ± standard error.
(TIFF)
Expression levels of transferrin (TF) isoforms. There were two TF splice variants expressed across GM and WM. Both splice vairants contributed almost equal levels of expression to both GM and WM. TF-001 was upregulated 7x in WM when compared to GM. TF-202 was a novel splice varaints, it was expressed at higher levels in WM than in GM, however the changes in expression was not considered to be statistically significant. Error bars are ± standard error.
(TIFF)
Expression levels of myelin associated glycoprotein (MAG) isoforms. There were four MAG splice variants expressed across GM and WM. MAG-001 was the dominant isoform and was up regulated 8x in WM when compared to GM. The three other splice variants (MAG-002, MAG-003, MAG-009) were expressed at low levels in both GM and WM. MAG-009 was a novel splice variant. Error bars are ± standard error.
(TIFF)
Expression levels of MARCKS-like 1 (MARCKSL1) isoforms. There were two MARCKSL1 splice variants expressed across GM and WM. Both splice vairants contributed high levels of expression to both GM and WM. MARKSL1-001 was upregulated 7x in WM when compared to GM. MARCKSL1-002 was a novel splice varaints, it was also expressed at higher levels in WM than in GM, however the changes in expression was not considered to be statistically significant. Error bars are ± standard error.
(TIFF)
Allen Human Brain Atlas insitu hybridisation for the RGS4, CAMK2A, SLC17A7 and NEFM genes. A. RGS4: Regulator of G-protein signalling 4 GM FPKM: 100.75 WM FPKM: 1.52. Slide from the dorsolateral cortex of a healthy 20-year-old male. The slide shows high levels of expression in GM. B. CAMK2A: Calcium/calmodulin-dependent protein kinase II alpha GM FPKM: 233.16 WM FPKM: 5.27. Slide from the dorsolateral cortex of a healthy 20-year-old male. The slide shows high levels of expression in GM. C. SLC17A7: Solute carrier family 17 (sodium-dependent inorganic phosphate cotransporter), member 7 GM FPKM: 270.79 WM FPKM: 7.39. Slide from the dorsolateral cortex of a healthy 20-year-old male. The slide shows high levels of expression in GM. D. NEFM: Neurofilament, medium polypeptide GM FPKM: 224.01 WM FPKM: 4.09. Slide from the dorsolateral cortex of a healthy 20-year-old male. The slide shows high levels of expression in GM. Source: Allen Human Brain Atlas (Hawrylycz et al. 2012 and ©2012 Allen Institute for Brain Science. Allen Human Brain Atlas [Internet]. Available from: http://human.brain-map.org/).
(TIFF)