

Significance
Wind-blown dust is seldom considered an important source for nutrients in large peatlands, such as the Everglades. However, a sedimentary record suggests that high loadings of dust-borne nutrients once prevailed in the central Everglades during a period of moister climate with intense tropical storms that ended 2,800 y ago. Afterwards, a drier climatic regime with a steep decline in dustfall may have been the impetus for the striking surface patterning of the Everglades. This study provides additional support for the importance of aeolian dust in ecosystem development.
Keywords: Sahara dust, Holocene climate change, P-limitation, long-distance transport, ridge-slough-tree island patterning
Abstract
Aeolian dust is rarely considered an important source for nutrients in large peatlands, which generally develop in moist regions far from the major centers of dust production. As a result, past studies assumed that the Everglades provides a classic example of an originally oligotrophic, P-limited wetland that was subsequently degraded by anthropogenic activities. However, a multiproxy sedimentary record indicates that changes in atmospheric circulation patterns produced an abrupt shift in the hydrology and dust deposition in the Everglades over the past 4,600 y. A wet climatic period with high loadings of aeolian dust prevailed before 2800 cal BP (calibrated years before present) when vegetation typical of a deep slough dominated the principal drainage outlet of the Everglades. This dust was apparently transported from distant source areas, such as the Sahara Desert, by tropical storms according to its elemental chemistry and mineralogy. A drier climatic regime with a steep decline in dustfall persisted after 2800 cal BP maintaining sawgrass vegetation at the coring site as tree islands developed nearby (and pine forests covered adjacent uplands). The marked decline in dustfall was related to corresponding declines in sedimentary phosphorus, organic nitrogen, and organic carbon, suggesting that a close relationship existed between dustfall, primary production, and possibly, vegetation patterning before the 20th century. The climatic change after 2800 cal BP was probably produced by a shift in the Bermuda High to the southeast, shunting tropical storms to the south of Florida into the Gulf of Mexico.
The Everglades in south Florida remains one of the largest and most distinctive wetlands in North America. Before the 20th century, the Everglades covered more than 1 million ha and served as a conduit for runoff draining from Lake Okeechobee to the sea (1–4). This original drainage pattern is still marked by the striking alignment of the slough, ridge, and tree island networks, providing visible evidence for a tight linkage between ecosystem processes and hydrology (2–9). During the past 100 y, however, the wetlands south of Lake Okeechobee were converted to agricultural fields, and the northern and central Everglades were compartmentalized into Water Conservation Areas that regulate flow southward to Everglades National Park (Fig. 1) (1–4). These massive projects altered the flow regime and nutrient fluxes within the Everglades so pervasively that current conditions may no longer be indicative of the principal drivers that once controlled the development of this ecosystem.
Fig. 1.

Landsat image of the Everglades and surrounding region. The features marked are (1) Lake Okeechobee, (2) the Everglades Agricultural Areas, (3–6) Water Conservation Areas 1, 2, 3A, and 3B, respectively, and (7) Shark River Slough. Other marked areas are (I) Lake Wales Ridge, (II) Big Cypress Swamp, and (III) Miami Rockland Ridge. The coring site is marked by the arrow. Adapted with permission from American Geophysical Union (12).
Stratigraphic studies provide an alternative means to reconstruct the past dynamics of the Everglades with respect to climate, sea level, and geology (9–12). The 160-km-long bedrock trough that underlies the Everglades now has a regional slope of only 3 cm km−1, making the system especially sensitive to small changes in precipitation or sea level (10–13). A moist climate coupled with slowly rising sea levels have, therefore, been identified as the principal drivers for the long-term development of the Everglades (12). However, climatic shifts also can have a substantial influence on the aeolian transport of dust, which was probably the primary source of P in the predrainage Everglades (4). At present, it is not known whether nutrient inputs played a prominent role in the development of this vast wetland or whether dustfall patterns were related to the frequency of moisture sources, such as tropical storms and El Niño.
We, therefore, conducted a multiproxy analysis of a sediment core from the Northeast Shark River Slough (NESRS) after finding initial evidence for paleodust indicators in cores from the central Everglades (Fig. 1 and SI Materials and Methods). The NESRS should also contain a highly sensitive record of hydrological change across the broader Everglades because of its location near the head of a southwest-trending bedrock trough that served as the principal drainage outlet for this wetland before the drainage era (12). In contrast, most stratigraphic investigations in the Everglades are concentrated in the northern and central Everglades, and only limited work has been conducted in the Shark River Slough (2, 3, 7).
Results
Core Lithology.
The NESRS core has four lithologic units (12) representing major shifts in mineralogy, organic content, and elemental composition (Figs. 2 and 3 and Datasets S1 and S2). These units are readily distinguished by their relative proportions of carbonates, organic matter, and ash. The two uppermost units are dominated by carbonates that account for 90% of the dry mass in Unit I (6–50 cm) and 80% of the dry mass in Unit II (50–68 cm), with the remainder mostly consisting of organic matter. The lithology shifts from carbonates to organic matter in Unit III (68–96 cm), which is dominated by fine-grained organic matter (60–80%), with a significant fraction of ash (10–20%) and a minor component of carbonates (5–7%). The organic content then falls to 10–26% in Unit IV (96–99 cm), which has larger fractions of carbonates (16–48%) and ash (48–58%).
Fig. 2.

Lithology, carbon stratigraphy, and age model for the NESRS core. All values are presented as a fraction of dry mass. Adapted with permission from American Geophysical Union (12).
Fig. 3.

Inorganic (X-ray diffraction and X-ray fluorescence) stratigraphy of the NESRS core. Mineral concentrations are in mass percentage of total crystalline fraction, whereas elemental concentrations are in mass percentage of total sample less C and N compounds and scaled by convention according to their respective normative oxides. The wet climatic period before 2800 cal BP is marked in blue.
The mineral stratigraphy is largely distinguished by changes in dominance between calcite and quartz (Fig. 3). The mineral fraction of Units I and II consists almost entirely of pure calcite, with only 1–2% quartz and less than 0.1% P oxides as a percentage of the total crystalline fraction. These calcareous silt layers contain both low Mg (interpreted as endogenic) and high Mg (interpreted as allogenic) calcite. The evaporite mineral gypsum first appears at the transition between Units II and III and extends down to a depth of 83 cm. In contrast, quartz is the dominant mineral in Unit III, where it is associated with significant amounts of gypsum along with crustal elements, such as titanium, aluminum, and iron, and greater than 0.3% P oxides. In the lower portion of Unit III, quartz ranges from 60% to 70% of the mineral fraction, with almost pure quartz lenses at depths of 75 and 93 cm. The quartz ranges from silt-sized particles to coarse, angular quartz grains that are up to 200 µm in size and faceted like desert ventifacts (14), with a patina of reprecipitated silica or amorphous oxides (Fig. 4). P oxides range up to 3.5% of the inorganic fraction at 93-cm depth, with large particles of apatite at the bottom of the quartz layer. In contrast, low and high magnesium calcite is the dominant mineral fraction in Unit IV (95–99 cm), with a minor component of quartz.
Fig. 4.

Scanning electron micrograph of a large-faceted quartz grain from 76-cm depth.
The elemental profiles for inorganic and organic carbon closely track the relative abundances of carbonates and organic matter in the NESRS core (Fig. 2). However, these relationships lack a 1:1 correspondence, because the molar fractions of carbon in calcite (12%) and cellulose (44%) are different. Total organic carbon is closely related to %P and especially, total organic nitrogen, which varies linearly (r2 = 0.99) with total organic carbon throughout the core.
Pollen Zonation.
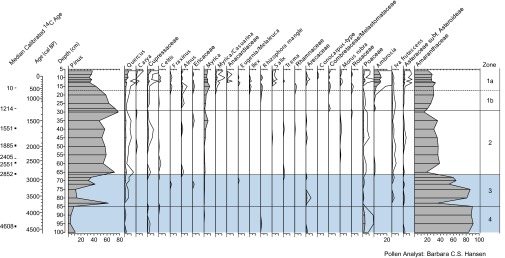
The pollen stratigraphy has four distinct zones characterized by changes in the relative abundance of both local (e.g., Cladium vs. Nymphaea) and regional (e.g., Pinus vs. Amaranthaceae) pollen types (Figs. 5 and 6). The most important pollen boundary at 67–68 cm (from a Pinus–Cladium assemblage in pollen zone 2 to an Amaranthaceae–Nymphaea assemblage in zone 3) coincides with a major change in lithology from carbonates to organic matter (between Units II and III). In contrast, the other pollen zones are slightly offset from the stratigraphic divisions. A detailed description of the pollen zonation is presented in SI Results.
Fig. 5.
Regional pollen stratigraphy of the NESRS core. The blue zone marks the wet period between 4600 and 2800 cal BP
Fig. 6.

Local pollen stratigraphy of the NESRS core. The blue zone marks the wet period between 4600 and 2800 cal BP
Age Model.
Sediments in the Everglades are subject to dating errors from both the hard water effect and the downward transport of modern carbon by plant roots (12). An age model for this 99-cm–long core was, therefore, based on eight accelerator mass spectrometry-14C dates of gastropod shells that were calibrated using CALIB (15) after the magnitude of the hard water effect was first quantified and corrected (12). This age model (Fig. 2) was constructed using TGView (16), because the dates fit a nearly linear age vs. depth relationship. Sediment began accumulating at this site around 4600 cal BP (calibrated years before present) and continued at a slow (0.2 mm y−1) but nearly linear (r2 = 0.98) rate, despite the marked changes in the lithology and stratigraphy (12).
Discussion
Large peatlands (>1,000 km2) generally develop into oligotrophic, P-limited ecosystems as their thickening peat profile separates the surface waters and vegetation from the mineral substratum. Several factors would have intensified this developmental pathway in the Everglades before the drainage era. First, the surface waters were progressively diluted by precipitation along flow lines that exceeded 100 km before 1900. Second, the exceptionally low regional gradient would further amplify the diluting effects of precipitation by increasing the residence times of surface waters. Third, south Florida rests on a limestone platform with only a thin veneer of calcareous soils that are largely depleted in phosphorus and nitrogen. As a result, the ecosystems of south Florida were largely dependent on atmospheric sources for essential mineral nutrients before the 20th century (3, 4). Phosphorus is generally considered the key limiting nutrient in freshwater wetlands, because most available phosphate is rapidly incorporated and conserved within biomass, whereas the remainder is largely sequestered in insoluble complexes or precipitates (4).
Holocene Vegetation and Hydrology.
The pollen stratigraphy indicates that the Holocene vegetation succession in the NESRS was closely linked to climate-driven shifts in hydrology and dust deposition (Figs. 3, 4, 5, and 6). Initially, a wet prairie (pollen zone 4) became established on the pitted bedrock surface of the coring site at 4600 cal BP This assemblage was dominated by grasses and sedges typical of a marl prairie, with pockets of deeper water in bedrock pits supporting aquatic and emergent vascular plants (e.g., Nymphaea, Utricularia, Sparganium, and Sagittaria). At this time, marl was biogenically precipitated and mixed with organic detritus to form a thin veneer of sediment over the bedrock. This initial phase of wetland development was apparently associated with a period of slowly rising sea level based on the influx of mangrove (Rhizophora) pollen blowing in from the nearby coasts. The low values for pine and much higher values for Amaranthaceae indicate a regionally high water table with extensive wet or brackish meadows adjacent to the modern Everglades.
This marl prairie assemblage was soon replaced by a slough-like assemblage (pollen zone 3) marked by deeper water levels and longer hydroperiods indicated by the dominance of Nymphaea and the presence of other aquatics, such as Utricularia, Sparganium, and Sagittaria. The greater water depths and higher nutrient loadings from dustfall (Figs. 3, 4, 5, and 6) supported a rapid rise in primary production and the accumulation of organic carbon in the sediment (Fig. 2). Sawgrass (Cladium) and other sedges were present but not dominant during this wet phase, which was probably representative of the broader Everglades, because the Shark River Slough functioned as the principal natural drain for the extensive wetlands upslope.
During this early period (pollen zones 3 and 4), the regional water table was apparently too high to support pine forests or oak savannas on adjacent uplands, because both oak and pine pollen are poorly represented, except for a distinct pine peak at 82 cm. Mesic hammock taxa (e.g., Celtis, Taxodium, and Myrica), which typically occupy higher points on the uplands, were present but not abundant (Fig. 5). In contrast, the regional pollen rain was dominated by pollen of chenopods and Amaranthus. Today, the native species from this group have a largely coastal distribution in Florida, although the very robust A. australis, which is largely found in salt or brackish marshes, also extends inland on disturbed freshwater sites along drainage ditches, canals, and drained sloughs (17–20). Dust deposition was apparently high throughout this period, despite the wet climate, because of long-distance transport from distant source areas (Fig. 3).
After 2800 cal BP the slough assemblage was replaced by a Cladium (sawgrass) ridge assemblage, which represented a shift to lower water levels and shorter hydroperiods. This reconstruction is supported by the transition in the local sediment lithology from the organic detritus of pollen zone 3 to the carbonates of zone 2. Lower water levels are consistent with the appearance of the evaporite mineral gypsum at the transition from zone 3 to zone 2 (Fig. 3) and preference for marl deposition in warm shallow water (2). Regionally, Pinus became the most abundant pollen type, because drier conditions favored the expansion of pine forests on the Miami Rockland Ridge to the east and other nearby mineral uplands. Pollen zone 2 is also marked by the rise nearby of Taxodium and hammock species (Myrica, Morus rubra, Trema, and Celtis) and also ferns (Dryopteris), which are characteristic of the modern tree islands of the Everglades. These changes seem to be the result of a regional change in climate rather than sea level or geomorphic factors alone, because there was a dramatic decline in the quartz assemblage, indicative of dustfall after 2800 cal BP (Fig. 3).
Pollen zone 1 is marked by a gradual decline in pine beginning about 1200 cal BP and relatively stable values for Amaranthaceae. In contrast, the economic expansion after World War II (pollen zone 1a) was marked by much lower values for pine as the Miami Rockland forests were cut (13) and the rise in disturbance or invasive indicators, such as Salix, Ambrosia, Casuarina, Rhus, and Melaleuca. Although Willard et al. (7) argue that Casuarina was introduced to south Florida in the late 19th century, the pollen assemblage in pollen zone 1a seems to fit most closely the post-World War II changes described by Craighead (13) and was independently dated by Schottler and Engstrom (21). The local rise in Utricularia and Sparganium during this period indicates that the water table was too low to favor the growth of water lilies.
Climatic Determinants of Ecosystem Development.
The onset of peat accumulation in the Everglades basin coincided with a regional shift to a moister climate after 5600 cal BP that was detected by several paleoclimatic records. On the Lake Wales Ridge just north of Lake Okeechobee, a shift to a moister climate after 5,000 y BP was marked by rising water levels, regional expansion of pine forests, and contraction of oak savanna (22, 23). Additional evidence indicates that this wet period persisted at other sites in Mexico and Haiti until about 2700 cal BP (24–26). This prolonged period of higher rainfall may have been caused by increased activity of El Niño or a greater frequency of tropical storms (27–29).
A major shift to a drier climate after 2800 cal BP was apparently responsible for the change from pollen zone 3 to pollen zone 2. This chronology closely matches other paleoclimatic records from Haiti (24, 26), the Yucatan Peninsula of Mexico (25), and the Gulf Coast of northwestern Florida (30). The timing of this shift also roughly coincides with the marked decline in the peat accretion rate reported in the Big Cypress Swamp of southwest Florida (31). Lower water depths would have favored the abrupt change from the slough-like assemblage in pollen zone 3 to one typical of a drier sawgrass ridge in zones 2 and 1. A decline in water depth could also explain the shift from organic-rich sediment in Lithologic Unit III to carbonate in Unit II, because marl deposition is favored by shallow water in the modern Everglades (2).
Aeolian Dust and Nutrient Influx.
The profiles of P, N, quartz, and crustal elements are strikingly coherent within the NESRS core, suggesting that the influx of nutrients was closely linked to dustfall. Phosphorus levels were highest during the wet phase before 2800 cal BP (Units III and IV), when quartz, Al, Fe, and Ti were also deposited. In contrast, P levels declined dramatically after 2800 cal BP when the deposition of quartz and crustal elements either fell or ceased and shallower waters prevailed at the coring site. The higher influx of P during pollen zone 3 (Figs. 3 and 4) could have stimulated local N fixation (32) and helped favor producers other than oligotrophic species, such as Cladium and periphyton. In contrast, the lower influx of phosphorus and nitrogen after 2800 cal BP (zones 2 and 1) would have favored Cladium and periphyton, which are now hallmarks of the central Everglades. The decline in dustfall could also have created a template for spatial patterning across the central Everglades by allowing localized hot spots for P deposition from guano to drive the development of tree islands, which was suggested by Givnish et al. (8) and others (6, 7).
The recent postdrainage era, however, is marked by only a slight rise in phosphorus from 0.02% to 0.031% at the very top of the core (Fig. 3 and Dataset S1C). Apparently, neither the rapid economic development of south Florida after 1950 nor fertilizers leached from the Everglades Agricultural Areas to the north had a large effect on the phosphorus supply to the coring site. Moreover, phosphorus levels remained low (<0.02%) down to a depth of 69 cm, indicating little vertical transport of this labile nutrient within the sediment profile. The consistent distribution of high P levels (>0.084% to 0.165%) in the deeper sediment (Units III and IV) along with quartz and primary crustal elements, therefore, provides strong evidence for an aeolian origin for these components before the drainage era.
Sources of Aeolian Dust.
It seems unlikely that the mineral assemblage in Lithologic Unit III (pollen zones 3 and 4) was derived from a local source. Fluvial transport of the quartz sand, for example, would have been limited by the broad reach of the wetland, the exceptionally low regional gradient, and the large sediment trap formed by Lake Okeechobee at the head of the watershed. Wind transport of sand from the adjacent uplands would also have been unlikely during a humid period when the landscape was vegetated and no dunes were active, except near the coast. The beaches and shallow soils of south Florida, moreover, contain a large fraction of carbonates, whereas the mineral assemblage of Lithologic Unit III is dominated by quartz with little calcite (Fig. 3). The quartz grains in this unit also lack the highly polished surfaces and triangular etch pits characteristic of beach sands (33).
It also seems unlikely that the quartz assemblage in the NESRS core was derived from tephras blowing in from the volcanic belt of the Lesser Antilles to the east. Volcanoes on Dominica, for example, currently produce ash that has only a minor component of quartz mixed with a dominant fraction of mafic minerals and glass shards (34), which were not detected in the NESRS core. The two peaks in Al/Ti profile in this core (Fig. 4) greater than 50 could be indicative of tephras from the Dominica region (35). However, no paleorecords exist for eruptions in the Lesser Antilles between 4600 and 2800 cal BP (Units III and IV), and the more recent historic eruptions of these volcanoes (34, 35) failed to produce a detectable signal in the NESRS core. It also seems unlikely that this quartz assemblage was blown in from the west: (i) the prevailing westerly winds lack sufficient strength to transport large quartz grains to south Florida, and (ii) the Peoria Loess Plain of the lower Mississippi Valley was relatively inactive after 5000 cal BP (35).
In contrast, the mineralogy, elemental composition, and quartz surface textures in this quartz assemblage are consistent with long-distance transport from the African Sahara. The Sahara currently produces most of the world's aeolian dust, which is transported over the Atlantic Ocean by the East African Jet (14). Dust from the western Sahara is dominated by quartz and rich in titanium, which is usually ascribed to rutile (36–38). During transport over the Atlantic Ocean, quartz is dominant in this dust layer, and titanium also remains high, with Al/Ti ratios of 11 in aerosols over the western Sahara, 13 in aerosols over Cape Verde Islands, and 14 in aerosols over Barbados and Miami (36). These values are comparable with the Al/Ti ratios in Lithologic Units III and IV, that range from 13 to 32, with an average value of 20. The Sahara dust layer is also characterized by significant concentrations of phosphorus (720 ppm, which is equivalent to 0.072% dry mass less carbon) and nitrate over the Atlantic Ocean, with P usually ascribed to hydroxyapatite and amorphous aerosols that are 10–30% soluble (39, 40). These values are comparable with the concentrations of phosphorus measured in Units III and IV of the NESRS core.
The larger quartz grains in Lithologic Units III and IV are also consistent with quartz grains from hot deserts (14, 33), that are often angular if smaller than 200 µm and covered with patinas of reprecipitated silica or amorphous oxides (Fig. 4). Large dust grains (>75 µm), moreover, have been found in the atmosphere and water column from the center of the northern Pacific that were linked to long-distance transport of aeolian dust from China (41, 42). The absence of felsic minerals from the NESRS quartz assemblage is unexpected but could be the result of highly specific local controls on the mineralogy of Saharan dust (43), differential weathering and transport histories of dust (43), or preferential dissolution of dust in sediments saturated with circumneutral pore waters and organic acids (44) (SI Results).
The most likely transport mechanisms that could account for the size and abundance of quartz grains in Lithologic Unit III are tropical storms that begin as disturbances (African Easterly Waves) over the Sahara, where they entrain dust that is then transported across the Atlantic Ocean to south Florida by the African Easterly Jet (37, 45, 46). Evan et al. (47) reported that an anticorrelation exists between hurricane activity and the advection of the dusty Saharan Air Layer over the north Atlantic Ocean. The work by Evan et al. (47) suggested that this inverse relationship may be a result of (i) the dust layer disrupting the formation or reducing the intensity of tropical cyclones over the Atlantic Ocean (48) or (ii) the association of the African Easterly Waves with higher precipitation patterns that decrease dust formation over the Sahara Desert (49). However, the high winds generated by tropical cyclones (or a stronger East African Jet) are the only apparent transport mechanism that could account for the large (>20 μm) quartz grains that are abundant in Lithologic Units III and IV (Figs. 3 and 4) and the quartz peaks at 75 and 85–93 cm, respectively. Tropical storm activity must have remained intense during this wet period, because the current deposition of Saharan dust over south Florida, which peaks during the summer rainy season (50), deposited only trace amounts of quartz in the upper portions of the NESRS core (Fig. 3).
Mechanisms for Climatic Change.
The age chronology for the NESRS core indicates that, after ∼2800 cal BP the climate at this site changed from a wet phase with frequent tropical storms to a drier period with fewer tropical cyclones. Hodell et al. (25) suggested that the mid-Holocene moist period in the Caribbean before 2800 cal BP was caused by an increase in the intensity of the orbital precessional cycle of the Earth and sun. Forman et al. (51), however, hypothesized that this moist period was determined by the position of the jet stream and Bermuda High in the North Atlantic. Between 7000 and 3000 cal BP a more northerly trajectory of the jet stream and northeasterly position of the Bermuda High generated anticyclonic winds around the Bermuda High, shunting storm tracks and moist air to Florida and the Atlantic coastline of the United States. A more southern trajectory of the jet stream after 3000 cal BP then produced a southwestward shift of the Bermuda High that channeled storm tracks south of Florida to the Gulf of Mexico, creating a relatively drier climate in Florida.
Lui and Fearn (30) and Elsner et al. (52) further proposed that the intensity of the North Atlantic Oscillation controlled the location of the Bermuda High and the trajectory of hurricanes across the North Atlantic. These works suggest that an increase in the intensity of the North Atlantic Oscillation between 4000 and 3000 cal BP would have shifted the location of the Bermuda High to the northeast, shunting hurricanes and moister air to Florida (30, 52). Hurricanes then became less frequent along the Gulf Coast of Florida and Alabama (43), whereas the southeastern tip of Florida remained wet with high dustfall and tropical storm activity according to this study (43). After 3000 cal BP a southward shift in the jet stream and a movement of the Bermuda High to a more southeasterly position would have directed storm tracks away from southeast Florida to the Gulf of Mexico, which was indicated by cores from the Gulf Coast of Florida and Alabama (43). In addition, an increase in El Niño activity after 2700 cal BP which was suggested by Sandweiss (53), may have caused a decline in hurricane frequency in the Tropical Atlantic.
Conclusions
A major climatic change around 2800 cal BP seems to have altered the hydrology, nutrient influx, and vegetation of the Everglades. The multiproxy record from the NESRS core suggests that (i) dustfall was an important source for nutrients in the early history of the Everglades, (ii) a marked decline in dustfall, nutrients, and water levels after 2800 cal BP seems to have occurred concurrently with the origin of vegetation patterning in the Everglades, and (iii) development of this large wetland was probably coupled to the location of the Bermuda High that controlled atmospheric circulation patterns across the Gulf of Mexico and the Caribbean. Additional study will be needed to determine the regional replicability of this hypothesis. However, this study still provides support for the importance of long-distance transport of dust and nutrients in the development of nutrient-limited ecosystems, such as oceanic islands and extensive peatlands (54).
Materials and Methods
The NESRS core was recovered with a piston sampler (12) and was analyzed using standard methods described in more detail in SI Materials and Methods. The whole core was first analyzed for wet bulk density with a multi-sensor core logger and then cut into two longitudinal sections for imaging with a digital line scanner. One section was then subsampled at close depth intervals for determinations of (i) loss on ignition, (ii) pollen assemblages, (iii) elemental carbon and nitrogen, (iv) mineral fraction, and (v) major crustal elements and P.
Supplementary Material
Acknowledgments
We thank J. Muss, M. Lott, and D. Owen for field and laboratory assistance; D. Schnurrenberger, A. Myrbo, A. Noren, K. Brady, C. Bern, and L. Magean for laboratory assistance; E. Grimm, and B. Finney for technical assistance; and J. Holloway and three anonymous reviewers for editorial comments. We also thank Everglades National Park, the South Florida Water Management District, and NSF Award 0628647 for supporting this work.
Footnotes
The authors declare no conflict of interest.
*This Direct Submission article had a prearranged editor.
Data deposition: The data reported in this paper have been deposited in the Neotoma Paleoecology Database, www.neotomadb.org (Dataset ID 10967).
This article contains supporting information online at www.pnas.org/lookup/suppl/doi:10.1073/pnas.1222239110/-/DCSupplemental.
References
- 1.Harvey JW, McCormick PV. Groundwater’s significance to changing hydrology, water chemistry, and biological communities of a floodplain ecosystem, Everglades, South Florida, USA. Hydrogeol J. 2009;17(1):185–201. [Google Scholar]
- 2.Davis SM, Ogden JC, editors. Everglades: The Ecosystem and Its Restoration. Delray Beach, FL: St. Lucie Press; 1994. [Google Scholar]
- 3.Richardson CJ. The Everglades Experiments. New York: Springer; 2008. [Google Scholar]
- 4.Noe GB, Childers DL, Jones RD. Phosphorus biogeochemistry and the impact of phosphorus enrichment: Why is the Everglades so unique? Ecosystems. 2001;4(7):603–624. [Google Scholar]
- 5.Sklar FH, van der Valk AG. Tree Islands of the Everglades. Dordrecht, The Netherlands: Kluwer; 2003. [Google Scholar]
- 6.Ross MS, et al. Interaction of hydrology and nutrient limitation in the ridge and slough landscape of the southern Everglades. Hydrobiologia. 2006;569(1):37–59. [Google Scholar]
- 7.Willard DA, Bernhardt CE, Holmes CW, Landacre B, Marot M. Response of Everglades tree islands to environmental change. Ecol Monogr. 2006;76(4):565–583. [Google Scholar]
- 8.Givnish TJ, Volin JC, Volin VC, Muss JD, Glaser PH. Vegetation differentiation in the patterned landscape of the central Everglades: Importance of local and landscape drivers. Glob Ecol Biogeogr. 2008;17(3):384–402. [Google Scholar]
- 9.Davis JH., Jr The natural features of southern Florida, especially the vegetation and the Everglades. Florida Geol Surv Bull. 1943;25 pp 1–311. [Google Scholar]
- 10.Parker GG, Cooke CW. Late Cenozoic geology of southern Florida with a discussion of the groundwater. Florida Geol Surv Bull. 1944;25 pp 1–119. [Google Scholar]
- 11.Gleason PJ, Stone P. In: Everglades: The Ecosystem and Its Restoration. Davis SM, Ogden JC, editors. Delray Beach, FL: St. Lucie Press; 1994. pp. 149–198. [Google Scholar]
- 12.Glaser PH, Volin JC, Givnish TJ, Hansen BCS, Stricker CA. Carbon and sediment accumulation in the Everglades (USA) during the past 4000 years: Rates, drivers, and sources of error. J Geophys Res Biogeosci. 2012;117:G03026. [Google Scholar]
- 13.Craighead FC., Jr . Trees of South Florida, Volume 1: The Natural Environments and Their Succession. Coral Gables, FL: Univ of Miami Press; 1964. [Google Scholar]
- 14.Livingstone I, Warren A. Aeolian Geomorphology. Reading, MA: Addison–Wesley; 1996. [Google Scholar]
- 15. Stuiver M, Reimer PJ (2005) CALIB Radiocarbon Calibration rev5.0.2. Available at http://calib.qub.ac.uk/calib/. Accessed May 6, 2008.
- 16. Grimm EC (2002) TGV1311.EXE. Available at http://museum.state.il.us/pub/grimm/. Accessed May 12, 2013.
- 17.Loveless CM. A study of the vegetation of the Florida Everglades. Ecology. 1959;40(1):1–9. [Google Scholar]
- 18.Long RW, Lakela O. A Flora of Tropical Florida: A Manual of the Seed Plants and Ferns of Southern Peninsular Florida. Coral Gables, FL: Univ of Miami Press; 1971. [Google Scholar]
- 19.Godfrey RK, Woote JW. Aquatic and Wetland Plants of Southeastern United States: Monocotyledons. Athens, GA: Univ of Georgia Press; 1981. [Google Scholar]
- 20.Kushlan JA. In: Ecosystems of Florida. Myers RL, Ewel JJ, editors. Orlando, FL: Univ Central Florida Press; 1990. pp. 324–363. [Google Scholar]
- 21.Schottler SP, Engstrom DR. A chronological assessment of Lake Okeechobee (Florida) J Paleolimnol. 2006;36(1):19–36. [Google Scholar]
- 22.Watts WA. A late-Quaternary record of vegetation from Lake Annie, south-central Florida. Geology. 1975;3(6):344–346. [Google Scholar]
- 23.Grimm EC, Jacobson GL, Jr, Watts WA, Hansen BCS, Maasch KA. A 50,000-year record of climate oscillations from Florida and its temporal correlation with the heinrich events. Science. 1993;261(5118):198–200. doi: 10.1126/science.261.5118.198. [DOI] [PubMed] [Google Scholar]
- 24.Hodell DA, et al. Reconstruction of Caribbean climate change over the past 10,500 years. Nature. 1991;352(6338):790–793. [Google Scholar]
- 25.Hodell DA, Curtis JH, Brenner M. Possible role of climate in the collapse of classic Maya civilization. Nature. 1995;375(6530):391–394. [Google Scholar]
- 26.Higuera-Gundy A, et al. A 10,300 14C yr record of climate and vegetation change from Haiti. Quat Res. 1999;52(2):159–170. [Google Scholar]
- 27.van Soelen EE, Brooks GR, Larson RA, Sinninghe Damsté JS, Reichar GJ. Mid- to late-Holocene coastal environmental changes in southwest Florida, USA. Holocene. 2012;22(8):929–938. [Google Scholar]
- 28.Donnelly JP, Woodruff JD. Intense hurricane activity over the past 5,000 years controlled by El Niño and the West African monsoon. Nature. 2007;447(7143):465–468. doi: 10.1038/nature05834. [DOI] [PubMed] [Google Scholar]
- 29.Lane P, Donnelly JP, Woodruff JD, Hawkes AD. A decadally-resolved paleohurricane record archived in the late Holocene sediments of a Florida sinkhole. Mar Geol. 2011;287(1):14–30. [Google Scholar]
- 30.Lui K-B, Fearn ML. Quaternary reconstruction of prehistoric landfall frequencies of catastrophic hurricanes in northwestern Florida from lake sediment records. Quat Res. 2000;54(2):238–245. [Google Scholar]
- 31.Donders TH, Wagner F, Dilcher DL, Visscher H. Mid- to late-Holocene El Nino-Southern Oscillation dynamics reflected in the subtropical terrestrial realm. Proc Natl Acad Sci USA. 2005;102(31):10904–10908. doi: 10.1073/pnas.0505015102. [DOI] [PMC free article] [PubMed] [Google Scholar]
- 32.Vitousek PM, Howarth RW. Nitrogen limitation on land and in the sea—how can it occur? Biogeochemistry. 1991;13(2):87–115. [Google Scholar]
- 33. Pettijohn FJ, Potter PE, Siever R (1987) Sand and Sandstone (Springer, New York), 2nd Ed.
- 34. Bonadonna C, et al. (2002) The Eruption of the Soufriére Hills Volcano, Mountserrat 19951/999, Memoir Geological Society of London no. 21, eds Druitt TH, Kokelaar BP (Geological Society of London, London), pp 483–516.
- 35.Muhs DR, Budahn JR, Prospero JM, Skipp G, Herwitz SR. Soil genesis on the island of Bermuda in the Quaternary: The importance of African dust transport and deposition. J Geophys Res. 2012;117:F03025. [Google Scholar]
- 36. Glaccum RA (1978) The mineralogical and elemental composition of mineral aerosols over the tropical North Atlantic: The influence of Saharan dust. MS thesis (Univ of Miami, Miami, FL)
- 37.Glaccum RA, Prospero JM. Saharan aerosols over the tropical North Atlantic-Mineralogy. Mar Geol. 1980;37(3-4):295–321. [Google Scholar]
- 38.Schutz L, Rahn KA. Trace-element concentrations in erodible soils. Atmos Environ. 1982;16(1):171–176. [Google Scholar]
- 39.Mahowald N, et al. Global distribution of atmospheric phosphorus sources, concentrations and deposition rates, and anthropogenic impacts. Global Biogeochem Cycles. 2008;22:GB4026. [Google Scholar]
- 40.Baker AR, French M, Linge KL. Trends in aerosol nutrient solubility along a west–east transect of the Saharan dust plume. Geophys Res Lett. 2006;33:L07805. [Google Scholar]
- 41.Betzer PR, et al. Long-range transport of giant mineral aerosol particles. Nature. 1988;336(6199):568–571. [Google Scholar]
- 42.Lawrence CR, Neff JC. The contemporary physical and chemical flux of aeolian dust: A synthesis of direct measurements of dust deposition. Chem Geol. 2009;267(1):46–63. [Google Scholar]
- 43.Moreno T, et al. Geochemical variations in aeolian mineral particles from the Sahara-Sahel Dust Corridor. Chemosphere. 2006;65(2):261–270. doi: 10.1016/j.chemosphere.2006.02.052. [DOI] [PubMed] [Google Scholar]
- 44.Bennet PC, Siegel DI, Hill B, Glaser PH. The fate of silica in a peat bog. Geology. 1991;19(4):328–331. [Google Scholar]
- 45.Carlson TN, Prospero JM. The large-scale movement of Saharan air outbreaks over the northern equatorial Atlantic. J Appl Meteorol. 1972;11(2):283–297. [Google Scholar]
- 46.Prospero JM. Long-range transport of mineral dust in the global atmosphere: Impact of African dust on the environment of the southeastern United States. Proc Natl Acad Sci USA. 1999;96(7):3396–3403. doi: 10.1073/pnas.96.7.3396. [DOI] [PMC free article] [PubMed] [Google Scholar]
- 47.Evan AT, Dunion J, Foley JA, Heidinger AK, Velden CS. New evidence for a relationship between Atlantic tropical cyclone activity and African dust outbreaks. Geophys Res Lett. 2006;33:L19813. [Google Scholar]
- 48.Dunion JP, Velden CS. The impact of the Saharan air layer on Atlantic tropical cyclone activity. Bull Am Meteorol Soc. 2004;85(3):353–365. [Google Scholar]
- 49.Landsea CW, Gray WM. The strong association between western Sahelian monsoon rainfall and intense Atlantic hurricanes. J Clim. 1992;5(5):435–453. [Google Scholar]
- 50.Prospero JM, Carlson TN. Vertical and areal distribution of Saharan dust over the western equatorial North Atlantic Ocean. J Geophys Res. 1972;77(27):5255–5265. [Google Scholar]
- 51.Forman SL, Oglesby R, Markgraf V, Stafford T. Paleoclimatic significance of Late Quaternary eolian deposition on the Piedmont and High Plains, Central United States. Global Planet Change. 1995;11(1-2):35–55. [Google Scholar]
- 52.Elsner JB, Liu K-B, Kocher B. Spatial variations in major U. S. hurricane activity: Statistics and a physical mechanism. J Clim. 2000;13(13):2293–2305. [Google Scholar]
- 53.Sandweiss DH, et al. Variation in Holocene El Niño frequencies: Climate records and cultural consequences in ancient Peru. Geology. 2001;29(7):603–606. [Google Scholar]
- 54.Chadwick OA, Derry LA, Vitousek PM, Huebert BJ, Hedin LO. Changing sources of nutrients during four million years of ecosystem development. Nature. 1999;397(6719):491–497. [Google Scholar]
Associated Data
This section collects any data citations, data availability statements, or supplementary materials included in this article.