Abstract
We have created unique near-infrared (NIR)–emitting nanoscale metal-organic frameworks (nano-MOFs) incorporating a high density of Yb3+ lanthanide cations and sensitizers derived from phenylene. We establish here that these nano-MOFs can be incorporated into living cells for NIR imaging. Specifically, we introduce bulk and nano-Yb-phenylenevinylenedicarboxylate-3 (nano-Yb-PVDC-3), a unique MOF based on a PVDC sensitizer-ligand and Yb3+ NIR-emitting lanthanide cations. This material has been structurally characterized, its stability in various media has been assessed, and its luminescent properties have been studied. We demonstrate that it is stable in certain specific biological media, does not photobleach, and has an IC50 of 100 μg/mL, which is sufficient to allow live cell imaging. Confocal microscopy and inductively coupled plasma measurements reveal that nano-Yb-PVDC-3 can be internalized by cells with a cytoplasmic localization. Despite its relatively low quantum yield, nano-Yb-PVDC-3 emits a sufficient number of photons per unit volume to serve as a NIR-emitting reporter for imaging living HeLa and NIH 3T3 cells. NIR microscopy allows for highly efficient discrimination between the nano-MOF emission signal and the cellular autofluorescence arising from biological material. This work represents a demonstration of the possibility of using NIR lanthanide emission for biological imaging applications in living cells with single-photon excitation.
Keywords: luminescence, bioimaging, nanoparticle, bioanalysis, sensitization
Luminescent reporters emitting in the near-infrared (NIR) region of the electromagnetic spectrum are highly advantageous for biological imaging applications for several reasons. Biological material has low autofluorescence in the NIR window, which allows facile discrimination between the desired signal of the reporter and the background, leading to an enhanced signal-to-noise ratio and improved detection sensitivity (1). Additionally, NIR light scatters less than visible light, and therefore results in increased optical imaging resolution (2, 3). Finally, NIR photons interact less with biological material compared with visible photons, thus decreasing the risk of disturbing or damaging the biological systems being observed.
NIR reporters, such as cyanine dyes (4, 5) and quantum dots (6), have previously been shown to be useful for biological imaging applications. However, these materials have broad emission bands that limit their ability to be easily discriminated from the background fluorescence. Additionally, cyanine dyes exhibit limited photostability and quantum dots can display blinking emission, making it difficult to conduct repeated or long-term experiments for such purposes as tracking a moiety or monitoring a process.
Several lanthanide cations emit in the NIR and have some advantages with respect to organic fluorophores and semiconductor nanocrystals. Lanthanide cations have narrower emission bandwidths than organic fluorophores and semiconductor nanocrystals. Their emission wavelengths are not affected by the environment, allowing them to be used in a broad range of conditions, including varied pH, and biological environments. Most luminescent lanthanide reporters are more resistant to photobleaching than organic fluorophores, which enables them to be used repeatedly and/or over long periods of time (7–9).
Free lanthanide cations have low extinction coefficients due to the forbidden nature of the f → f transition. Therefore, lanthanides must be sensitized using a photonic converter, such as an organic chromophore, through the “antenna effect” (10). “Antennae” must be placed in sufficiently close proximity to the lanthanide to provide sensitization, resulting in the compound emitting a sufficient number of photons for detection. Lanthanides must also be protected from −OH, −NH, and −CH vibrational overtones, which can quench lanthanide luminescence (11).
Despite the fact that several lanthanide complexes emitting in the NIR have been described in the literature because they have exciting properties for biological imaging in vivo (11–16), we are aware of only one example used for imaging in living cells (17). In that example, two-photon excitation was used, requiring specialized laser equipment.
We have tested a newly developed strategy by designing unique NIR-emitting lanthanide metal-organic frameworks (MOFs) that overcome these limitations by incorporating a large number of NIR-emitting Yb3+ cations and phenylenevinylene dicarboxylate (PVDC) sensitizers in a small volume. Using lanthanides as the metal in a MOF allows for the creation of well-defined crystalline species that can emit a large number of photons per unit volume to promote sensitive detection. This method provides an avenue for both the sensitization and the protection of the lanthanide cations, simultaneously fulfilling their requirement for large coordination numbers.
We previously reported Yb3+-PVDC NIR-emitting lanthanide MOFs that exhibit tunable photophysical properties (18, 19) as bulk materials. To take advantage of using the PVDC ligand/sensitizer, we modified the synthesis and created a unique crystalline framework in the bulk phase, Yb-PVDC-3. Through a reverse microemulsion synthesis (20–22), we were able to create a nanoscale version of the same MOF, and in proof-of-principle experiments, we demonstrate its ability to operate as a NIR imaging agent in living HeLa and NIH 3T3 cells.
To date, there have been reports of nanoscale MOFs and coordination polymers for use as biosensors (20), as contrast agents for MRI (21–25) and computed tomography (26), and in drug delivery (24, 25, 27); in this report, we demonstrate that NIR-emitting nanoMOFs can be designed as imaging agents for biological systems.
Results and Discussion
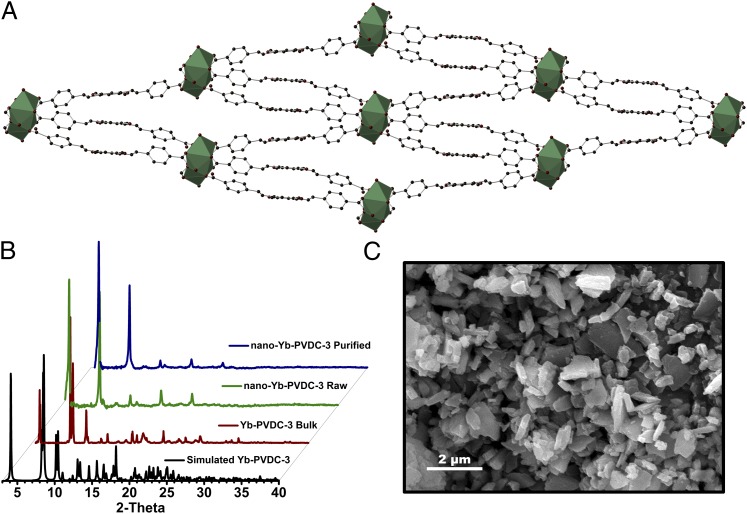
Yb-PVDC-3 crystallizes in the low-symmetry space group P-1 and exhibits infinite Yb-carboxylate secondary building units (SBUs) along the a-crystallographic direction (SI Appendix, Tables S2–S6). The SBU consists of octacoordinated Yb3+ with six carboxylates from three ligands and two oxygen atoms from two dimethylformamide molecules. The Yb-PVDC-3 nano-MOF is isostructural to the corresponding bulk material, as evidenced by powder X-ray diffraction (PXRD) pattern comparisons (Fig. 1). Compared with the previously reported Yb-PVDC-1 and Yb-PVDC-2 (18), Yb-PVDC-3 has lower symmetry and its structure is significantly more condensed, with 1D channels along the a-crystallographic direction measuring ∼43 × 9 Å (Yb3+-Yb3+ center-to-center distances). The 1D channels are very narrow: close contacts (e.g., 0.281, 0.637, and 0.706 Å) exist between the PVDC linkers lining opposite channel walls. SEM was used to study the size of nano-Yb-PVDC-3. The nano-MOFs exhibit a block-like morphology (Fig. 1), having average dimensions of 0.5 (±0.3) μm (length) by 316 (±156) nm (width) by 176 (±52) nm (thickness) (SI Appendix, Fig. S1).
Fig. 1.
(A) Crystal structure of Yb-PVDC-3 viewed along the a-crystallographic axis. Yb3+ is shown as a polyhedron (C, dark gray; O, red; Yb3+, green). (B) PXRD patterns for simulated and bulk Yb-PVDC-3 and raw and purified nano-Yb-PVDC-3. (C) SEM image of nano-Yb-PVDC-3; average dimensions (±SD) are 0.5 (±0.3) μm (length), 316 (±156) nm (width), and 176 (±52) nm (thickness).
Spectroscopic Characterization of Nano-Yb-PVDC-3.
Luminescence properties of the material were studied in water (SI Appendix, Fig. S5) and 0.1 M Hepes buffer (pH 7.3) (Fig. 2). In both environments, nano-Yb-PVDC-3 exhibits Yb3+ luminescence centered at 970 nm upon excitation of the PVDC sensitizer. The overlap of the absorption spectrum of H2-PVDC with the excitation spectrum of the MOF indicates that sensitization is occurring via the antenna effect. Because Yb3+ does not have accepting levels in the visible, the observed Yb3+ luminescence must result from the sensitization provided by PVDC located in sufficiently close proximity to the lanthanide cations. Quantum yields were recorded to quantify the efficiency of the energy transfer between the antenna and Yb3+ and the protection of the lanthanide cations against sources of nonradiative deactivation. Upon excitation at 450 nm, the quantum yield values for the nano-Yb-PVDC-3 are, respectively, 1.0 (±0.3) × 10−4 in water and 5.2 (±0.8) × 10−5 in 0.1 M Hepes buffer (pH 7.3) (Table 1). These values are relatively small in comparison to the best luminescent lanthanide compounds (11–16), but our approach of using a MOF system to maximize the number of chromophores and lanthanide cations per unit volume is expected to reduce the negative impact of this limitation.
Fig. 2.
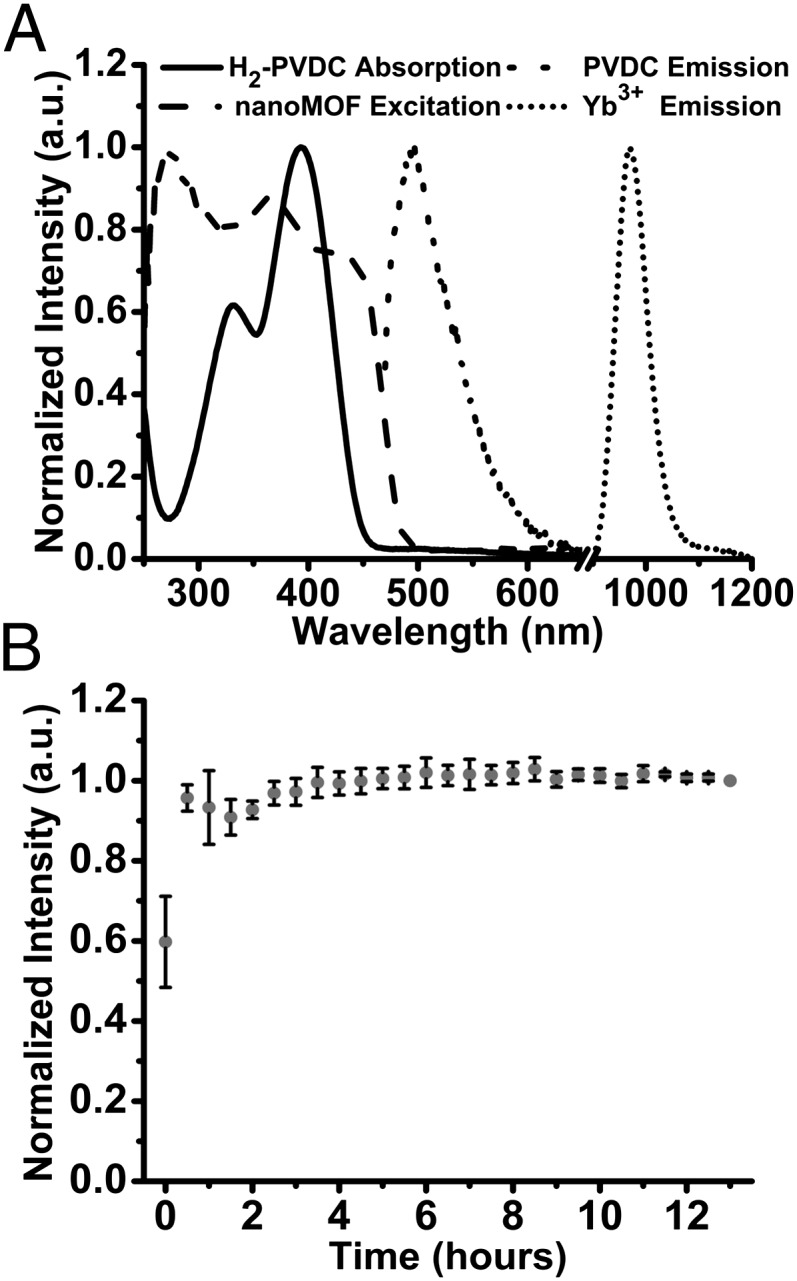
Spectroscopic characterization of nano-Yb-PVDC-3 (30 μg/mL) in 0.1 M Hepes buffer (pH 7.3). (A) H2-PVDC absorbance spectrum (solid line), nano-Yb-PVDC-3 excitation spectrum (long-dashed line, λem = 980 nm), and emission spectra for both the ligand (short-dashed line) and lanthanide (dotted line) obtained by exciting nano-Yb-PVDC-3 at 355 nm. (B) Photobleaching study monitoring the emission at 970 nm over a period of 13 h. Error bars represent SD based on three independent experiments. a.u., arbitrary unit.
Table 1.
Relative quantum yields (Φ) and luminescent lifetimes (τx) of Yb3+-centered emission at 980 nm
| Solvent* | ΦYb† | τ1‡ , μs | τ2‡, μs | |
| Nano-Yb-PVDC-3 | H2O | 1.0 (±0.3) × 10−4 | 7.01 (±0.07) | 1.51 (±0.01) |
| 0.1 M Hepes | 5.2 (±0.8) × 10−5 | 4.6 (±0.1) | 1.04 (±0.02) |
Nano-MOFs as a crystalline solid under solvent.
λex = 450 nm.
λex = 355 nm.
Luminescence lifetime experimental data (Table 1) were best fit with a biexponential decay curve, indicating that the Yb3+ cations are present within two distinct environments. All the Yb3+ ions have a coordination number of eight (octacoordinate), and the different environments are attributed to the Yb3+ present in the interior of the nano-MOF and the Yb3+ on the edges/faces of the crystallites (exterior). Exterior Yb3+ is more susceptible to nonradiative deactivation and is likely responsible for the shorter lifetime values.
Ideally, reagents for bioanalytical applications and for imaging should emit a constant number of photons over time, and their signals should not be affected by species and parameters other than the targeted analyte. A common limitation for organic fluorophores is their tendency to photobleach when exposed to light. Photobleaching test experiments were performed by exposing a suspension of nano-Yb-PVDC-3 in 0.1 M Hepes buffer (pH 7.3) to light over a period of 13 h. Results showed that the signal does not significantly change (Fig. 2), a strong indication that the material is stable in these conditions and usable over this extended period.
Material Stability Studies.
We rigorously evaluated the stability of Yb-PVDC-3 and nano-Yb-PVDC-3 in various conditions, including water, 0.1 M Hepes buffer (pH 7.3), and cellular media. First, samples of Yb-PVDC-3 were soaked in water or 0.1 M Hepes. At different time points, SEM images were collected to visualize bulk structure and PXRD patterns were obtained to confirm retention of crystallinity (SI Appendix, Figs. S2–S4). In general, SEM images indicate that the crystals remain intact after soaking in water or Hepes for up to 4 wk; however, crystallite fragmentation occurs during this time, and the average crystallite size consequently decreases. Notably, the faces of the crystallites remain smooth, and no significant pitting was observed on the crystal surfaces. PXRD patterns of crystallites collected after soaking in either water or Hepes buffer for different time intervals indicate retention of crystallinity.
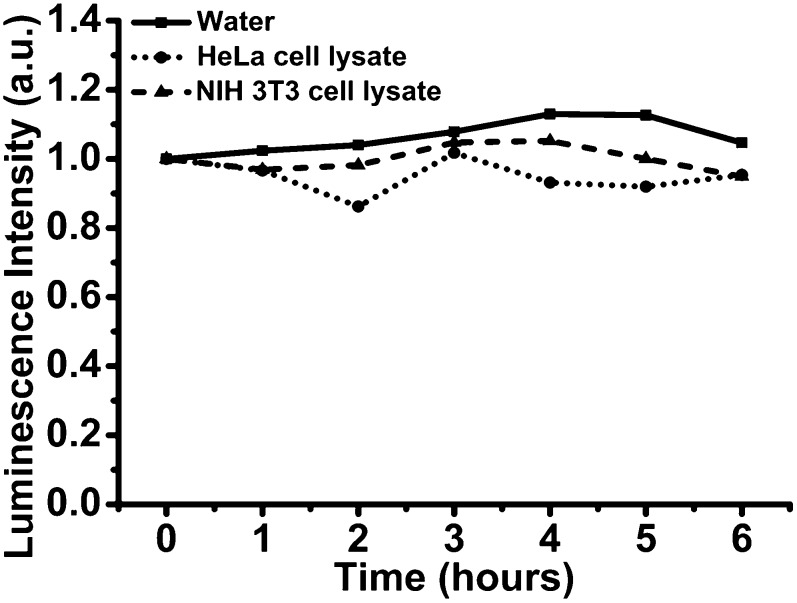
We emphasize that to preserve the luminescence properties of the NIR-emitting reagent and to prevent the release of free lanthanide cations in cellular media, the nano-Yb-PVDC-3 must remain intact. Therefore, crystallite stability was quantitatively evaluated in cellular media by monitoring the Yb3+ emission signal upon excitation of the antenna. The signal of the lanthanide cation can only be generated if the antenna effect is present and only if the sensitizer is located sufficiently close to the lanthanide. Therefore, if the MOF dissociates via hydrolysis of the Yb-carboxylate bonds, one should expect a significant decrease in the luminescence. Signal arising from Yb3+ was measured at regular time intervals after dilution of nano-Yb-PVDC-3 in cell lysate (HeLa or NIH 3T3 cells) and in water as a control. Intensities of the emission bands compared with initial intensity (recorded upon monitoring the Yb3+ band at 970 nm) are reported in Fig. 3. The emission intensity remains constant over time, which suggests that the nano-Yb-PVDC-3 structure is not significantly modified by cellular components. Indeed, the constant total intensity of the Yb3+ emission signal is a quantitative indication that the measured nano-MOFs retain most of their integrity in this environment. Therefore, we expect that nano-Yb-PVDC-3 will be intact inside of the cell.
Fig. 3.
Spectroscopic evaluation of the nano-Yb-PVDC-3 stability in cell lysate. Emission intensity values correspond to the maximum of Yb3+ emission (970 nm) after dilution of nano-Yb-PVDC-3 at 30 μg/mL in water (solid line), HeLa cell lysate (dotted line), or NIH 3T3 cell lysate (dashed line).
Nano-Yb-PVDC-3 Cytotoxicity.
A principal aim of this study is to test nano-Yb-PVDC-3 in cells as NIR imaging agents. Human cancer (HeLa) and mouse (NIH 3T3) cells were chosen as representative cell lines. The nano-Yb-PVDC-3 cytotoxicity was first evaluated for both cell lines using the Alamar Blue assay. The cell proliferation test presented in Fig. 4 indicated a similar effect on the two cell lines after 24 h of incubation. The compound is found to have relatively low toxicity for concentrations up to 50 μg/mL. A working concentration was chosen on the criterion of 90% of cellular viability (30 μg/mL).
Fig. 4.
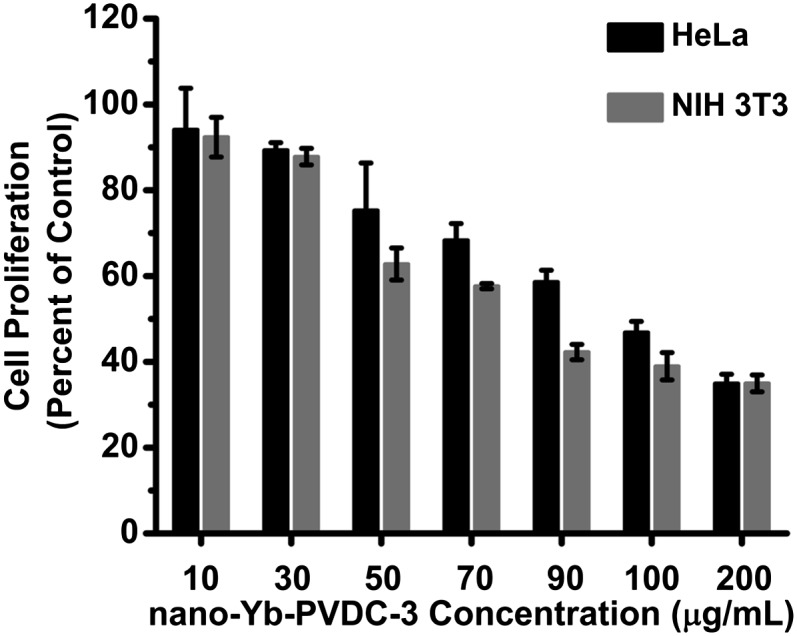
Cellular viability by Alamar Blue assay on HeLa and NIH 3T3 cells after 24 h of incubation with increasing concentrations of nano-Yb-PVDC-3.
Cellular Uptake.
Internalization of nano-Yb-PVDC-3 by the cells was confirmed with confocal microscopy and inductively coupled plasma (ICP) spectrometry experiments. Microscopy images in Fig. 5 show that nano-Yb-PVDC-3 is internalized by cells. Optical slices of 1 μm (less than cell thickness) were obtained for NIH 3T3 cells after incubation with nano-Yb-PVDC-3 at 30 μg/mL. Despite the fact that untreated cells generate autofluorescence at these wavelengths (λex = 365 nm, λem = 445/50 nm), we could unambiguously detect the chromophore signal inside cells. This fluorescence signal is located preferentially in the cytoplasm (and not in the nucleus). To confirm results of confocal microscopy, the quantity of nano-Yb-PVDC-3 associated with 1 × 10⁶ cells was measured by ICP (SI Appendix, Table S1). More specifically, the amount of Yb3+ in cells was measured after 24 h of incubation of HeLa and NIH 3T3 cells with nano-Yb-PVDC-3. ICP results confirm the presence of nano-Yb-PVDC-3 in the cells. For both cell lines, the Yb3+ amount in cells increases with the amount of nano-Yb-PVDC-3 present in cell incubation medium. No saturation of cellular uptake has been observed at these concentrations. The uptake is more pronounced in NIH 3T3 cells than in HeLa cells. The mechanism of cell uptake has not been analyzed at this time and is currently under investigation.
Fig. 5.
Cellular uptake of nano-Yb-PVDC-3. Confocal microscopy of NIH 3T3 cells after incubation with nano-Yb-PVDC-3 at 30 μg/mL (Upper) and of untreated cells (Lower). Bright-field (A), H2-PVDC emission (λex = 365/12 nm, λem = 445/50 nm) (B), and merged (C) images are shown.
Spectral Microcopy.
Several cellular compounds are excited by UV light and emit in the visible, such as tryptophan (λex = 275 nm, λem = 335 nm), collagen (λex = 335 nm, λem = 405 nm), and NAD(P)H (λex = 340 nm, λem = 460 nm) (28). To confirm that the detected signal observed with confocal microscopy is arising from PVDC emission, we conducted spectral fluorescence microscopy analysis on cells after 24 h of incubation with nano-Yb-PVDC-3. At each individual point of the image (step size = 3 µm), an emission spectrum was recorded. The intensity value averaged between 400 and 600 nm was used to create an intensity map of the cell (Fig. 6). This spectral fluorescence microscopy experiment permits the discrimination of nano-Yb-PVDC-3 emission from cellular autofluorescence. The signal obtained from untreated cells (SI Appendix, Fig. S6) can be attributed to cellular autofluorescence with a maximum of the emission band located at 420 nm. Spectra obtained from treated cells result from the overlay of autofluorescence emission and PVDC emission signals (λem = 455 nm). This result is a third confirmation that the nano-MOF is able to enter incubated cells.
Fig. 6.
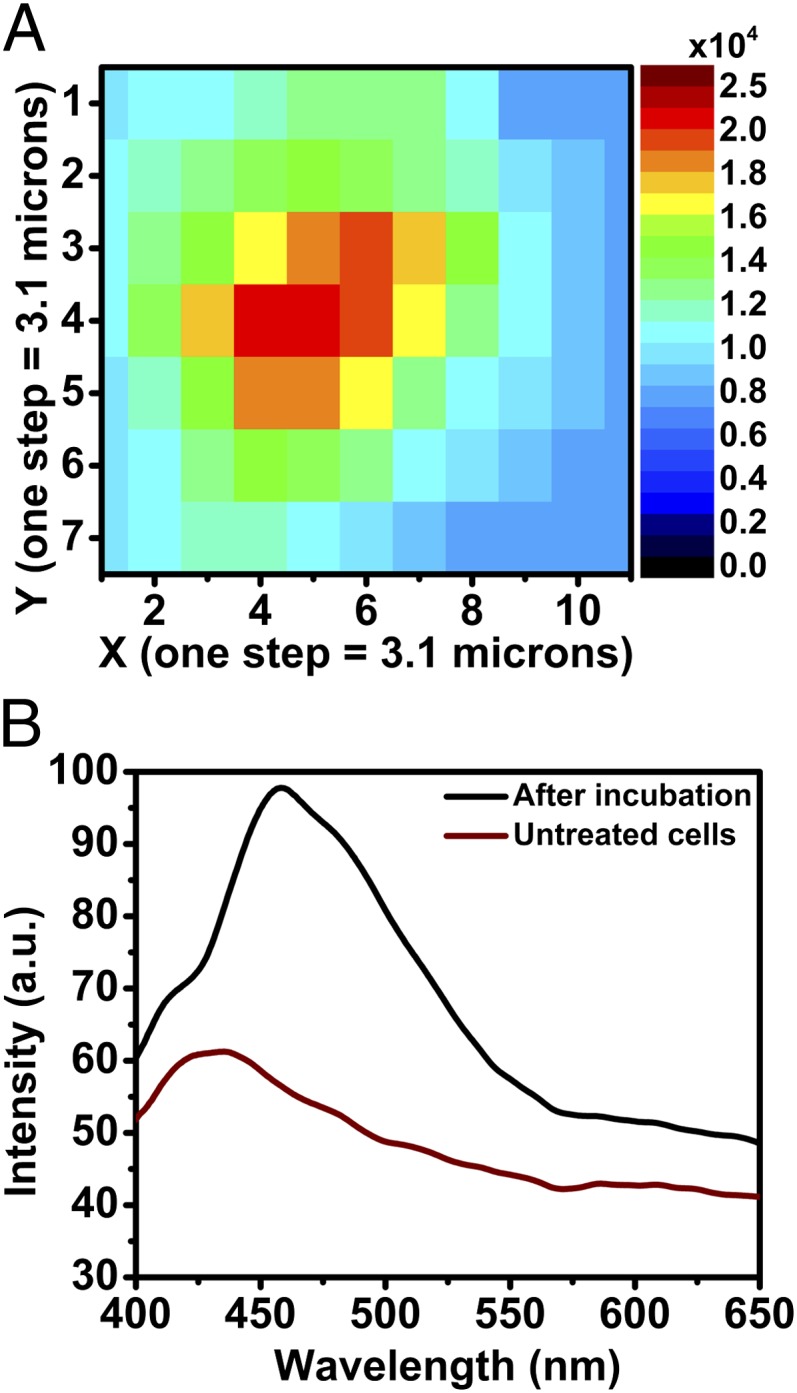
Spectral microscopy of nano-Yb-PVDC-3 in the visible region. (A) Fluorescence intensity map of NIH 3T3 cells after incubation with 30 μg/mL nano-Yb-PVDC-3 (λex = 340 nm, λem = 390–650 nm). (B) Spectra correspond to the mean of intensity of each map.
NIR Epifluorescence Microscopy.
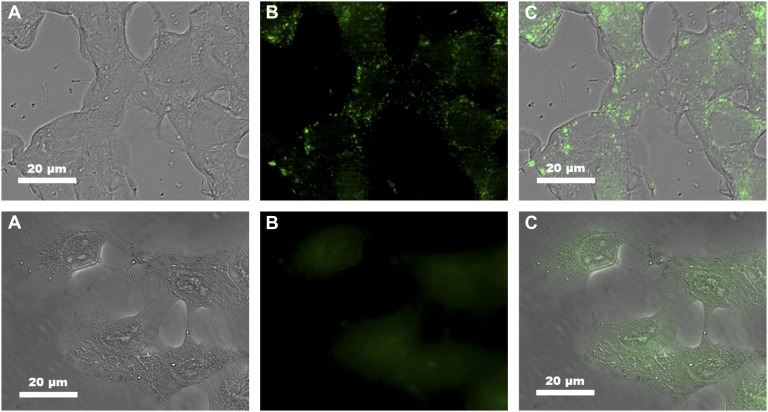
The ability to use nano-Yb-PVDC-3 as a NIR lanthanide-based imaging agent was tested in a NIR microscopy experimental setup. HeLa and NIH 3T3 cells were incubated with 30 μg/mL nano-Yb-PVDC-3 for 24 h. Visible chromophore PVDC and NIR Yb3+ emission signals were both observed by epifluorescence microscopy in the same field (Fig. 7). In the NIR microscopy mode, the specific Yb3+ emission signal was collected with good sensitivity (1-s exposure time can be considered as short for NIR signals) as the result of a high signal-to-noise ratio. In parallel, switching to visible detection mode, the specific fluorescence arising from the PVDC was observed in addition to the cellular autofluorescence, and the resulting images were used as a comparison. The difference observed between the PVDC and Yb3+ emission signal results from the discrimination of the NIR signal from the visible autofluorescence arising from the biological material.
Fig. 7.
Visible and NIR microscopy images of nano-Yb-PVDC-3 in HeLa cells (Upper) and NIH 3T3 cells (Lower) (λex = 340 nm). Bright-field (A), H2-PVDC emission (λex = 377/50 nm, λem = 445/50 nm) (B), and Yb3+ emission (λex = 377/50 nm, λem = long pass 770 nm) (C) images are shown.
The images presented in Fig. 7 report NIR microscopy experiments obtained with a lanthanide compound in living cells using a conventional excitation source.
Conclusion
We have designed and synthesized nano-Yb-PVDC-3, a unique nano-MOF emitting in the NIR, and we have tested its ability to operate as a NIR imaging agent in cells. The overlap of the excitation spectra of nano-Yb-PVDC-3 with the absorbance spectra of H2-PVDC demonstrates that the Yb3+ is sensitized through the antenna effect, where the sensitizers embedded in the MOF structure are excited and transfer energy to the accepting level of the Yb3+ cations.
The nanoscale material was shown to be luminescent in water and Hepes buffer. As expected, the nano-MOF quantum yield is low in water, likely due to the energy level of the −OH overtone vibration being so close to that of Yb3+. It further decreases when the nano-MOF is placed in Hepes, likely due to the increase in number of moieties with −OH vibrations in solution. This low quantum yield does not prevent imaging applications because of the polysensitizer and polymetallic design.
The energy transfer is conserved after 24 h of incubation in cellular media, indicating that crystalline nano-Yb-PVDC-3 remains in the cells. This stability, combined with cytotoxicity results, is promising for using nano-Yb-PVDC-3 as a biological probe for in vivo applications.
We have been able to observe NIR microscopy images in living cells based on the signal arising from Yb3+, sensitized via the antenna effect. This achievement has been realized by the use of a unique nano-MOF that is able to incorporate a large number of lanthanide sensitizers (PVDC) and a large number of NIR-emitting lanthanide cations, resulting in an increase in the number of emitted NIR photons per unit volume.
Materials and Methods
Reagents.
Reagents were obtained from commercial sources and used as received without further purification. The H2-PVDC was synthesized according to a previously published method (18). The 1,4-dimethoxybenzene (99%), paraformaldehyde (PFA; 95%), sodium methoxide (0.05 M in methanol), anhydrous methanol (99.8%), anhydrous benzene (99.8%), methylamine (40 wt% in water), hexadecyltrimethylammonium bromide (CTAB; >98% powder), heptane (Reagent Plus, 99%), Yb(NO3)3⋅5H2O (99.999%), YbCl3⋅6H2O (99.998%), and DMSO (ACS Reagent, >99.9%) were purchased from Sigma–Aldrich. Hydrobromic acid (33 wt% in acetic acid) was purchased from Fluka. Anhydrous chloroform (99.8%) and anhydrous toluene (99.8%) were purchased from Acros. Triphenylphosphine was purchased from MCB Reagents. Methanol (Certified ACS), tetrahydrofuran (Certified ACS), and potassium hydroxide (Certified ACS pellets) were purchased from Fisher. Methyl 4-formylbenzoate (>98%) was purchased from TCI. N,N-dimethylformamide [DMF, American Chemical Society (ACS) grade] was purchased from Emmanuel Merck Darmstadt. Nitric acid (HNO3, ACS Reagent, 36.5–38.0%) and glacial acetic acid (Baker Analyzed Reagent) were purchased from J. T. Baker. Hexanol (purified) was purchased from Spectrum. Ethanol (200 proof) was purchased from Decon Laboratories, Inc.
Synthesis of Yb-PVDC-3.
In a 20-mL glass vial, a solution of 4,4′-(1E,1′E)-2,2′-(2,5-dimethoxy-1,4-phenylene)bis(ethene-2,1-diyl)dibenzoic acid (H2-PVDC; 86.0 mg, 0.20 mmol) in DMF (4.0 mL) was added to a solution of Yb(NO3)3⋅5H2O (22.5 mg, 0.05 mmol) in DMF (1.0 mL) and HNO3 (1 mL, 1 M aqueous) to produce a neon green solution. The vial was capped and placed in a 105 °C isotemp oven for 12 h to produce yellow crystalline needles of the product. The crystals were collected, washed with DMF (4 × 5 mL), and air-dried (29.7 mg, 61.8%).
Elemental analysis (EA) calculated (%) for Yb1(C26H20O6)1.5(DMF)⋅0.65 DMF, H2O was C, 55.31; H, 4.60; and N, 2.42. EA found was C, 54.87; H, 4.22; and N, 2.51. EA calculated (%) for the water exchange product, Yb1(C26H20O6)1.5(H2O)2⋅(DMF)0.25(H2O)2.25, was C, 52.43; H, 4.46; and N, 0.38. EA found was C, 52.12; H, 3.68; and N, 0.30. FTIR (KBr, 4,000 to 700 cm−1) was as follows: 3,424 [broad (br)], 3,054 [weak (w)], 2,998 (w), 2,936 (w), 2,830 (w), 1,665 [DMF C = O medium (m)], 1,601 (m), 1,544 (m), 1,413 [COO−, very strong (vs)], 1,338 (w), 1,260 (w), 1,211 (s), 1,181 (m), 1,108 (w), 1,044 (s), 965 (m), 861 (w), 779 (trans C = C − H, s), and 709 cm−1 (w).
Synthesis of Nano-Yb-PVDC-3.
This procedure is based on previously reported reverse microemulsion nano-MOF synthesis (20–22). The methylammonium salt of the H2-PVDC ligand [PVDC-(NH2CH3)2] was prepared by dissolving H2-PVDC in methylamine (40 wt% in water) removing the solvent under reduced pressure, and adding a known amount of water to achieve the desired concentration. A 0.05 M solution of CTAB was prepared by dissolving CTAB in a 9:1 (vol/vol) ratio of heptane/hexanol and stirring for 30 min. A w = 10 (where w is the H2O/CTAB molar ratio) reaction mixture was prepared as follows. A solution of YbCl3⋅6H2O (225 μL, 0.05 M in H2O) was added to a flask containing the CTAB mixture (25 mL, 0.05 M in heptane/hexanol). A solution of PVDC-(NH2CH3)2 (225 μL, 0.05 M in H2O) was added to another flask also containing the CTAB mixture (25 mL, 0.05 M). The flasks were stirred separately for at least 10 min until clear. The YbCl3⋅6H2O solution was then added to the PVDC solution and stirred for 24 h at room temperature. Yellow solid was isolated via centrifugation at 3,313 × g for 30 min, followed by washing with ethanol (3 × 35 mL).
The product was purified by dialysis using a regenerated cellulose membrane (nominal molecular weight cut off of 3,500; Fisher Scientific) in DMSO for 3 d. The solid recovered from the dialysis membrane was dried in a vacuum oven (40 °C, 40 mbar).
FTIR.
FTIR spectra were measured on a Nicolet Avatar 360 FTIR spectrometer using KBr pellet samples. Absorptions are described as vs, s, m, w, shoulder, and br, and stretches are labeled as symmetrical or asymmetrical. Data were analyzed using the Omnic Software Package (Thermo Scientific).
PXRD.
PXRD patterns for the bulk material were collected using a Bruker AXS D8 Discover powder diffractometer at 40 kV, 40 mA, for Cu Kα (λ = 1.5406 Å) with a scan speed of either 0.20 s per step or 0.50 s per step and a step size of 0.02018°. PXRD patterns for the nano-MOFs were collected using a Philips PW1830 diffractometer at 40 kV, 40 mA, for Cu Kα (λ = 1.54056 Å) with a scan speed of 0.50 s per step and a step size of 0.020°.
SEM.
Samples were coated with palladium for 60 s before analysis with a Philips XL 30 scanning electron microscope. ImageJ 1.47f software (National Institutes of Health) was used to measure the particle dimensions, and OriginPro 8.6 software (OriginLab Corporation) was used to process the data.
Spectroscopic Characterization.
Excitation and emission spectra were measured using a HORIBA Jobin Yvon Fluorolog 3-22 spectrofluorometer equipped with a R928 Hamamatsu detector for visible detection and with a DSS-IGA020L detector (Electro-Optical Systems, Inc.) for the NIR domain on colloidal suspension at 30 μg/mL in Hepes 0.1 M (pH 7.3). An integrating sphere developed by Frédéric Gumy and Jean-Claude G. Bünzli (Laboratory of Lanthanide Supramolecular Chemistry, École Polytechnique Féderale de Lausanne, Lausanne, Switzerland) as an accessory to the Fluorolog 3-22 spectrofluorometer (patent pending) using quartz tube sample holders was used for determination of quantum yield and was commercialized and manufactured by GMP (29). Spectra were corrected for variations in lamp intensity over the spectra range, as well as for excitation monochromator, emission monochromator, and detector responses.
Relative quantum yields were measured with the Fluorolog 3-22 setup described above using ytterbium tropolonate ([Yb(trop)4]−) in DMSO [ΦYb = 1.9 (±0.1) × 10−3] as a reference (12).
Using the Fluorolog 3-22 setup described above, emission spectra (λex = 355 nm) were collected every 30 min for a photobleaching study. The samples were exposed to white light from the xenon lamp of the Fluorolog 3-22 between collection of emission spectra.
Luminescence Lifetimes.
Luminescence lifetimes were measured using a neodymium yttrium aluminum garnet Continuum Powerlite 8010 laser (355 nm, third harmonic) as the excitation source. Emission was collected at a right angle to the excitation beam, and wavelengths were selected by a Spectral Products CM 110 1/8 m monochromator. The signal was monitored by a Hamamatsu R316-02 photomultiplier tube and collected on a 500-MHz bandpass digital oscilloscope (Tektronix TDS 754D). Signals from >1,000 flashes were collected and averaged. Three decay curves were collected for each sample, and the data were analyzed using OriginPro 8.6 software with exponential fitting modes.
Cell Culture.
HeLa (human epithelial ovarian carcinoma) and NIH 3T3 (mouse embryonic fibroblast) cell lines obtained from the American Type Culture Collection were grown at 37 °C in a 5% CO2-humidified atmosphere. Every 3–4 d, 5 × 10⁵ cells were seeded into a 25-cm2 plastic flask. Cells were cultivated in MEM and in DMEM, respectively, supplemented with 10% FBS and, for HeLa cells, 1% l-glutamine, 1% penicillin/streptomycin, and 1% of a 100-fold nonessential amino acid solution.
Alamar Blue Assay.
For the cytotoxicity test, 1 × 10⁴ cells per well were seeded in a 96-well microplate. After 24 h of cell attachment, the cells were treated with increasing concentrations of nano-Yb-PVDC-3 diluted for 24 h at 37 °C. The cytotoxicity was evaluated with the Alamar Blue assay (Invitrogen). Alamar Blue was added to the medium (10% vol/vol), and its fluorescence (λex = 530 nm, λem = 590 nm) was measured after 4 h at 37 °C with a microplate reader (Victor 3V; PerkinElmer). This assay compares the fluorescence of untreated cells with the fluorescence of cells after incubation with nano-Yb-PVDC-3.
Stability in Cell Biological Media.
The emission of nano-Yb-PVDC-3 was followed during 6 h in cell lysate. For this, 1 × 10⁶ cells (HeLa and NIH 3T3) were collected. After centrifugation, the pellets were resuspended in water and cell membranes were lysed using a 25-gauge syringe for a mechanical lyse. The lysates were centrifuged again to exclude cell membrane fragments. Nano-Yb-PVDC-3 was diluted in the supernatant, and the emission spectra were measured using the Fluorolog 3-22.
ICP for Cellular Uptake Quantification.
To quantify the concentration of Yb3+ in cells, 1 × 10⁶ cells were seeded in a six-well microplate. After 24 h of attachment, the cells were incubated with 20, 30, or 40 mg/L of nano-Yb-PVDC-3 for 24 h at 37 °C. Cells were trypsinized and centrifuged for 5 min at 423 × g. The pellets were resuspended in nitric acid overnight before adding PBS buffer to achieve a final concentration of 5% nitric acid. The measurements were taken on an ICP (Ultimate; Jobin Yvon) coupled with a photomultiplier tube and high dynamic detection system.
Confocal Images.
Confocal fluorescence imaging was realized with an Axio Observer Z1 fluorescence inverted microscope (Zeiss) equipped with an ORCA-R2 high-resolution CCD camera linked to a computer driving the Axiovision (Zeiss) acquisition software. Confocality was obtained by means of a Zeiss-ApoTome module of optical sectioning using structured illumination by grids oscillations. The Zeiss HXP-120 light source (metal halide) was used as an excitation system and was combined with a UV cube filter unit as follows: λex = 365/12 nm, λem = 445/50 nm to observe phenylene emission. Optical sections were recorded at magnifications of 20× and 40× with Zeiss Plan-APOCHROMAT 20×/0.8 and 40×/1.4 objectives, respectively.
NIR Microscopy.
NIR epifluorescence microscopy was realized on the same microscope as for confocal images, except that the microscope was equipped with an EMCCD Evolve 512 Photometrics camera. The Zeiss HXP 120 was combined with a cube filter as follows: λex = 365/12 nm, λem = 445/50 nm to observe phenylene emission with 280 ms of exposition and λex = 377/50 nm, λem = long pass 770 nm to observe Yb3+ emission with 1 s of exposition.
Spectral Fluorescence Microscopy.
Cells were plated onto 25-mm round quartz coverslips and incubated for 24 h with 30 μg/mL nano-Yb-PVDC-3 before fixation with 4% PFA. Fluorescence spectra were recorded on the POLYPHEME, the deep ultraviolet inverted microspectrofluorometer installed at the DISCO (Dichroïsme, Imagerie, Spectrométrie de masse pour la Chimie et la biOlogie) beamline at Synchrotron SOLEIL (30). Excitation at 280 or 340 nm was provided by the continuous emittance from the DISCO beamline bending magnet and focused on the sample using a 100× microscope objective (Zeiss).
One full fluorescence emission spectrum was recorded on each point of the image (6 × 10 pixels) with an acquisition time of 10 s. A fluorescence intensity map was reconstructed in the spectral region of interest.
Supplementary Material
Acknowledgments
We thank the staff of the DISCO at SOLEIL synchrotron for beam time allocation and assistance during data collection (Proposal 20110179). We thank David Gosset and the Centre de Biophysique Moléculaire cytometry platform for the microscope access. We thank the University of Pittsburgh Department of Chemistry support services, the Mechanical Engineering and Materials Science Department for SEM and PXRD access, and the Petersen Nanoscale Fabrication and Characterization Facility for PXRD access. S.P. acknowledges support from the Institut National de la Santé et de la Recherche Médicale. K.A.G. acknowledges support from the Mary E. Warga Predoctoral Fellowship. We thank La Ligue contre le Cancer and La Région Centre for funding. The work in France was carried out in the framework of European Cooperation in Science and Technology Action TD1004 and CM1006. N.L.R. acknowledges partial support from the National Science Foundation (DMR-0954380).
Footnotes
The authors declare no conflict of interest.
*This Direct Submission article had a prearranged editor.
Data deposition: The atomic coordinates and X-ray structure have been deposited in the Cambridge Structural Database, Cambridge Crystallographic Data Centre, Cambridge CB2 1EZ, United Kingdom (CSD reference no. 931598).
This article contains supporting information online at www.pnas.org/lookup/suppl/doi:10.1073/pnas.1305910110/-/DCSupplemental.
References
- 1.Mahmood U, Weissleder R. Near-infrared optical imaging of proteases in cancer. Mol Cancer Ther. 2003;2(5):489–496. [PubMed] [Google Scholar]
- 2.Lim YT, et al. Selection of quantum dot wavelengths for biomedical assays and imaging. Mol Imaging. 2003;2(1):50–64. doi: 10.1162/15353500200302163. [DOI] [PubMed] [Google Scholar]
- 3.Frangioni JV. In vivo near-infrared fluorescence imaging. Curr Opin Chem Biol. 2003;7(5):626–634. doi: 10.1016/j.cbpa.2003.08.007. [DOI] [PubMed] [Google Scholar]
- 4.Mujumdar RB, Ernst LA, Mujumdar SR, Lewis CJ, Waggoner AS. Cyanine dye labeling reagents: Sulfoindocyanine succinimidyl esters. Bioconjug Chem. 1993;4(2):105–111. doi: 10.1021/bc00020a001. [DOI] [PubMed] [Google Scholar]
- 5.Roederer M, Kantor AB, Parks DR, Herzenberg LA. Cy7PE and Cy7APC: Bright new probes for immunofluorescence. Cytometry. 1996;24(3):191–197. doi: 10.1002/(SICI)1097-0320(19960701)24:3<191::AID-CYTO1>3.0.CO;2-L. [DOI] [PubMed] [Google Scholar]
- 6.Sargent EH. Infrared quantum dots. Adv Mater. 2005;17(5):515–522. [Google Scholar]
- 7.Alcala MA, et al. Preferential accumulation within tumors and in vivo imaging by functionalized luminescent dendrimer lanthanide complexes. Biomaterials. 2011;32(35):9343–9352. doi: 10.1016/j.biomaterials.2011.07.076. [DOI] [PMC free article] [PubMed] [Google Scholar]
- 8.Alcala MA, et al. Luminescence targeting and imaging using a nanoscale generation 3 dendrimer in an in vivo colorectal metastatic rat model. Nanomedicine. 2011;7(3):249–258. doi: 10.1016/j.nano.2010.09.002. [DOI] [PMC free article] [PubMed] [Google Scholar]
- 9.Nockemann P, et al. Photostability of a highly luminescent europium β-diketonate complex in imidazolium ionic liquids. Chem Commun (Camb) 2005;(34):4354–4356. doi: 10.1039/b506915g. [DOI] [PubMed] [Google Scholar]
- 10.Weissman SI. Intramolecular energy transfer the fluorescence of complexes of europium. J Chem Phys. 1942;10(4):214–217. [Google Scholar]
- 11.Eliseeva SV, Bünzli J-CG. Lanthanide luminescence for functional materials and bio-sciences. Chem Soc Rev. 2010;39(1):189–227. doi: 10.1039/b905604c. [DOI] [PubMed] [Google Scholar]
- 12.Zhang J, Badger PD, Geib SJ, Petoud S. Sensitization of near-infrared-emitting lanthanide cations in solution by tropolonate ligands. Angew Chem Int Ed Engl. 2005;44(17):2508–2512. doi: 10.1002/anie.200463081. [DOI] [PubMed] [Google Scholar]
- 13.Zhang J, Petoud S. Azulene-moiety-based ligand for the efficient sensitization of four near-infrared luminescent lanthanide cations: Nd3+, Er3+, Tm3+, and Yb3+ Chemistry. 2008;14(4):1264–1272. doi: 10.1002/chem.200701068. [DOI] [PubMed] [Google Scholar]
- 14.Comby S, Imbert D, Chauvin AS, Bünzli JC. Stable 8-hydroxyquinolinate-based podates as efficient sensitizers of lanthanide near-infrared luminescence. Inorg Chem. 2006;45(2):732–743. doi: 10.1021/ic0515249. [DOI] [PubMed] [Google Scholar]
- 15.Korovin YV, Rusakova NV, Popkov YA, Dotsenko VP. Luminescence of ytterbium and neodymium in complexes with bis-macrocyclic ligands. J Appl Spectrosc. 2002;69(6):841–844. [Google Scholar]
- 16.Bünzli J-CG, Eliseeva SV. Intriguing aspects of lanthanide luminescence. Chem Sci. 2013;4(5):1939–1949. [Google Scholar]
- 17.D’Aléo A, et al. Ytterbium-based bioprobes for near-infrared two-photon scanning laser microscopy imaging. Angew Chem Int Ed Engl. 2012;51(27):6622–6625. doi: 10.1002/anie.201202212. [DOI] [PubMed] [Google Scholar]
- 18.White KA, et al. Near-infrared emitting ytterbium metal-organic frameworks with tunable excitation properties. Chem Commun (Camb) 2009;(30):4506–4508. doi: 10.1039/b909658b. [DOI] [PubMed] [Google Scholar]
- 19.White KA, et al. Near-infrared luminescent lanthanide MOF barcodes. J Am Chem Soc. 2009;131(50):18069–18071. doi: 10.1021/ja907885m. [DOI] [PubMed] [Google Scholar]
- 20.Rieter WJ, Taylor KML, Lin W. Surface modification and functionalization of nanoscale metal-organic frameworks for controlled release and luminescence sensing. J Am Chem Soc. 2007;129(32):9852–9853. doi: 10.1021/ja073506r. [DOI] [PMC free article] [PubMed] [Google Scholar]
- 21.Taylor KML, Rieter WJ, Lin W. Manganese-based nanoscale metal-organic frameworks for magnetic resonance imaging. J Am Chem Soc. 2008;130(44):14358–14359. doi: 10.1021/ja803777x. [DOI] [PubMed] [Google Scholar]
- 22.Rieter WJ, Taylor KML, An H, Lin W, Lin W. Nanoscale metal-organic frameworks as potential multimodal contrast enhancing agents. J Am Chem Soc. 2006;128(28):9024–9025. doi: 10.1021/ja0627444. [DOI] [PMC free article] [PubMed] [Google Scholar]
- 23.Taylor KML, Jin A, Lin W. Surfactant-assisted synthesis of nanoscale gadolinium metal-organic frameworks for potential multimodal imaging. Angew Chem Int Ed Engl. 2008;47(40):7722–7725. doi: 10.1002/anie.200802911. [DOI] [PubMed] [Google Scholar]
- 24.Taylor-Pashow KML, Della Rocca J, Xie Z, Tran S, Lin W. Postsynthetic modifications of iron-carboxylate nanoscale metal-organic frameworks for imaging and drug delivery. J Am Chem Soc. 2009;131(40):14261–14263. doi: 10.1021/ja906198y. [DOI] [PMC free article] [PubMed] [Google Scholar]
- 25.Horcajada P, et al. Porous metal-organic-framework nanoscale carriers as a potential platform for drug delivery and imaging. Nat Mater. 2010;9(2):172–178. doi: 10.1038/nmat2608. [DOI] [PubMed] [Google Scholar]
- 26.deKrafft KE, et al. Iodinated nanoscale coordination polymers as potential contrast agents for computed tomography. Angew Chem Int Ed Engl. 2009;48(52):9901–9904. doi: 10.1002/anie.200904958. [DOI] [PubMed] [Google Scholar]
- 27.Rieter WJ, Pott KM, Taylor KML, Lin W. Nanoscale coordination polymers for platinum-based anticancer drug delivery. J Am Chem Soc. 2008;130(35):11584–11585. doi: 10.1021/ja803383k. [DOI] [PubMed] [Google Scholar]
- 28.Wagnières GA, Star WM, Wilson BC. In vivo fluorescence spectroscopy and imaging for oncological applications. Photochem Photobiol. 1998;68(5):603–632. [PubMed] [Google Scholar]
- 29.Aebischer A, Gumy F, Bünzli J-CG. Intrinsic quantum yields and radiative lifetimes of lanthanide tris(dipicolinates) Phys Chem Chem Phys. 2009;11(9):1346–1353. doi: 10.1039/b816131c. [DOI] [PubMed] [Google Scholar]
- 30.Giuliani A, et al. DISCO: A low-energy multipurpose beamline at synchrotron SOLEIL. J Synchrotron Radiat. 2009;16(Pt 6):835–841. doi: 10.1107/S0909049509034049. [DOI] [PubMed] [Google Scholar]
Associated Data
This section collects any data citations, data availability statements, or supplementary materials included in this article.


