Abstract
We have performed a theoretical study to explore the potential and limitations of synthetic collimation for SPECT imaging with stacked detector acquisition (dual magnification). This study will be used to optimize SiliSPECT, a small-animal SPECT for imaging small volumes such as mouse brain at high sensitivity and resolution. The synthetic collimation enables image reconstruction with a limited number of camera views and in the presence of significant multiplexing. We also developed a new formulation to quantify the multiplexed object sensitivity and investigated how this changes for different acquisition parameters such as number of pinholes and combinations of front and back detector distances for imaging objects as large as a mouse brain. In our theoretical studies, we were not only able to demonstrate better reconstruction results by incorporating two detector magnifications in comparison to either alone, but also observed an improved image reconstruction by optimizing the detector-collimator distances to change the multiplexing ratio between the front and back detectors.
Introduction
Pinhole collimators are widely used for SPECT imaging of small animals, in which high spatial resolution is required over a small field of view (FOV) (1–12). A number of studies described methods to optimize multi-pinhole parameters such as their number, diameter and magnification (13,14). Higher projection magnification and pinhole density can increase the overlap of pinhole projections, known as multiplexing, which reduces the accuracy of the information about the photon trajectories. Several studies have addressed the effect of overlapping projections on the reconstructed image quality (13–18). Highly multiplexed projections with very dense pinhole distribution require some type of decoding process and are commonly referred to as coded apertures (19–21). Another way of reducing the problem with multiplexing is to obtain projections at several collimator-detector distances, known as synthetic collimation (22). Since the amount of projection overlap varies as a function of distance, the total data contain information on how the projections are multiplexed and, therefore, offer the possibility to remove the multiplexing effects. Despite its potential, synthetic collimation has not been extensively investigated. This is mainly due to its practical implementation, which requires a dedicated imaging system that is capable of acquiring projection data at multiple magnifications, ideally simultaneously. SiliSPECT (23) is a small-animal SPECT that can implement synthetic collimation. This system incorporates a dual-headed, stationary camera system with a pair of stacked silicon double-sided strip detectors (23,24) in each camera head. The stacked detector acquisition not only allows simultaneous collection of projection data at two magnifications but also improves the overall system sensitivity by allowing the photons that penetrate undetected through the front detectors to interact in the back detectors. This design compensates the modest detection efficiency of silicon (39% at 30 keV), bringing the total detection efficiency to approximately 63% at 30 keV. In the past, we implemented the synthetic collimation into image reconstruction of both simulated and experimental projections from SiliSPECT (23,24,25). Although we successfully reconstructed images from projection data at dual magnification, the potential/limitations of synthetic collimation was still unexplored. Dual-magnification acquisition will fundamentally allow more projection overlap than a conventional acquisition. Also, its implementation with high resolution detectors will allow projection acquisition at very low magnification. This makes the collimator-detector distances the critical parameters in the optimization of a SPECT system with synthetic collimation. Therefore, our multi-pinhole optimization approach is mainly focused on the collimator-detector distances and number of pinholes, since these parameters will ultimately determine the system resolution and sensitivity. In this study we will formulate a quantitative formulation for the loss of object information through the projection overlap on stacked detectors. We will determine how the combination of front/back detector distances will change the multiplexed object sensitivity. We will also evaluate the impact of detector distances and collimator configuration on the image reconstruction.
Methods
1. SiliSPECT, a high resolution SPECT system for low-energy gamma-ray imaging
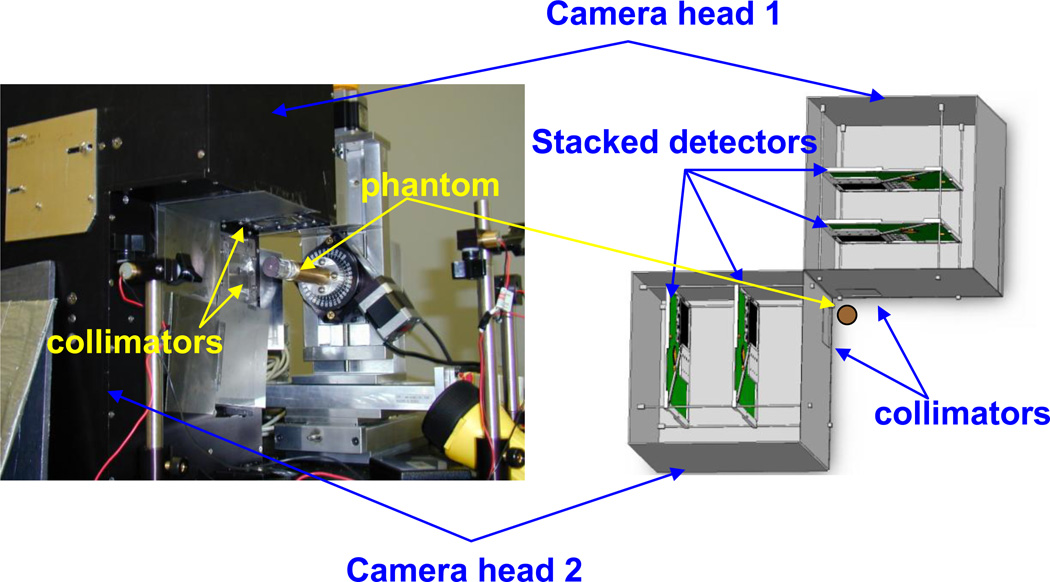
Our theoretical study is based on the SiliSPECT (Figure 1), which utilizes four silicon double-sided strip detectors. Each detector is 1.0 mm thick and has a 60.4 mm × 60.4 mm active area. The detector surface is covered by 1024 strips on each side for event positioning. The strips on one side are orthogonal to those on the other side to provide the 2D coordinates of the interaction position. The strip pitch is 59 µm. This produces for each detector 1,048,576 virtual resolution elements, each 59 µm × 59 µm.
Figure 1.
Left: Photographic image of SiliSPECT, a dual-headed small-animal SPECT that is under construction. Right: Schematic design of SiliSPECT. The double-sided strip detectors are pair-wise stacked on each camera head. The distance and angle between the camera heads can be modified.
2. Multi-pinhole configuration
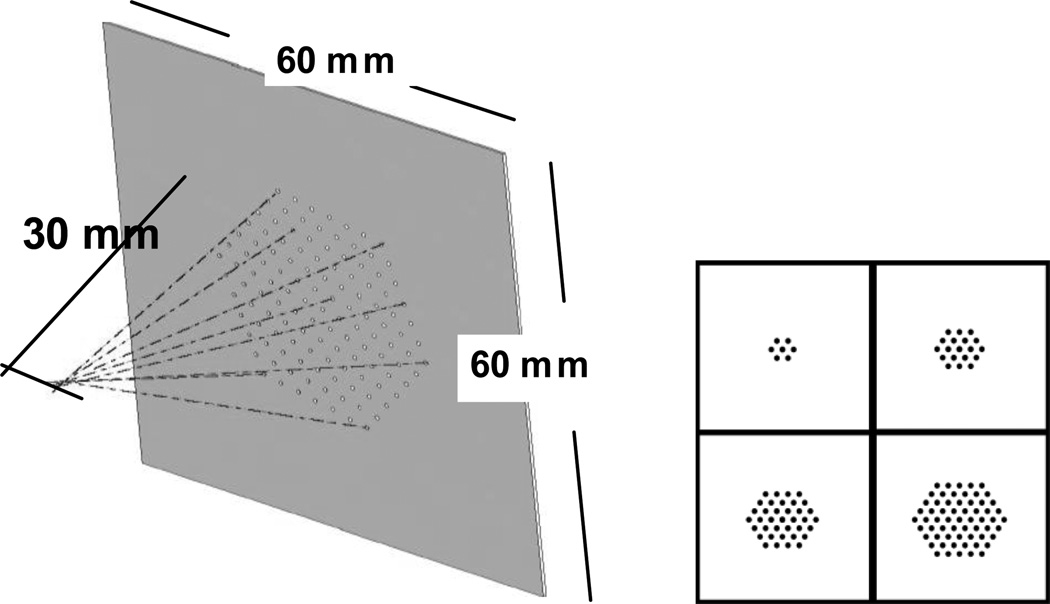
A previously fabricated multi-pinhole collimator served as a prototype model for this theoretical study. The collimator is made of a 250 µm tungsten layer with 127 cylindrically shaped pinholes laser drilled through the plate. The pinholes are packed in a hexagonal configuration, with 2.5 mm center-to-center spacing between the pinholes. The pinhole radius is 250 µm. The fraction of penetrated photons along the edge of the pinhole is reduced by using cylindrically shaped pinholes where the pinhole opening angle is reduced to its maximum extent. At low energies, the sensitivity and resolution of pinholes with very small opening angle are dominated by their geometric components since the penetration becomes insignificant. Using Metzler’s formulation (27) for knife-edge pinholes, the fraction of penetrated photons through a pinhole with an opening angle of less than one degree (collimator material: 250 µm tungsten) is less than 0.3 % of the total photon transmission (125I) through the pinhole.
All pinholes are tilted toward a common focal point at a distance of 30 mm away from the collimator plate. We previously reported on the characteristics of this collimator, and its significance for imaging small volumes such as mouse brain at high sensitivity while suppressing the background photons from regions outside of the mouse brain (25). With this basic geometry, we generated different sets of multi-pinhole configurations by successively adding a hexagonal ring of pinholes to the previous configuration. Starting with a single pinhole, we obtained subsequent configurations of 7, 19, 37 and 61 pinholes (Figure 2).
Figure 2.
Left: Schematic of the prototype multi-pinhole collimator. All pinholes are tilted toward a common focal point at 30 mm distance. Right: Illustration of hexagonal configurations of 7,19, 37 and 61 pinholes used for this simulation study.
3. Phantoms
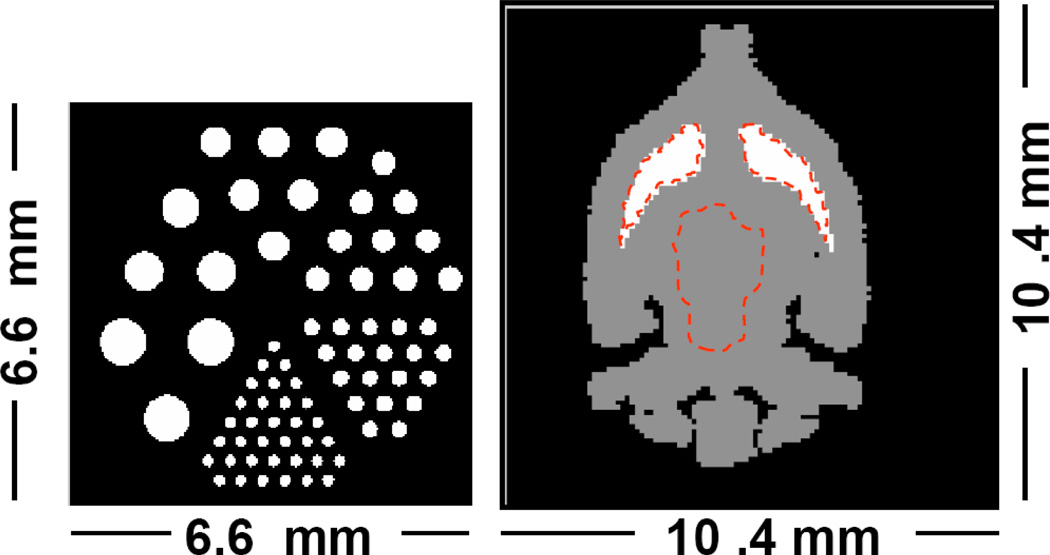
Two digital phantoms were used. The first phantom is a mouse brain phantom with activity ratio of 3-to-1 between striatum and the rest of the brain. This phantom contains 104 × 104 × 104 voxels of each 100 × 100 × 100 µm3. The second phantom is a miniaturized hot-rod phantom with 6 sections of rods with diameters between 180 and 750 µm. The spacing between the rods is twice the rod diameter. This phantom contains 220 × 220 × 220 voxels of each 30 × 30 × 30 µm3 for resolution evaluation. The voxel values of this phantom were selected to represent a 60 min acquisition of 0.925 MBq of activity of 125I. A sample slice of each phantom is illustrated in Figure 3.
Figure 3.
Digital phantoms used for the simulation study. The dotted lines on the mouse brain phantom indicate the regions of interest used for the contrast analysis (left striatum, right striatum and background).
4. Generation of projection data
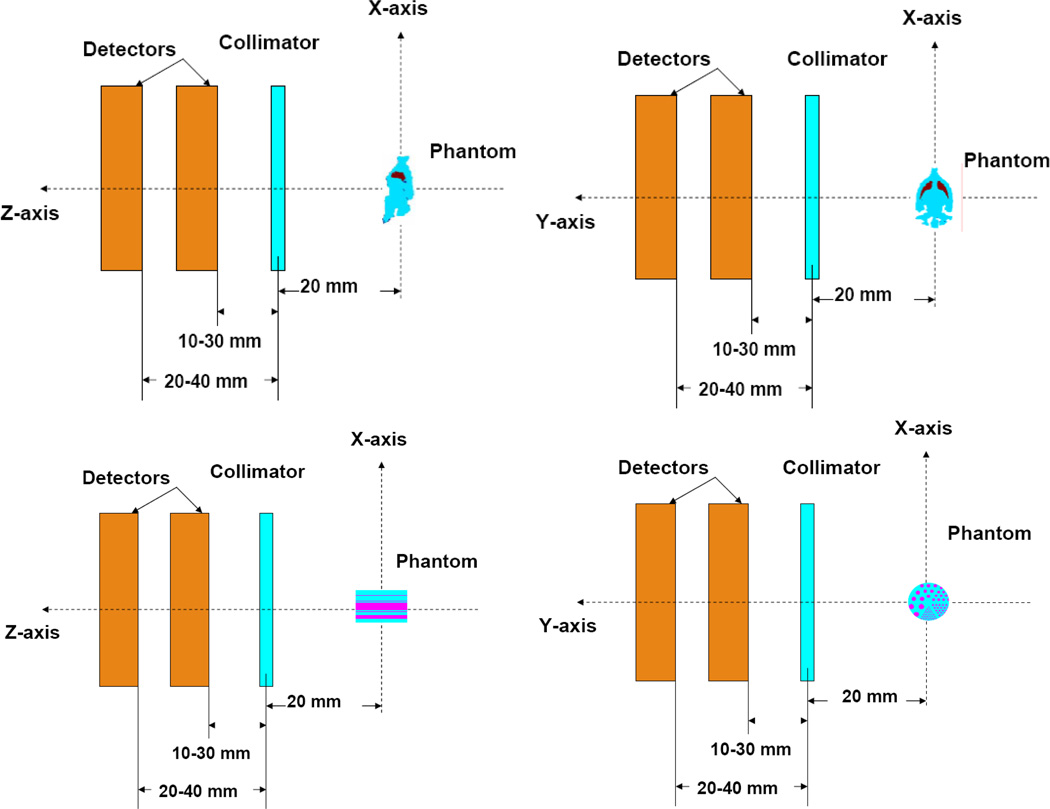
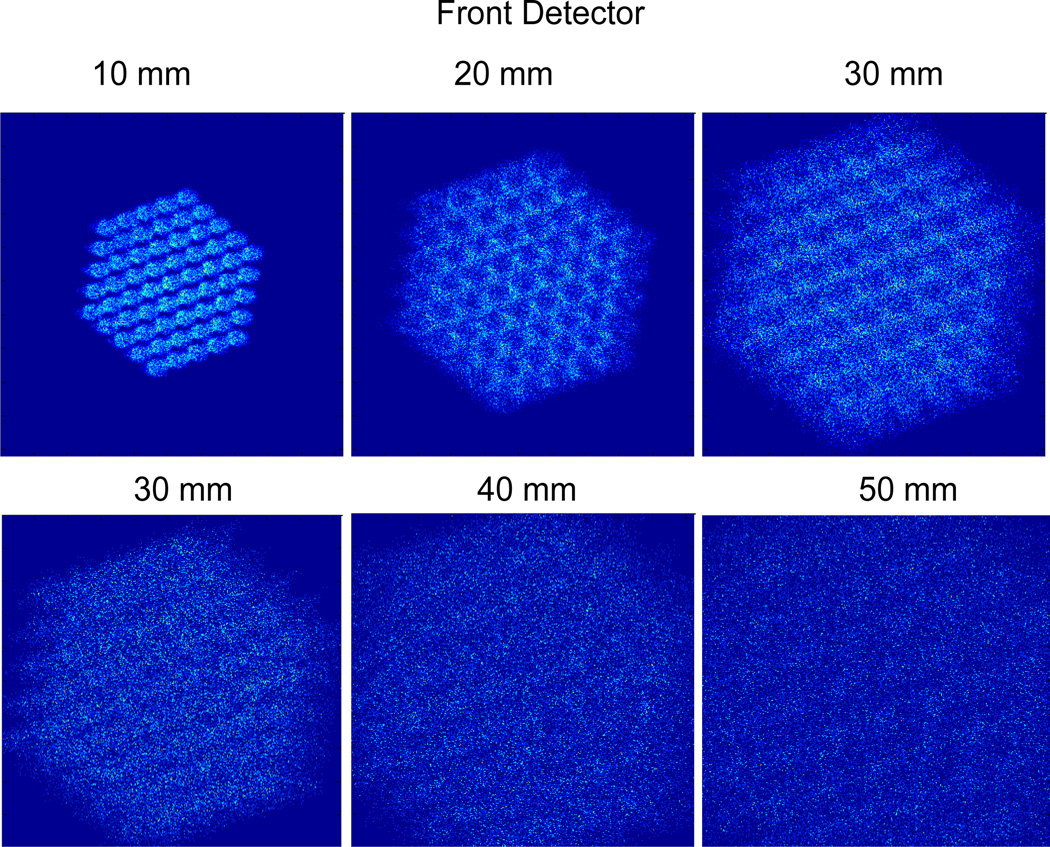
The phantoms were placed at 20 mm distance from the collimator. The projections were acquired at distances 10, 20 and 30 mm between the front detector and the collimator and 20, 30, 40 and 50 mm between the back detector and collimator (Figure 4). The longest back detector-collimator distances, 40–50 mm, gave magnification limits on the back detector due to truncation of the projection images with 37–61 pinholes. For each combination of stacked detector distances, we simulated noisy projections for 5 different pinhole configurations (1, 7, 19, 37 and 61 pinholes). Figure 5 shows samples noisy projection images of the mouse brain phantom at different front and back detector distances through 61 pinholes.
Figure 4.
top: Imaging geometry for the acquisition of the mouse brain phantom (Coronal and sagittal views) with two orthogonal camera heads using stacked detector geometry. Bottom: Imaging geometry for the acquisition of the hot-rod phantom
Figure 5.
Sample noisy projection images of the mouse brain phantom on the front (top) and back (bottom) detector at different magnifications (10mm, 20mm, 30mm, 40mm, 50mm) with a 61-pinhole collimator.
5. Image Reconstruction
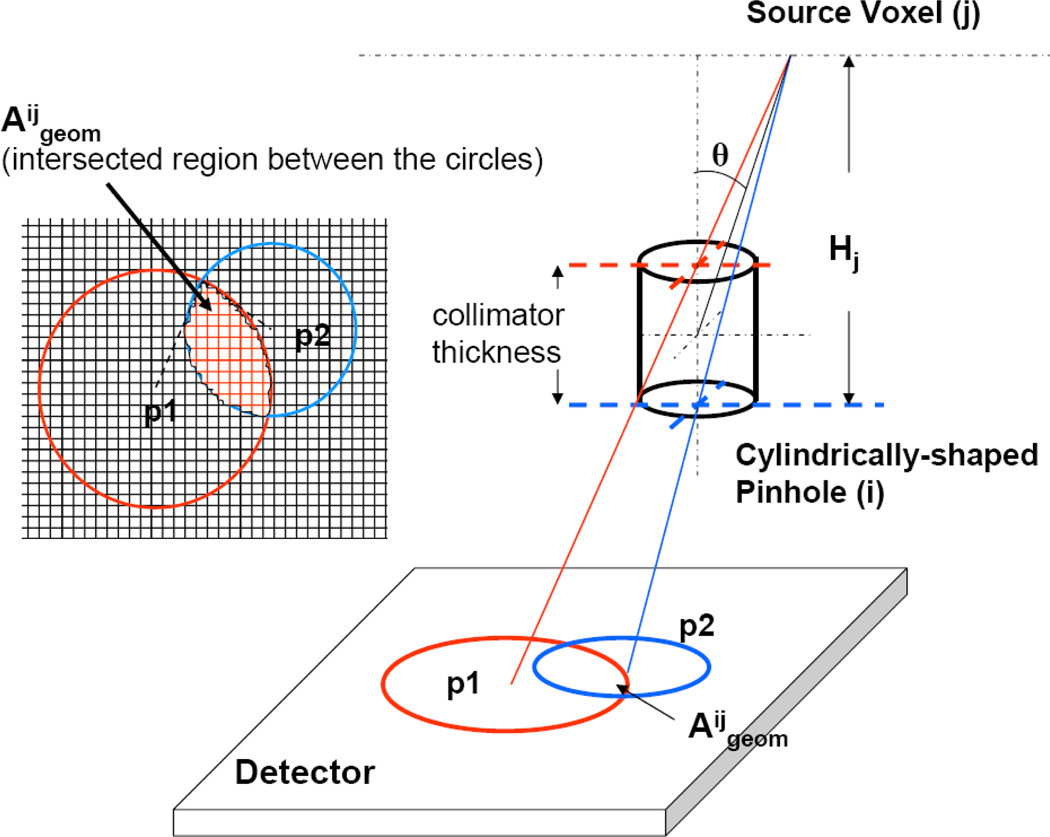
Image reconstruction was performed with an OS-EM (26) algorithm. At each iteration step, the projection data from only one of the four detectors was used, making a total of four subsets. The order of the subset started with the front detector of the first camera view, followed by the front detector of the second camera view, then the back detector of the first camera view and ended with the back detector of the second camera view. This provides a logical way to maximize the tomographic distance between successive subsets. The image reconstruction algorithm incorporates a geometric model of multi-pinhole collimators with cylindrically-shaped pinholes. Object attenuation, scatter and detector depth-of-interaction blurring were not included into the system model at the current stage. We previously derived (25) a new formulation for the geometric pinhole point response function, Ageom, which is no more given as a simple 2D circular support step function, thus taking the geometry of the pinhole more accurately into account (Figure 6). Using a voxel-based ray tracing method, Ageom was obtained using perimeters of the pinhole openings on the collimator front and back planes projected from the source voxel onto the detector surfaces, and the projection operation was performed sequentially through the detector pixel array within intersected area of these perimeters. The mouse brain phantom was reconstructed in 32 × 32 × 32 images with 0.325 × 0.325 × 0.325 mm3 voxel size. The hot-rod phantom was reconstructed in 64 × 64 × 64 images with 0.162 × 0.162 × 0.162 mm3 voxel size. We selected a smaller voxel size for the reconstruction of the hot-rod phantom because this phantom was used for resolution assessment with rod diameters between 180 and 750 µm.
Figure 6.
Illustration of the source-pinhole-detector geometry, geometric point response function and the projection operation for a cylindrically-shaped pinhole.
6. Quantification of multiplexing in stacked detector acquisition
For each camera head with two stacked detectors, one can calculate the ratio of multiplexed-object– sensitivity (Sensmultiplexed) to the total-object–sensitivity (Senstot). This process can be repeated for the other orthogonal camera head to obtain the mean ratio of multiplexed-object–sensitivity to the total-object– sensitivity for the entire imaging system. We performed the calculation of the multiplexed object sensitivity similar to the method described by Vunckx et al. (15). We extended this method by including a more detailed way of calculating object sensitivities. Senstot was defined as the sum of the geometric sensitivities from all voxel sources that construct the object. To make the computation easier, the sensitivity of a single voxel (j) was approximated by a point source at the center of that voxel. To compute its sensitivity, the point source is projected through an aperture i onto the detector.
In our notation, Aijgeom (figure 6) indicates the closed region on the detector that contributes to the geometric response of voxel j through aperture i and indicates the area of that region. Aijgeom is given as an intersection between the perimeters of the pinhole openings on the collimator’s front and back planes projected from the source point j onto the detector surface. A detailed description of Aijgeom can be found in our previous work (25). The sensitivity for each point source j through aperture i into K number of detector pixels is given by:
| (1) |
Hj is the perpendicular distance between the point source j and collimator (back) plane and θ is the angle between the pinhole axis and the line connecting the center of the pinhole to the source position. Index k indicates the detector element contributing to the area under the point response function. The sensitivity of an object through a single pinhole i is calculated by the weighted sum of the sensitivities of all the voxels J:
| (2) |
The activity weighting factor ωj of each voxel is defined as voxel activity divided by total object activity. The projection of the object through a single pinhole is an area constructed from the union of the point response functions of all voxels:
| (3) |
Collimators with I number of pinholes add to the total-object-sensitivity:
| (4) |
With multiplexing the activity originating from an object through a single pinhole is detected by some detector pixels that also detect the object though another pinhole. In contrast to the method described in (15) where each point source is projected through the center of each pinhole onto a single detector pixel, in our method the point source j is projected onto multiple detector pixels K. This modification incorporates the pinhole’s point response function into the quantitative formulation of multiplexing, which is particularly important at higher magnifications where is large enough to significantly contribute to and subsequently to the projection overlap defined as the intersection between Aigeom from different pinholes:
| (5) |
The multiplexed-object-sensitivity is defined by sensitivities that correspond to detector pixels within Amultiplexed:
| (6) |
In equation (6) PK comprises the detector pixels from the multiplexed projection area. The equations (4) and (6) give the object sensitivities, both total and multiplexed, viewed from one detector. The amount of multiplexing corresponding to the acquisition of an object with a set of multi-pinhole collimators and a detector was expressed with a scalar quantity Um defined by equation (7).
| (7) |
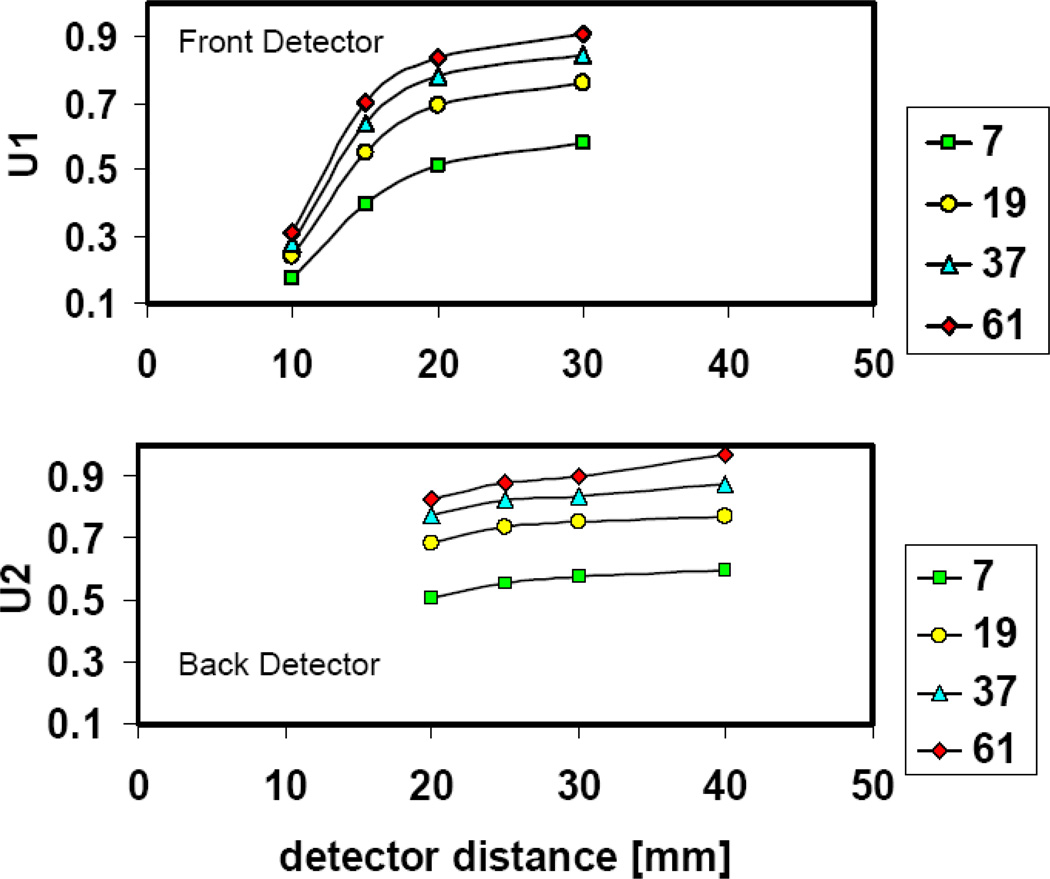
With synthetic collimation Um varies between the front and back detector. We used equation 7 to calculate the ratio of the multiplexed-object-sensitivity to the total-object-sensitivity for two detectors (U1, U2) on a single camera head (figure 4, left). Theoretically, one can repeat this calculation with the detectors on the second camera head to obtain the mean ratio of multiplexed-object–sensitivity to the total-object–sensitivity for the entire imaging system. This might be necessary for objects that are very asymmetric. However, for mouse brain, we just made the simplified assumption that the multiplexed object sensitivity is similar at the two orthogonal camera heads. Figure 7 represents the plot of U1 and U2 as a function of the front and back detector distances. The range of their values is between 0.28 (28%) and 0.92 (92%). Another interesting parameter is the total amount of multiplexing on both front and back detector, Ucamera, calculated by summing the sensitivities on both front and back detector in equation (7).
Figure 7.
Calculated multiplexed sensitivity of the mouse brain phantom on the front detector (top) and back detector (bottom) with different sets of multi-pinhole configurations (number of pinholes: 7, 19, 37 and 61) and varying detector distance (10–40 mm)
7. Methods of evaluation
Several methods were used to evaluate each configuration. With the mouse brain phantom we looked for the presence of artifacts in the reconstructed images and for the changes in the striatum contrast calculated by using the mean activities in the striatum region and in the reference region by using the phantom as a template to draw the regions of interest (ROI).
| (8) |
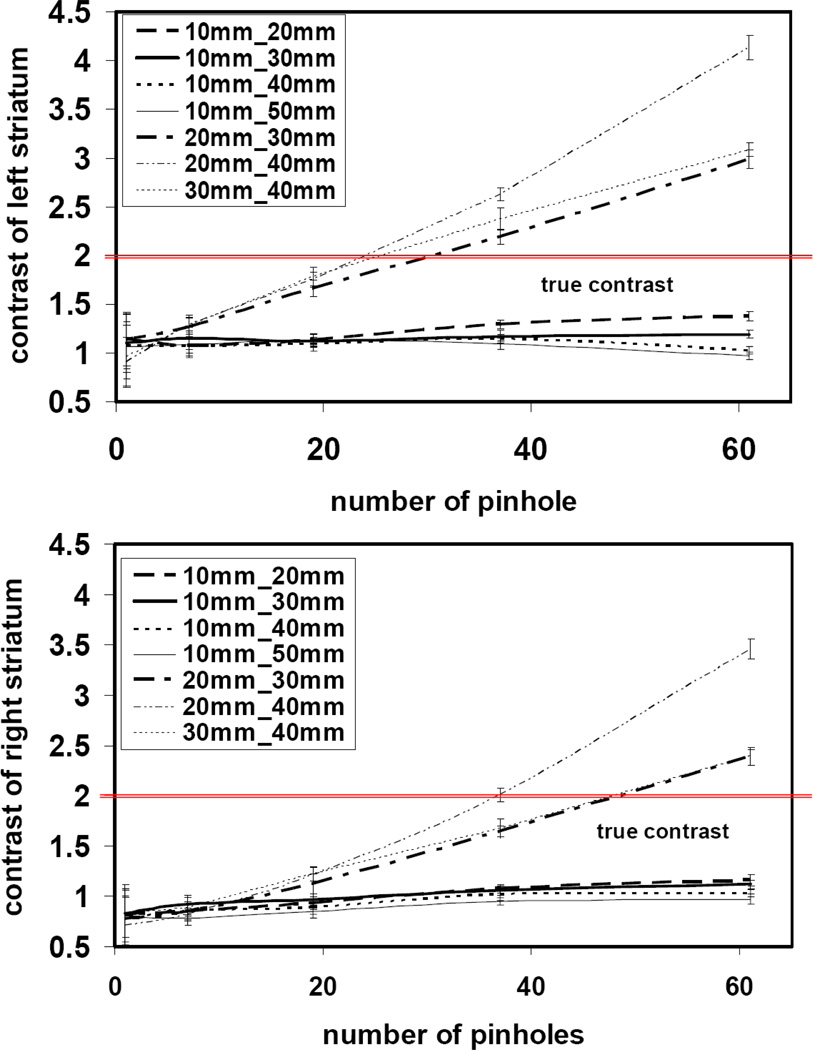
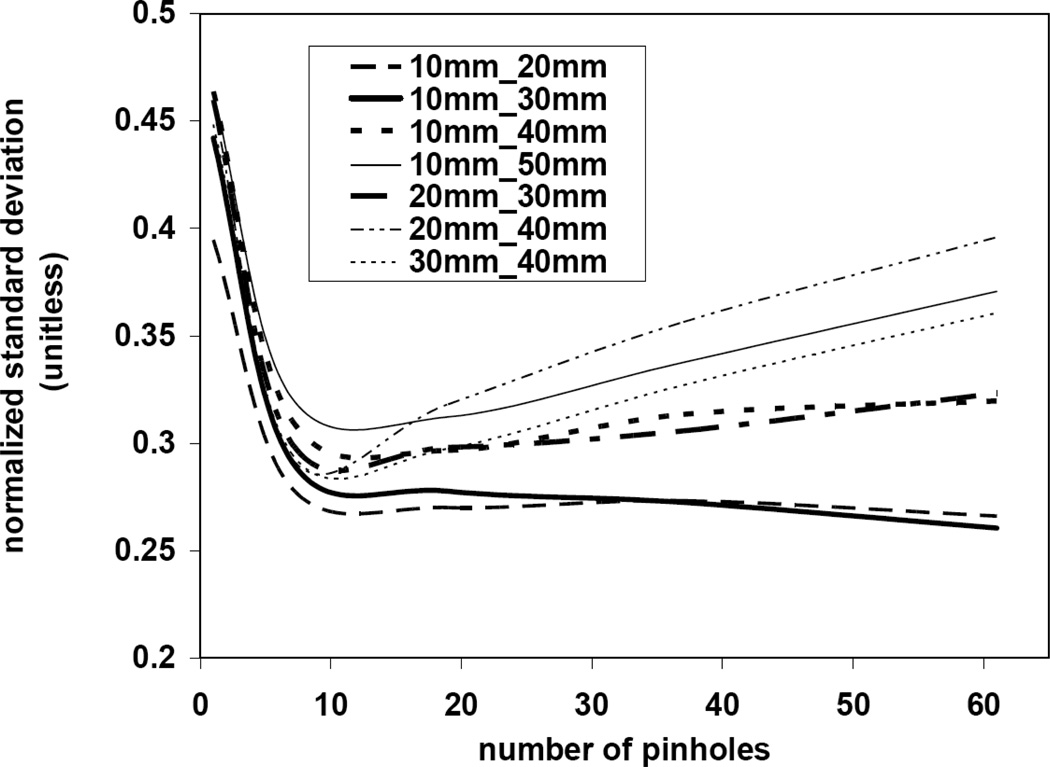
The contrast was calculated using an ensemble of 20 noise realizations for each configuration. We used the mean value of the contrast and its standard deviation across the ensemble to obtain figure 11. The true contrast of the phantom’s striatum is 2. We also looked for the standard deviation of the image voxels in the left striatum region at each configuration. Figure 12 represents the normalized standard deviation of the left striatum region as a function of pinhole numbers at different detector-collimator distances. We used 20 noise realizations to calculate the mean of the standard deviation across the ensemble.
Results
8. Multi-pinhole image reconstruction with synthetic collimation
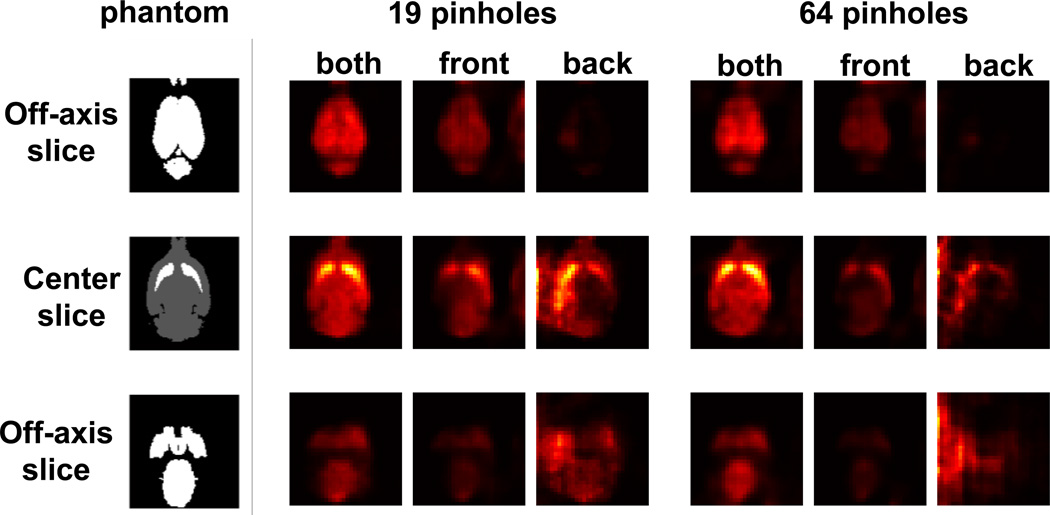
To show the significance of synthetic collimation, we reconstructed images of the mouse brain phantom with the two detector distances (10 mm for front detectors and 40 mm for back detectors) alone and jointly using 19 and 61 pinholes (Figure 8). As expected, multi-pinhole image reconstruction from singe magnification data (using only front or back detector projections) was severely degraded by artifacts, particularly with 61 pinholes. However, by joining the front and back detector projections in the reconstruction, these artifacts were removed.
Figure 8.
Three axial slices (1 center and 2 off-axis) of the mouse brain phantom reconstructed with 19 and 61 pinholes using both front and back detectors, front detectors only and back detectors only.
9. Optimization of synthetic collimation reconstruction
9.1 Digital mouse brain phantom
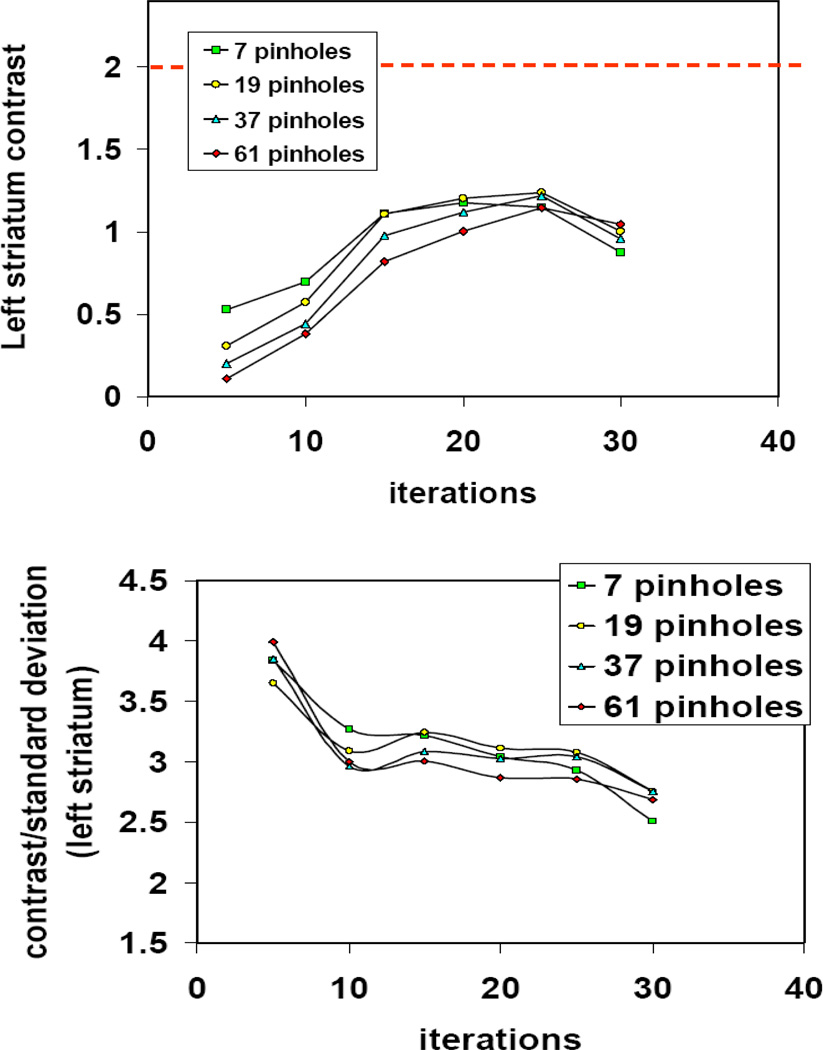
We used the dual-magnified image reconstruction of the mouse brain phantom in order to find the optimal geometry for stacked detector acquisition for imaging small objects such as mouse brain. The phantom images were reconstructed using OS-EM with 20 iterations. This choice of stopping point was based on a rough estimation of the changes in the contrast and (contrast/standard deviation) as a function of iterations (figure 9). The geometric configuration in figure 9 uses 10 mm distance for the front detector and 40 mm distance for the back detector and variable number of pinholes (7,19,37,61). For most configurations, we found that 20–25 iterations gave the most contrast enhancement.
Figure 9.
Changes in the striatum contrast (top) and contrast/standard deviation (bottom) of the mouse brain phantom for different number of pinholes as a function iterations in the OSEM image reconstruction. The geometric configuration in this figure uses 10 mm distance for the front detector and 40 mm distance for the back detector. The dotted line in the top figure indicates the true contrast.
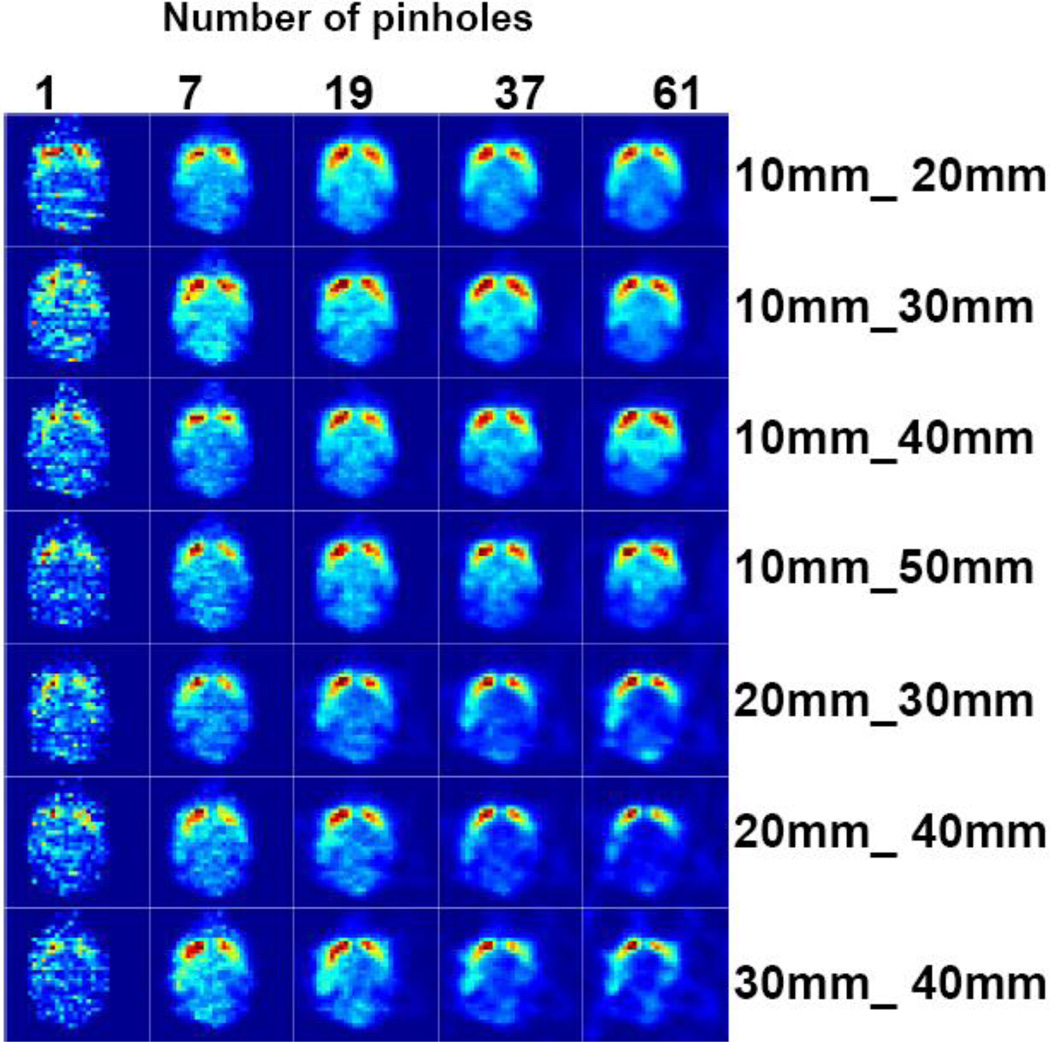
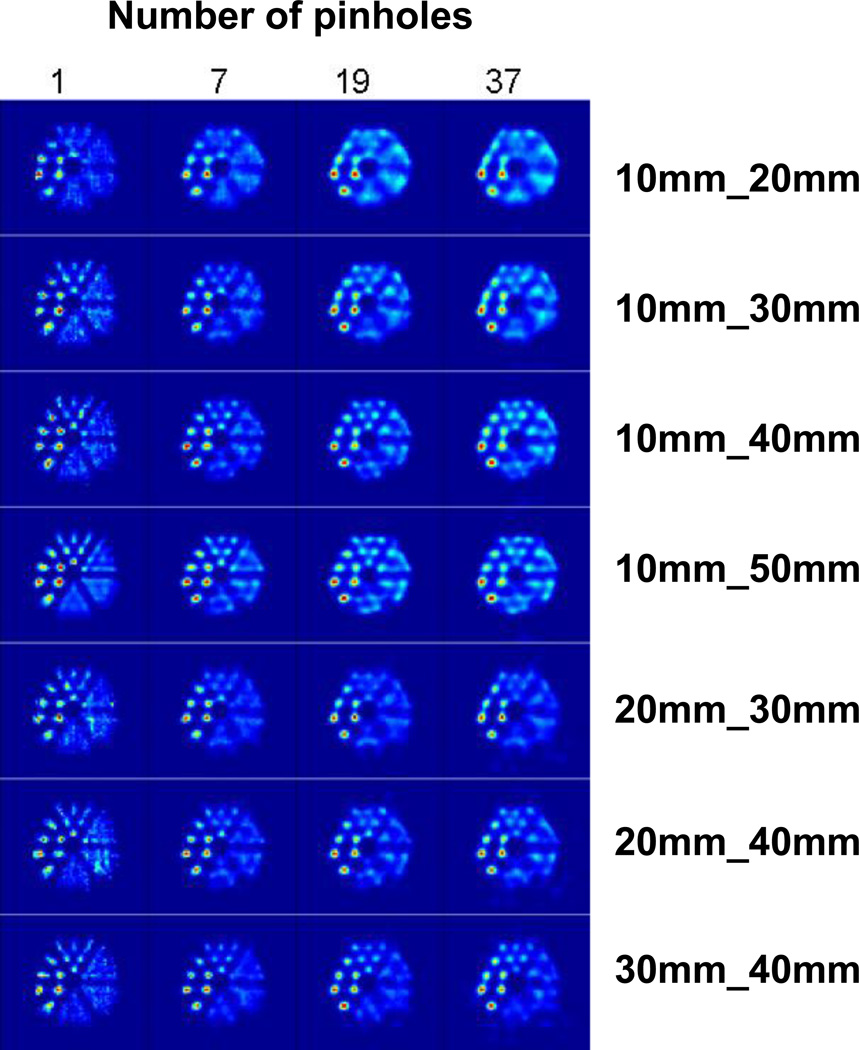
Figure 10 shows the image reconstruction results using different combinations of front and back detector magnifications (rows) and pinhole numbers (columns).Each image represents a single axial slice at the center of the object. The contrast of the activity between the striatum and rest of the brain was calculated using equation 8 and an ensemble of 20 noise realizations for each configuration. We observed for all combinations of front and back detector magnification an enhancement in the contrast despite the increasing number of pinholes (increasing Ucamera). However, significant artifacts were observed in the image at higher than 80% values of Ucamera. These appeared as activity hot spots outside of the object and cold spots in the object, creating lower activity values in the reference region and causing artificially high contrasts (Figure 11). We also observed a difference between the left and right striatum in the mean value of the contrasts. We speculate that this effect might be a result of the limited angular tomography making one part of the brain viewed at higher angular sampling than the other part. In some of geometric configurations we observed that increasing the number of pinholes reduced the offset between the left and right striatum because the object was viewed from a larger number of angles. The normalized mean of the standard deviation in left Striatum contrast was calculated and shown in Figure 12. Increasing the number of pinholes produced initially a rapid decrease in the standard deviation, however with diminishing returns after 37 pinholes for some configurations (10mm_20mm, 10mm_30mm) or even a slight increase in the others.
9.2 Hot-rod phantom
The hot rod phantom was used to evaluate changes in resolution using the same combination of detector distances (projection magnifications) as the mouse brain phantom. Figure 13 shows the reconstructed images of this phantom using smaller, 165 × 165 × 165 µm3 voxel size, for resolution evaluation. Although the selection of the small voxel size enables reconstruction of smaller structures, we found its implementation at higher number of pinholes and higher magnifications overly time-consuming and impractical. Therefore, for the reconstruction of the hot-rod phantom we limited the number of pinholes up to 37. The reconstruction time for the mouse brain phantom took 1.35 seconds per iteration per pinhole and increased linearly with the number of pinholes. The reconstruction time for the hot-rod phantom took 10.77 seconds per iteration per pinhole. While the larger rods (750 µm in diameter) were resolved in all combinations of number of pinholes and detector distances, the combination of 10 mm (front)-40 mm (back) detectors with 19 and 37 pinholes indicated the best trade-off between resolution performance and reconstruction time. With this configuration, we could clearly resolve 480 µm rods. Increasing the back detector distance to 50 mm did not significantly improve the resolution performance and just added to the reconstruction time.
Discussion
We saw that the implementation of synthetic collimation with dual-projection acquisition can result in successful image reconstruction from multiplexed multi-pinhole projections with a stationary, dual-headed camera system. We defined a new formulation to quantify the multiplexed object sensitivity, and to see how this changes at different acquisition parameters such as the pinhole numbers and detector distances. We investigated different combinations of these parameters to see their impact on the image reconstruction of a digital mouse brain phantom and a hot-rod phantom. The mouse brain phantom had an activity ratio of 3-to-1 between striatum and the rest of the brain. Overall, the configuration with 37 pinhole, 10 mm for front detector distance and 40 mm for back detector distance gave the best trade off between quantitative accuracy (figure 11) and image noise (figure 12) in the reconstruction of the mouse brain phantom as well as resolution (figure 13) from the hot brain phantom. Higher detector magnifications and number of pinholes did not enhance the image reconstruction. In particular the combination of 61 pinholes with front detector distances at 20–30 mm and back detector distances at 30–40 mm created image artifacts that appeared as hot spots outside of the brain and cold spots within the mouse brain, creating lower activity values in the reference region and causing artificially high contrasts. The artifacts were most significant when using 61 pinholes and both detectors at high magnifications. This indicates that the multiplexing of the projections is the main source of artifacts. Referring to the original paper on synthetic collimation by Wilson et al. (22), the central idea of synthetic collimation is to collect multi-pinhole projection data using a number of collimator-detector distances. Since the amount of projection overlap varies as a function of this distance, the data contains information on how the projections are multiplexed and how to remove the multiplexing effect. This is similar to the method introduced by Mahmood et al. where mixed multiplexed and non-multiplexed data were used to improve the image reconstruction (18). However, with both detectors at high magnifications combined with larger number of pinholes, the variation of multiplexing between the front and back detector is small (see figure 7). This hinders an efficient implementation of synthetic collimation in removing the multiplexing effect.
In all configurations, the contrast of the left striatum is slightly higher than the right striatum (figure 12). This left-right bias in the quantitative results remains one of our concerns. Considering both orthogonal projection geometries, one side of the brain is sampled at a closer distance than the other side (figure 4). This might explain the left-right bias in the striatum contrast as a consequence of limited angle tomography. For the future studies, we will investigate ways to solve this problem, such as rotating/shifting the camera positions with respect to the object or add an additional camera head to obtain more symmetric acquisition geometries.
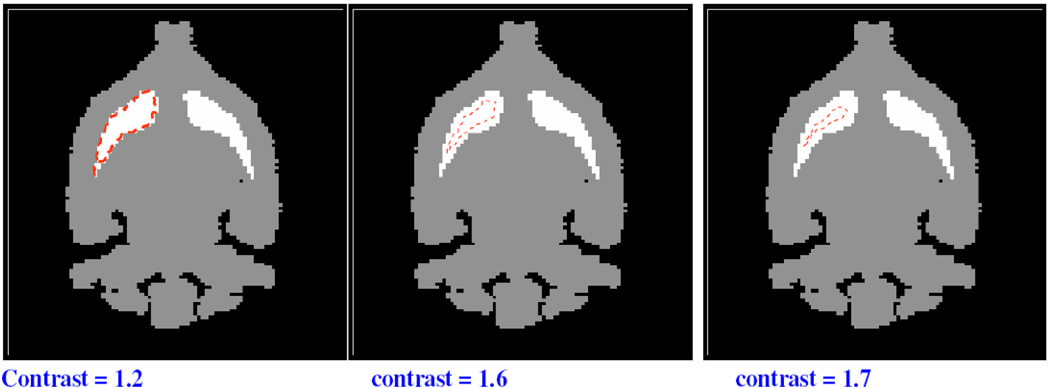
Overall, the measured contrast is widely varying versus the pinhole number in configurations where the projection image is highly magnified and multiplexed at both detectors (20–30, 20–40, 30–40). As indicated previously, the reconstructed images of these configurations have also severe artifacts, which appeared as activity hot spots outside of the object and cold spots in the object, creating lower activity values in the reference region and causing artificially high contrasts. Configurations with lower projection multiplexing (10–20, 10–30) or those with significant difference in the projection magnification between the front and back detectors (10–40, 10–50) have more consistent quantitative results. However, they also indicate a consistently lower contrast than the actual true value. The ROIs used for the contrast measurement were based on the true anatomical size of the striata (full striata ROI) in the phantom (figure 3). This makes the contrast results susceptible to the partial volume effect. In particular the difference between the measured contrast values at approximately 1.0 and 1.2 and the true contrast at 2.0 might raise the question of whether this difference is acceptable for research studies with mice that require both sub-mm resolution to resolve brain regions and high quantitative accuracy. In figure 14, we have shown that by reducing the size of the ROI, the partial volume effects can be reduced and higher values for the contrast can be achieved. However, the main purpose of this study was to compare different collimator configurations relative to each other using the same phantom and the same ROI for all pinhole configurations. We selected the full striata ROI because it is more sensitive to changes in the resolution performance among different pinhole configurations. In a quantitative mouse imaging study choosing a smaller ROI might be more appropriate, but the particular imaging task, taking into account such factors as the tracer characteristics, will help determine the appropriate ROI size for the best tradeoff between quantitative accuracy and statistical noise.
In our future studies we will investigate the quantitative accuracy of synthetic collimation more thoroughly. In particular, we are interested in the quantitative accuracy for larger objects with regions that are located off-center of the field of view. One way to do this is to acquire projections at several angular views (simulating multiple camera heads) and to compare the reconstructed images obtained from synthetic collimation with those obtained with conventional image reconstruction by using either front or back detectors alone, and to observe how the quantitative accuracy changes with the increased angular views (increased number of camera heads).
The image reconstruction of the hot-rod phantom also showed best resolution performance with the combination of 10 mm (front)-40 mm (back) detectors with 37 pinholes. This could indicate that the front detector at low magnification should be used to compensate highly multiplexed projections on back detectors. In return, the back detectors at high magnification can enhance the resolution of the reconstructed image. We saw that increasing the number of pinholes can, to some extent, improve the image reconstruction. However, the incorporation of more than 37 pinholes did not significantly enhance the image resolution of the hot-rod phantom. In fact, at high projection magnification, image reconstruction with 61 pinholes produced again severe artifacts.
Overall, the results of both phantom studies indicated that the combination of front detectors at 10 mm distance, back detectors at 40 mm distance and 37 pinholes might be a good selection for our future imaging acquisition of small volumes such as mouse brain with this imaging system. Comparing to most other imaging systems, these collimator-detector distances are quite short. Therefore, it is encouraging to know that longer focal lengths do not necessarily enhance the system performance of SiliSPECT. This could be a main advantage of using detectors with ultra-high resolution due to their capability of acquiring pinhole projections at short detector-collimator distances because less projection magnification is necessary to achieve high resolution.
Our optimization study is focused on 125I imaging of small objects, such as mouse brain, using SiliSPECT, which is limited to lower energy photons. Theoretically, it is possible to use the synthetic collimation with higher energy photons from isotopes that are more commonly used in SPECT, such as 123I and 99mTc. However, its practical implementation with simultaneous stacked detector acquisition requires modifications in the detector design for this particular type of acquisition. One possible option is combining other, high-resolution semi-conductive detectors that are more suitable for imaging at higher energies. Other system parameters, such as the detector distances and collimator design, should be optimized for the sensitivity and resolution that is required for the specific imaging task. One important consideration in higher energy imaging is the pinhole penetration effect, which will add to the projection overlap. This could be addressed by changing the collimator design, such as increasing the distance between the pinholes, which would subsequently decrease the collimator sensitivity as well.
Conclusion
The main objective of this study was to investigate the impact of detector-collimator distances on image reconstruction with synthetic collimation. We also defined a new formulation for projection overlap in stacked detector acquisition, and investigated how the overlap changes as a function of detector-collimator distances and how this impacts the image reconstruction for objects as small as mouse brain. There are definitely a number of optimization aspects regarding the image reconstruction itself that remain to be explored. Among these is the selection of the subsets. Our approach in selecting subsets provides a simple and logical way to maximize the tomographic distance between successive subsets. However, in our future work we are highly interested in investigating other combinations of subsets and possibly other image reconstruction methods and parameters.
Figure 10.
Center axial slice of the mouse brain phantom reconstructed with different combinations of front and back detector distances to the collimator (10mm_20mm, 10mm_30mm, 10mm_40mm, 10mm_50mm, 20mm_30mm, 20mm_40mm, 30mm_40mm) and number of pinholes (1, 7, 19, 37, 61). The geometry for the acquisition is illustrated in figure 4 (top). The left side of the brain is sampled at a closer distance to the collimator.
Figure 11.
Mean contrast of the left (top figure) and right (bottom figure) striatum of the mouse brain phantom. Images were reconstructed with variable combinations of front and back detector distances and number of pinholes. For each geometric configuration, an ensemble of 20 noisy projection data was generated and reconstructed. The error bars represent the standard deviation of the contrast across this ensemble. The horizontal lines indicate the true contrast at 2. The true anatomical size of the striata (figure 3) was used for the contrast measurements. The underestimates of the contrast seen in configurations (10–20, 10–30, 10–40, 10–50) are primarily attributed to partial volume effects, while the overestimates arise from artifacts related to the projection multiplexing in configurations with high magnification on both detectors and higher numbers of pinholes.
Figure 12.
normalized mean of the standard deviation in left Striatum contrast of the mouse brain phantom. Images were reconstructed with variable front and back detector distances and different number of pinholes. For each geometric configuration an ensemble of 20 noisy projection data was generated to calculate the mean of the standard deviation across the ensemble.
Figure 13.
Center axial slice of the hot-rod phantom reconstructed with different combinations of front and back detector distances to the collimator (10mm_20mm, 10mm_30mm, 10mm_40mm, 10mm_50mm, 20mm_30mm, 20mm_40mm, 30mm_40mm) and number of pinholes (1, 7, 19, 37). The geometry for the acquisition is illustrated in figure 4 (bottom).
Figure 14.
Illustration of the ROI size reduction and the subsequent improvement of the image contrast. The contrast was measured for a reconstructed image obtained with 37 pinholes, 10 mm distance between the front detector and the collimator and 40 mm distance between the back detector and the collimator.
Acknowledgment
This work was supported by NIH/NIBIB R33 EB000776, NIH Grant P41 EB002035, a Career Award at the Scientific Interface (TEP) from the Burroughs Wellcome Fund and the 2008 SNM Postdoctoral Molecular Imaging Scholar Program award (S.Sh). The authors would like to thank Dr. Howard Jacobowitz, Department of Mathematical Sciences, Rutgers University for the mathematical notation of equation 6.
References
- 1.Jaszczak RJ, Li J, Wang H, Zalutsky MR, Coleman RE. Pinhole collimation for ultra-high-resolution small-field-of-view SPECT. Phys Med Biol. 1994;39:425–437. doi: 10.1088/0031-9155/39/3/010. [DOI] [PubMed] [Google Scholar]
- 2.Moore RH, Ohtani H, Khaw BA, Strauss HW. High resolution pinhole sequence imaging of small laboratory animals. Cancer. 1991;32:987–987. [Google Scholar]
- 3.Beekman FJ, van der Have F, Vastenhouw B, Van der Linden AJA, van Rijk PP, Burbach JPH, Smidt MP. U-SPECT-I: a novel System for submillimeter-resolution tomography with radiolabeled molecules in mice. J Nucl Med. 2005;46:1194–1200. [PubMed] [Google Scholar]
- 4.Furenlid LR, Wilson DW, Chen Y, Kim H, Pietraski PJ, Crawford MJ, Barrett HH. FastSPECT II: a second-generation high-resolution dynamic SPECT imager. IEEE Trans. Nucl. Sci. 2004;51:631–635. doi: 10.1109/TNS.2004.830975. [DOI] [PMC free article] [PubMed] [Google Scholar]
- 5.Ishizu K, et al. Ultra-high resolution SPECT system using four pinhole collimators for small animal studies. J. Nucl. Med. 1995;36:2282–2287. [PubMed] [Google Scholar]
- 6.Ogawa K, Kawade T, Nakamura K, Kubo A, Ichihara T. Ultra high resolution pinhole SPECT for small animal study. IEEE Trans. Nucl. Sci. 1998;45:3122–3126. [Google Scholar]
- 7.Strand SE, Ivanovic M, Erlandsson K, Franceschi D, Button T, Sjōgren K, Weber DA. Small animal imaging with pinhole single-photon emission computed tomography. Cancer. 1994;73:981–984. doi: 10.1002/1097-0142(19940201)73:3+<981::aid-cncr2820731334>3.0.co;2-n. [DOI] [PubMed] [Google Scholar]
- 8.Meng LJ, Clinthorne NH, Skinner S, Hay RV, Gross M. Design and feasibility study of a single photon emission microscope system for small animal I-125 imaging. IEEE Trans. Nucl. Sci. 2006;53:1168–1178. doi: 10.1109/TNS.2006.871405. [DOI] [PMC free article] [PubMed] [Google Scholar]
- 9.Weisenberger AG, Kross B, Majewski S, Popov V, Smith MF, Tran VH, Welch B, Baba J, Goddard J, Pomper M, Tsui B. Instrumentation development of a SPECT-CT system to image awake mice. IEEE Nuclear Science Symposium Conference Record. 2006;5:3000–3003. [Google Scholar]
- 10.Rentmeester MCM, van der Have F, Beekman FJ. Optimizing multi-pinhole SPECT geometries using an analytical model. Phys. Med. Biol. 2007;52:2567–2581. doi: 10.1088/0031-9155/52/9/016. [DOI] [PubMed] [Google Scholar]
- 11.Beekman FJ, Vastenhouw B. Design and simulation of a high-resolution stationary SPECT system for small animals. Phys. Med. Biol. 2004;49:4579–4592. doi: 10.1088/0031-9155/49/19/009. [DOI] [PubMed] [Google Scholar]
- 12.Meikle SR, Kench P, Kassiou M, Banati RB. Small animal SPECT and its place in the matrix of molecular imaging technologies. Phys Med. Biol. 2005;50:R45–R61. doi: 10.1088/0031-9155/50/22/R01. [DOI] [PubMed] [Google Scholar]
- 13.Mok SP, Wang Y, Tsui BMW. Design of a novel pinhole collimator system for SPECT imaging of small animals with different sizes. IEEE Nuclear Science Symposium Conference Record. 2005;5:2649–2652. [Google Scholar]
- 14.Cao Z, Bal G, Accorsi R, Acton PD. Optimal number of pinholes in multi-pinhole SPECT for mouse brain imaging--a simulation study. Phys. Med. Biol. 2005;50:4609–4624. doi: 10.1088/0031-9155/50/19/013. [DOI] [PubMed] [Google Scholar]
- 15.Vunckx K, Suetens P, Nuyts J. Effect of overlapping projections on reconstruction image quality in multipinhole SPECT. IEEE Tran. Med. Imaging. 2008;27:972–983. doi: 10.1109/TMI.2008.922700. [DOI] [PubMed] [Google Scholar]
- 16.Schramm NU, Ebel G, Engeland U, Schurrat T, Behe M, Behr TM. High-resolution SPECT using multipinhole collimation. IEEE Trans Nucl Sci. 2003;50:315–320. [Google Scholar]
- 17.Min BJ, Choi Y, Lee N-Y, Lee K, Ahn YB, Joung J. Design consideration of a multi-pinhole collimator with septa for ultra high-resolution silicon drift detector modules. Nucl. Instruments and Methods in Physics Research A. 2009;606:755–761. [Google Scholar]
- 18.Mahmood ST, Erlandsson K, Cullum L, Hutton BF. The potential for mixed multiplexed and non-multiplexed data to improve the reconstruction quality of a multi-slit-slat collimator SPECT system. Phys. Med. Biol. 2010;55:2247–2268. doi: 10.1088/0031-9155/55/8/009. [DOI] [PubMed] [Google Scholar]
- 19.Accorsi R, et al. MediSPECT: single photon emission computed tomography system for small field of view small animal imaging based on a CdTe hybrid pixel detector. Nucl. Instruments and Methods in Physics Research A. 2007;571:44–47. [Google Scholar]
- 20.Garibaldi F, et al. Small animal imaging by single photon emission using pinhole and coded aperture collimation. IEEE Trans Nucl Sci. 2005;52:573–579. [Google Scholar]
- 21.Meikle SR, Kench P, Weisenberger AG, Wojcik R, Smith MF, Majewski S, Eberl S, Fulton RR, Rosenfeld AB, Fullham MJ. A prototype coded aperture detector for small animal SPECT. IEEE Trans Nucl Sci. 2002;49:2167–2171. [Google Scholar]
- 22.Wilson DW, Barrett HH, Clarkson EW. Reconstruction of two- and three-dimensional images from synthetic-collimator data. IEEE Trans. Med. Imag. 2000;19:412–422. doi: 10.1109/42.870252. [DOI] [PubMed] [Google Scholar]
- 23.Peterson TE, Shokouhi S, Furenlid LR, Wilson DW. Multi-pinhole SPECT imaging with silicon strip detectors. IEEE Trans. Nucl. Sci. 2009;56:646–652. doi: 10.1109/TNS.2009.2012514. [DOI] [PMC free article] [PubMed] [Google Scholar]
- 24.Shokouhi S, McDonald BS, Durko HL, Fritz MA, Furenlid LR, Peterson TE. Thick silicon double-sided strip detectors for low-energy small-animal SPECT. IEEE Trans. Nucl. Sci. 2009;56:557–564. doi: 10.1109/TNS.2009.2019106. [DOI] [PMC free article] [PubMed] [Google Scholar]
- 25.Shokouhi S, Metzler SD, Wilson DW, Peterson TE. Multi-pinhole collimator design for small-object imaging with SiliSPECT: a high-resolution SPECT. Phys. Med. biol. 2009;54:207–225. doi: 10.1088/0031-9155/54/2/003. [DOI] [PMC free article] [PubMed] [Google Scholar]
- 26.Hudson HM, Larkin RS. Accelerated image reconstruction using ordered subsets of projection data. IEEE Trans. Med. Imag. 1994;13:601–609. doi: 10.1109/42.363108. [DOI] [PubMed] [Google Scholar]
- 27.Metzler SD, Bowsher JE, Smith MF, Jaszczak RJ. Analytic determination of pinhole collimator sensitivity with penetration. IEEE Trans. Med. Imag. 2001;20:730–741. doi: 10.1109/42.938241. [DOI] [PubMed] [Google Scholar]


