Abstract
Rationale
We have employed nasal challenge with lipopolysaccharide (LPS) followed by nasal lavage (NL) to experimentally induce and examine upper airway inflammation in human volunteers. It is unclear however whether adaptation within individuals occurs following repeated nasal challenge. This was a pilot study to determine if repeated nasal LPS challenge yields attenuation of markers of inflammation (primarily neutrophil response) in the NL fluid of healthy humans.
Methods
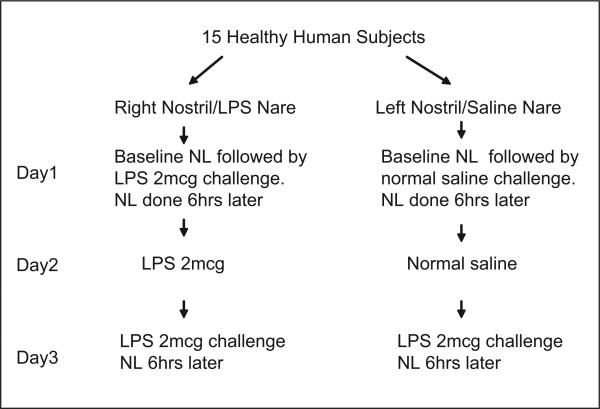
We employed a 3-day nasal LPS challenge protocol with NL using a “split nose” design. The control and LPS nares received two consecutive day saline (0.9% saline/day) and LPS (2 μg LPS/day) challenges, respectively followed by an LPS (2 μg/day) challenge to each nare on Day 3. NL was performed immediately pre Day 1 challenges and 6-h post nasal LPS challenges on both Days 1 and 3. Markers of inflammation (PMNs/mg, cytokines) were assessed in NL and the inflammatory response to LPS (measured as the difference between pre and post challenge) was evaluated in both nares on Day 3 and compared to Day 1.
Results
Significant (p < 0.05) blunting of the LPS-induced polymorphonuclear leukocyte (PMN) response was observed in the nare that received repeated LPS challenges as compared to the control nare (67.60 ± 22.39 vs. 157.8 ± 76.04 PMN/mg) and initial LPS challenge on Day 1 (121 ± 32 PMN/mg). Decreased soluble CD14 and significantly decreased interleukin-8 were also found in the repeat LPS-treated nare. In the LPS-treated nare, the blunted PMN response on Day 3 correlated well with the observed PMN response on Day1 (r = 0.58, p = 0.02).
Conclusions
We show attenuation of PMN response to repeated LPS in the nasal airways in healthy humans. Effect of repeat endotoxin exposure prior to allergen delivery on local airway inflammation in both healthy and atopic subjects can be studied.
Keywords: Airway inflammation; neutrophils; adaptation; lipopolysaccharide (LPS, endotoxin)
Introduction
Endotoxin is a constituent of outer layer of Gram-negative bacteria. Lipopolysaccharide (LPS) is the main component of endotoxin and is formed by the phosphogylcolipid A that is covalently linked to hydrophilic hetero-polysaccharide and is responsible for its toxicity (Rietschel et al., 1994). Endotoxin is found in various concentrations in house dust and certain occupational settings like livestock, lab animals, grain and vegetable agriculture, saw and cotton mills, waste management, fiberglass manufacturing and “sick buildings.” LPS that is bound to LPS binding protein ligates the TLR4-CD14-MD2 complex on macrophages and antigen-presenting cells, resulting in production of pro-inflammatory cytokines tumor necrosis factor-α (TNF-α), interleukin-6 (IL-6), IL-8, IL-12 and interferon-γ (IFN-γ), as well as increased neutrophilic inflammation.
The spectrum of illnesses reported to be induced by endotoxin exposure include “Monday Asthma” of cotton workers (Schneiter et al., 1942), humidifier fever (Mamolen et al., 1993; Rylander and Haglind 1984), grain fever(Schwartz et al., 1995) toxic pneumonitis (Rylander and Malmberg 1992), and acute systemic effects like malaise or fever (Milton et al., 1995) to acute high level exposure. Repeated exposure causes chronic obstructive lung disease without the acute effects (Christiani et al., 1993) and chronic exposure to low-level concentrations can cause development of obstructive lung disease including emphysema, chronic bronchitis and asthma (Niven et al., 1997; Pal et al., 1997; Sigsgaard et al., 1992; Simpson et al., 1998). All these imply that increasing inflammation results from continued exposure to endotoxin. On the other hand, there are increasing reports from cohort studies in farming communities from Europe of lower incidence of atopy with increasing exposures of LPS (Doreswamy and Peden, 2011). Children from farming households had about 30–50% lower incidence of hay fever, hay fever symptoms in the past year and atopic sensitization. (Braun-Fahrländer et al., 2002). Interestingly, production of IFN-γ, TNF-α, IL-12, IL-10 all decreased with increasing endotoxin exposures implying long-term high level LPS exposure could result in hyporesponsiveness.
Endotoxin tolerance is defined as reduced responsiveness to LPS challenge following a prior encounter with LPS/endotoxin. Various terminologies are used to describe this and include attenuation, adaptation, hyporesponsiveness, desensitization, immunoparalysis or reprogramming (Fan and Cook 2004). The phenomenon and mechanisms of endotoxin tolerance has been well established in animal and in vitro human models (Biswas and Lopez-Collazo 2009; Cavaillon et al., 2003; West and Heagy 2002). Draisma et al., recently explored the effect of repeat systemic administration of low-dose LPS in humans and showed attenuation in response (Draisma et al., 2009). To our knowledge, experimental studies examining the impact of repeated in vivo LPS exposure to the human airways have not been undertaken. We were interested to see the effect of giving LPS repeatedly into nasal airways of healthy subjects. Our primary endpoint was the change in neutrophil (PMN) numbers obtained from nasal lavage (NL). We looked at secondary endpoints including selected cytokines and soluble CD14 (sCD14). We show attenuation of PMN response in the nostril that received three daily doses of LPS as compared to Day 1 on same side and the contra-lateral nostril which received LPS only on Day 3.
Methods
Study protocol
“Split nose” design with NL
This was a pilot study to assess the nasal PMN response to LPS following repeated nasal exposure to LPS. The “split nose” design and NL procedure have been described previously (Eldridge and Peden 2000a; Peden et al., 1995; Peden 1996). Figure 1 shows the study design. A low dose of LPS (2 μg E. Coli #L-2262, Sigma, Inc., St. Louis, MO) was applied to the same nare on two consecutive days, then again (2 μg) on the third day (Day 3). At the same time, saline (0.9%) was applied to the contra-lateral nare for two consecutive days, then LPS (2 μg) on Day 3. Baseline NL was performed on Day 1 followed immediately by LPS/saline challenge. NL was performed 6 h following the challenges on Days 1 and 3. No NL was performed following challenges on Day 2.
Figure 1.
Study design.
Subjects
Fifteen (N = 15) healthy, non-allergic subjects between the ages of 18 and 50 were recruited for the study. Informed consent was obtained prior to subject participation. The study was approved by the Committee on the Protection of the Rights of Human Subjects, School of Medicine, and The University of North Carolina, Chapel Hill. Subjects were non-smoking (for at least 1 year) males or females that were in good health and free from any upper respiratory tract illness for at least 6 weeks prior to study.
NL was performed as follows: 4 ml of normal saline were sprayed into the nares using a table top nebulizer (DeVilbiss UltraNeb 99, Sunrise Medical) that delivered 100 μl/actuation. Each lavage consisted of eight sets of five sprays. The lavage fluid was recovered by forceful expulsion into a specimen cup immediately following each set of five actuations. The samples were then transported to the laboratory on ice and processed immediately.
Cell count and soluble mediators recovered in NL fluid
The NL fluid was weighed and treated with a volume 0.1% dithiothreitol (Sputalysin 10%, Calbiochem Corp., San Diego, CA) equal to two times the weight (mg) followed by the addition of an equal volume of Dulbecco's phosphate buffered saline. The cell suspension was filtered through a 70 μm nylon filter (Falcon cell strainer #2350, Becton Dickinson Labware, Franklin Lakes, NJ) and the resulting suspension used for total cell count (TCC) and cell viability (Trypan Blue exclusion staining). Cytospins were prepared (Shandon III with a modified Wright's-Giemsa stain (Hema 3, Biochemical Sciences Inc., Swedesboro, NJ) for differential leukocyte cell counts. The remaining cell suspension was centrifuged and the supernatant aspirated and stored at −80°C for later assay.
Supernatant concentrations of IL-8, IL-6, IL-10, IL-1β, sCD14 and Granulocyte-macrophage–colony-stimulating factor (GM-CSF), were determined using commercially available enzyme-linked immunosor-bent assay (ELISA) kits (Endogen Inc., Woburn, MA; Bioxytech, Oxis International Inc., Portland, OR; R&D Systems, Minneapolis, MN). The cell viability was >50% on all samples. The limits of detection for IL-8, GM-CSF and sCD14 were 2.0 pg/ml, 2.0 pg/ml and 125 pg/ml, respectively. The limits of detection for IL-6, IL-10 and IL-1β were between 1 and 10 pg/ml. Eosinophil cationic protein concentrations were determined with a sensitive radioimmunoassay (RIA, Kabi Pharmacia Diagnostics AB, Uppsala, Sweden) with a minimum detection limit of 2.0 μg/l.
Statistical methods
Data represents values from all 15 subjects unless specifically noted. Paired t-tests were used to analyze differences between LPS and saline treatments. Results were expressed as the mean ± SEM. For hypothesis testing, log transformation was applied to the PMN data to ensure a normal distribution of the data. PMN response is defined as difference between baseline-adjusted PMN levels following Day 1 and Day 3 LPS challenges, i.e., pre-challenge numbers were subtracted from numbers obtained after each of the challenges for each individual subject. Differences between variables were considered statistically significant at p < 0.05.
Results
Characterization of subjects
All subjects tolerated the repeat LPS challenges without symptoms. Three of the fifteen subjects were nonresponders. Subject characteristics and baseline lung function are presented in Table 1.
Table 1.
Subject characteristics and baseline lung function.
| Age (yrs) | Gender (M/F) | Race | Height (cm) | Weight (kg) | FVC % pred. | FEV1 % pred. | |
|---|---|---|---|---|---|---|---|
| Mean (N = 15) | 29.4 | 7 M 8 F | 7 C 7 AA 1 A | 172.0 | 71.7 | 100.0 | 96.0 |
| SEM | 2.4 | 3.8 | 3.1 | 4.0 | 4.0 | ||
| Range | 21–46 | 152–195 | 50–93 | 83–122 | 82–128 |
C, Caucasian; AA, African American; A, Asian; SEM, standard error of the mean; FVC, forced vital capacity; FEV1, forced expiratory volume in 1 s; % pred., % predicted.
Total and differential cell counts recovered in NL fluid on Day 1
Table 2 shows total and differential cell counts (mean ± SEM) pre- and post-LPS/saline challenges. Significantly higher (TCC/mg) and absolute PMNs (cells/mg) were observed following LPS (2 μg) vs. saline (0.9%) challenge (p < 0.05). Compared to pre-challenge, there were significantly (p < 0.05) higher PMNs in the LPS nare, but not the saline nare.
Table 2.
Absolute total and differential cell counts in nasal lavage mean (±SEM), n = 15 unless specifically noted.
| Cell variable | PreD1 saline nare | PreD1 LPS nare | PostD1 saline nare | PostD1 LPS nare | PostD3 saline nare | PostD3 LPS nare |
|---|---|---|---|---|---|---|
| TCC/mg | 70 (18) | 231 (150) | 72 (21)+ | 201 (43)+ | 213 (83) | 147 (35) |
| PMN/mg | 18 (12) | 15 (8)# | 37 (15)* | 136 (38)*,# | 175 (79) | 82 (23) |
| Mac/mg | 26 (9) n = 9 | 10 (4) n = 8 | 7 (4) n = 5 | 11 (5) n = 8 | 5 (2) n = 7 | 14 (6) n = 8 |
TCC/mg, total cell counts per mg sputum; PMN/mg, polymorphonuclear neutrophils per mg sputum; Mac/mg, macrophage per mg sputum.
Significantly higher PMN in LPS nare compared with saline nare after Day 1 challenge (p = 0.001).
Significantly higher PMN in LPS nare after Day 1 challenge compared with baseline same nare (p = 0.002).
Significantly higher TCC in LPS nare compared with saline nare after Day1 challenge (p < 0.05).
PMN levels following LPS/saline challenge on Day 1
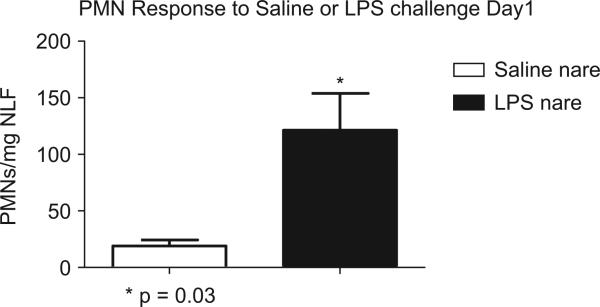
Figure 2 shows that a significantly increased number of PMNs were recovered in NL following LPS (dark bar) vs. saline (open bar) challenge (p < 0.05).
Figure 2.
Significant increased PMN response after LPS challenge on Day 1.
PMN Response Following LPS Challenge on Day 3
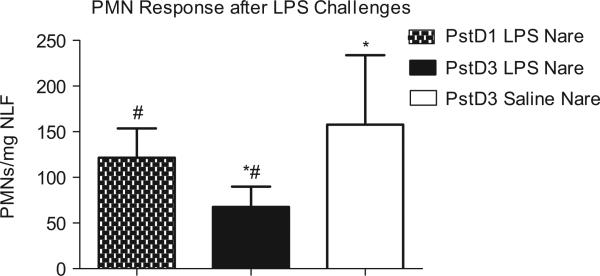
In Figure 3, the nare that received repeated LPS challenge (dark bar), the PMN response was significantly reduced by 57% (p = 0.03) compared to the nare that received repeated saline challenge (open bar). Compared to the LPS-induced PMN response on Day 1 (spotted bar), the PMN response on Day 3 in the LPS pre-treated nare was reduced by 44% (p = 0.05). In contrast, the PMN response on Day 3 in the nare that received repeated saline challenges (Figure 3 and Table 3) was significantly increased compared to its own Day 1 response (Figure 2) (p = 0.03) and similar to the Day 1 PMN response in the LPS nare. This latter observation provides evidence of the integrity of the split nose design where similar PMN responses would have been expected between Day 1 (LPS nare) and Day 3 (saline nare) had LPS challenge of the repeat LPS nare not affected the control nare. In the LPS-treated nare, the blunted PMN response on Day 3 correlated well with the observed PMN response on Day 1 (r = 0.58, p = 0.02).
Figure 3.
Similar PMN response after LPS challenge in Day 1 LPS nare and Day 3 saline nare. Significantly decreased (after log transformation) PMN response in Day 3 LPS nare compared with Day 3 saline nare (*p = 0.03) and Day 1 LPS nare (#p = 0.05).
Table 3.
Baseline adjusted mean (±SEM) total cell and PMN counts after challenges Days 1 and 3.
| Cell variable | PostDl–PreD1 saline nare | PostD1–PreD1 LPS nare | PostD3–PreD1 saline nare | PostD3–PreD1 LPS nare |
|---|---|---|---|---|
| TCC/mg | 2 (20) | –31 (168) | 143 (82) | –84 (160) |
| PMN/mg | 19 (5) | 121 (32)* | 158 (76)# | 68 (22)*,# |
Significantly decreased PMN response (after log transformation) in LPS nare on Day 3 as compared with Day 1 LPS challenge in same nare (p = 0.05).
Significantly decreased PMN response (after log transformation) in LPS nare on Day 3 as compared with Day 3 LPS challenge in saline nare (p = 0.03).
sCD14 levels following LPS challenge on Day 3
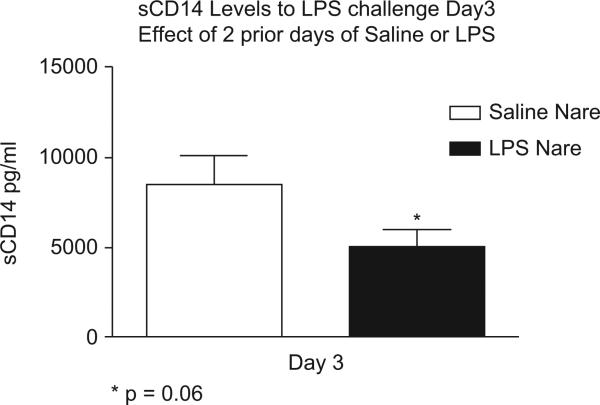
Like the PMN response, sCD14 levels were also affected by repeat LPS challenge. In Figure 4, sCD14 levels were lower and trending toward significance (p = 0.06) in the nare that received repeated LPS challenge (dark bar) compared to the saline nare (open bar). Day 3 sCD14 levels in the LPS nare were also decreased compared to the levels recovered from the LPS nare on Day 1 (5067 ± 911 pg/ml vs. 6016 ± 1273 pg/ml). As expected, sCD14 levels in the saline nare on Day 3 (open bar) were significantly elevated compared to the saline nare on Day 1 (8610 ± 1713 vs. 4535 ± 832 pg/ml).
Figure 4.
Lower sCD14 levels after Day 3 LPS challenge in nare that received repeat LPS as opposed to nare that receive saline on two previous days.
Fluid phase components recovered from NL on Day 3
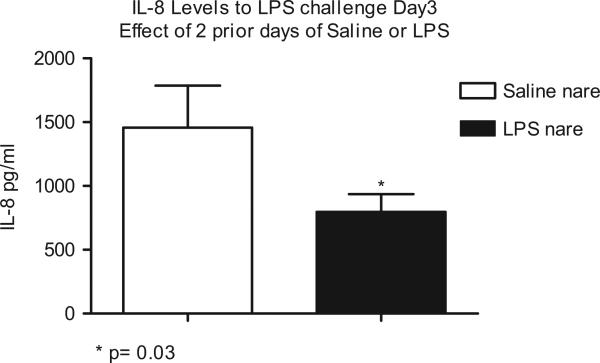
Table 4 shows the concentration (mean ± SEM) of all fluid phase components recovered from the saline and LPS pre-treated nares following LPS challenge on Day 3. All fluid phase components (excluding GM-CSF) were decreased in the nare that received repeated LPS challenge vs. the saline control nare. Significantly decreased levels of IL-8 (*p = 0.03) were observed in the LPS pre-treated nare compared to saline (Figure 5).
Table 4.
Fluid phase components recovered from nasal lavages on Day 3, mean (±SEM). N = 15 unless specifically noted.
| Mediator (pg/ml) | Post LPS challenge Day 3 saline nare | Post LPS Challenge Day 3 LPS nare |
|---|---|---|
| IL-8 | 1458 (327)* | 798 (137)* |
| sCD14 | 8503 (1598)# | 5067 (911)# |
| IL-6 | 194 (96) | 112 (38) |
| IL-1β | 98 (46) | 53 (19) |
| GM-CSF | 302 (59), n = 9 | 323 (44), n = 10 |
| ECP | 23 (7), n = 7 | 17 (11), n = 7 |
Significant decrease in IL-8 in nare with repeat LPS challenges as opposed to the nare that received saline on two prior days (p = 0.03).
Trending toward significant decrease in sCD14 in nare with repeat LPS challenges as opposed to the nare that received saline on two prior days (p = 0.06).
Figure 5.
Significant decrease in IL-8 on Day 3 LPS challenge in nare with repeat LPS challenges as opposed to the nare that received saline on two prior days.
Discussion
Using a split nose design, we observed attenuation of response to LPS (as defined by a blunted PMN response) in the nare that received repeated LPS challenges for 3 days but not in the control nostril that received two saline repeated saline challenges before a single LPS challenge. We also noted significantly lower IL-8 levels which parallels the PMN response in the nare that received repeated LPS. To our knowledge, this is the first report of such adaptation to endotoxin in a localized region of the human airway. This attenuation of LPS response occurred only in the nare that received repeated LPS challenge, and was seen in the absence of either parenteral endotoxin challenge or the presence of Gram-negative sepsis. Therefore, it is very unlikely that a systemic tolerizing effect of endotoxin delivered to the nasal airway accounts for this observation. Overall, these data suggest that attenuation of the effect of LPS can occur at local tissues and confirms that adaptation to endotoxin can be induced in the human airway in vivo.
This was a pilot study to determine effect of repeat LPS treatments in vivo and was not designed to assess the underlying mechanism by which attenuation of LPS response occurs. However, we did look at various inflammatory cytokines and sCD14 levels as additional measures of LPS response. There was decrease of sCD14 levels in the nare with repeat LPS, suggesting that a contributing mechanism of adaptation to LPS may involve lowering of airway sCD14 levels. CD14 is a critical molecule for LPS response, and sCD14 could confer ability to respond to LPS to epithelial cells which express TLR4 but not CD14. CD14 expression in airways is positively associated with inflammatory response to LPS (Alexis et al., 2001). We have also shown in atopic asthmatics that decreases in membrane bound CD14 on airway macrophages following inhaled corticosteroid treatment is associated with decreased response to LPS (Alexis and Peden 2001). Delineation of cellular mechanisms for attenuation of the response to LPS was beyond the scope of this pilot study.
Complex interaction exists between endotoxin and the development or progression of atopy and asthma. Early life exposure to endotoxin has been shown to reduce the risk of atopy and asthma while exposure once atopic sensitization has occurred seems to worsen it (Liu, 2002). Endotoxin accentuates eosinophil influx into airways of atopic asthmatics (Peden et al., 1999). Low-level allergen challenge with Dust mite Der f prior to low-dose endotoxin challenge enhances response to a single dose of endotoxin (Eldridge and Peden 2000b). It would be interesting to explore the interaction of multiple low-dose LPS challenges on subsequent allergen challenges. Interestingly, human bronchial epithelial cells also exhibited tolerance with repeat exposure to Pseudomonas aeruginosa extracts as evidenced by reduced nuclear factor-κB inhibitor degradation and IL-8 levels (Wu et al., 2005).
NL fluid was collected 6 h after LPS or saline challenge on Day 1 and LPS challenge on Day 3. It is possible that collection of NLF at different time points might have yielded more informative samples. Samples collected 30 min to 1 h after challenge might have demonstrated a more robust IL-1β, IL-6 or IL-8 response to LPS, allowing for a more clear comparison of cytokine responses to saline, LPS at baseline and LPS after repeated LPS challenge. Likewise, any impact of repeated LPS challenge to sCD14 and IL-10 might have been best appreciated immediately before challenge on Day 3 and not 6 h later. In this study, we chose not to add more lavages to the protocol to minimize the potential for disruption of the mediator milieu in the nasal mucosa. The 6-h post challenge time point was selected as an optimal time to examine neutrophil influx to the nasal airway on the basis of results from previous studies (Alexis, Eldridge, Reed, Bromberg, & Peden 2001). As this was a pilot study to determine if regional adaptation to LPS can occur, it was decided to design the study to optimize the likelihood of observing changes in neutrophil numbers.
This model of endotoxin adaptation in the nasal airway can be easily employed to examine changes at the functional and genetic level in epithelial and monocytic cells recovered from the nasal airway after challenge. It has also been found that GM-CSF may reverse attenuation of cellular response to LPS. It has been shown that allergen challenge enhances expression of CD14 levels in the airway, and we have found that allergen coupled with LPS response in the nasal airway augments response to LPS. Allergen challenge augments levels of GM-CSF, and the ability to attenuate the response to LPS may be abrogated in asthmatics, or following allergen challenge. This model of LPS adaptation in this report coupled with nasal allergen challenge would allow for examination of the effect of TH2 inflammation's ability to attenuate the response to LPS. LPS is an important component of airborne particulates and bio-aerosols and is associated with asthma exacerbation. It seems plausible that allergic inflammation may enhance the susceptibility of asthmatics to PM by attenuating response to repeated exposure LPS.
Conclusions
In summary, our data show that regional adaptation to repeat LPS can be induced in the nasal airways of healthy individuals as evidenced by attenuation in PMN response and lower IL-8 production. This study was not set up to analyze mechanisms for such changes. This study can form the basis for future studies looking at interaction of repeat LPS exposure prior to antigen challenge in healthy and atopic subjects.
Acknowledgments
We acknowledge NIAID Grant AI077437 and UNC CEMALB Internal Funds for making this work possible. D.B.P. is a consultant for ICAGEN, GlaxoSmithKline, Genentech, and Funxional Therapeutics Ltd and has received research support from the National Institutes of Health, National Institute of Allergy and Infectious Diseases, and National Institute of Environmental Health Sciences, and National Heart, Lung, and Blood Institute.
Footnotes
Declaration of interest
V.D., N.E.A. and H.Z. do not have any conflicts of interest to report.
References
- Alexis N, Eldridge M, Reed W, Bromberg P, Peden DB. CD14-dependent airway neutrophil response to inhaled LPS: role of atopy. J Allergy Clin Immunol. 2001;107:31–35. doi: 10.1067/mai.2001.111594. [DOI] [PubMed] [Google Scholar]
- Alexis NE, Peden DB. Blunting airway eosinophilic inflammation results in a decreased airway neutrophil response to inhaled LPS in patients with atopic asthma: a role for CD14. J Allergy Clin Immunol. 2001;108:577–580. doi: 10.1067/mai.2001.118511. [DOI] [PubMed] [Google Scholar]
- Biswas SK, Lopez-Collazo E. Endotoxin tolerance: new mechanisms, molecules and clinical significance. Trends Immunol. 2009;30:475–487. doi: 10.1016/j.it.2009.07.009. [DOI] [PubMed] [Google Scholar]
- Braun-Fahrländer C, Riedler J, Herz U, Eder W, Waser M, Grize L, Maisch S, Carr D, Gerlach F, Bufe A, Lauener RP, Schierl R, Renz H, Nowak D, von Mutius E, Allergy and Endotoxin Study Team Environmental exposure to endotoxin and its relation to asthma in school-age children. N Engl J Med. 2002;347:869–877. doi: 10.1056/NEJMoa020057. [DOI] [PubMed] [Google Scholar]
- Cavaillon JM, Adrie C, Fitting C, Adib-Conquy M. Endotoxin tolerance: is there a clinical relevance? J Endotoxin Res. 2003;9:101–107. doi: 10.1179/096805103125001487. [DOI] [PubMed] [Google Scholar]
- Christiani DC, Wegman DH, Eisen EA, Ye TT, Lu PL, Olenchock SA. Cotton dust and gram-negative bacterial endotoxin correlations in two cotton textile mills. Am J Ind Med. 1993;23:333–342. doi: 10.1002/ajim.4700230210. [DOI] [PubMed] [Google Scholar]
- Doreswamy V, Peden DB. Modulation of asthma by endotoxin. Clin Exp Allergy. 2011;41:9–19. doi: 10.1111/j.1365-2222.2010.03628.x. [DOI] [PubMed] [Google Scholar]
- Draisma A, Pickkers P, Bouw MP, van der Hoeven JG. Development of endotoxin tolerance in humans in vivo. Crit Care Med. 2009;37:1261–1267. doi: 10.1097/CCM.0b013e31819c3c67. [DOI] [PubMed] [Google Scholar]
- Eldridge MW, Peden DB. Airway response to concomitant exposure with endotoxin and allergen in atopic asthmatics. J Toxicol Environ Health Part A. 2000a;61:27–37. doi: 10.1080/00984100050116762. [DOI] [PubMed] [Google Scholar]
- Eldridge MW, Peden DB. Allergen provocation augments endotoxin-induced nasal inflammation in subjects with atopic asthma. J Allergy Clin Immunol. 2000b;105:475–481. doi: 10.1067/mai.2000.104552. [DOI] [PubMed] [Google Scholar]
- Fan H, Cook JA. Molecular mechanisms of endotoxin tolerance. J Endotoxin Res. 2004;10:71–84. doi: 10.1179/096805104225003997. [DOI] [PubMed] [Google Scholar]
- Liu AH. Endotoxin exposure in allergy and asthma: reconciling a paradox. J Allergy Clin Immunol. 2002;109:379–392. doi: 10.1067/mai.2002.122157. [DOI] [PubMed] [Google Scholar]
- Mamolen M, Lewis DM, Blanchet MA, Satink FJ, Vogt RL. Investigation of an outbreak of “humidifier fever” in a print shop. Am J Ind Med. 1993;23:483–490. doi: 10.1002/ajim.4700230311. [DOI] [PubMed] [Google Scholar]
- Milton DK, Amsel J, Reed CE, Enright PL, Brown LR, Aughenbaugh GL, Morey PR. Cross-sectional follow-up of a flu-like respiratory illness among fiberglass manufacturing employees: endotoxin exposure associated with two distinct sequelae. Am J Ind Med. 1995;28:469–488. doi: 10.1002/ajim.4700280404. [DOI] [PubMed] [Google Scholar]
- Niven RM, Fletcher AM, Pickering CA, Fishwick D, Warburton CJ, Simpson JC, Francis H, Oldham LA. Chronic bronchitis in textile workers. Thorax. 1997;52:22–27. doi: 10.1136/thx.52.1.22. [DOI] [PMC free article] [PubMed] [Google Scholar]
- Pal TM, de Monchy JG, Groothoff JW, Post D. The clinical spectrum of humidifier disease in synthetic fiber plants. Am J Ind Med. 1997;31:682–692. doi: 10.1002/(sici)1097-0274(199706)31:6<682::aid-ajim3>3.0.co;2-t. [DOI] [PubMed] [Google Scholar]
- Peden DB. The use of nasal lavage for objective measurement of irritant-induced nasal inflammation. Regul Toxicol Pharmacol. 1996;24:S76–S78. doi: 10.1006/rtph.1996.0081. [DOI] [PubMed] [Google Scholar]
- Peden DB, Setzer RW, Jr, Devlin RB. Ozone exposure has both a priming effect on allergen-induced responses and an intrinsic inflammatory action in the nasal airways of perennially allergic asthmatics. Am J Respir Crit Care Med. 1995;151:1336–1345. doi: 10.1164/ajrccm.151.5.7735583. [DOI] [PubMed] [Google Scholar]
- Peden DB, Tucker K, Murphy P, Newlin-Clapp L, Boehlecke B, Hazucha M, Bromberg P, Reed W. Eosinophil influx to the nasal airway after local, low-level LPS challenge in humans. J Allergy Clin Immunol. 1999;104:388–394. doi: 10.1016/s0091-6749(99)70383-0. [DOI] [PubMed] [Google Scholar]
- Rietschel ET, Kirikae T, Schade FU, Mamat U, Schmidt G, Loppnow H, Ulmer AJ, Zähringer U, Seydel U, Di Padova F. Bacterial endotoxin: molecular relationships of structure to activity and function. FASEB J. 1994;8:217–225. doi: 10.1096/fasebj.8.2.8119492. [DOI] [PubMed] [Google Scholar]
- Rylander R, Haglind P. Airborne endotoxins and humidifier disease. Clin Allergy. 1984;14:109–112. doi: 10.1111/j.1365-2222.1984.tb02197.x. [DOI] [PubMed] [Google Scholar]
- Rylander R, Malmberg P. Non-infectious fever: inhalation fever or toxic alveolitis? Br J Ind Med. 1992;49:296. doi: 10.1136/oem.49.4.296. [DOI] [PMC free article] [PubMed] [Google Scholar]
- Schneiter R, Neal PA, Caminita BH. Etiology of Acute Illness Among Workers Using Low-grade Stained Cotton. Am J Public Health Nations Health. 1942;32:1345–1359. doi: 10.2105/ajph.32.12.1345. [DOI] [PMC free article] [PubMed] [Google Scholar]
- Schwartz DA, Thorne PS, Yagla SJ, Burmeister LF, Olenchock SA, Watt JL, Quinn TJ. The role of endotoxin in grain dust-induced lung disease. Am J Respir Crit Care Med. 1995;152:603–608. doi: 10.1164/ajrccm.152.2.7633714. [DOI] [PubMed] [Google Scholar]
- Sigsgaard T, Pedersen OF, Juul S, Gravesen S. Respiratory disorders and atopy in cotton, wool, and other textile mill workers in Denmark. Am J Ind Med. 1992;22:163–184. doi: 10.1002/ajim.4700220204. [DOI] [PubMed] [Google Scholar]
- Simpson JC, Niven RM, Pickering CA, Fletcher AM, Oldham LA, Francis HM. Prevalence and predictors of work related respiratory symptoms in workers exposed to organic dusts. Occup Environ Med. 1998;55:668–672. doi: 10.1136/oem.55.10.668. [DOI] [PMC free article] [PubMed] [Google Scholar]
- West MA, Heagy W. Endotoxin tolerance: A review. Crit Care Med. 2002;30:S64–S73. [PubMed] [Google Scholar]
- Wu Q, Lu Z, Verghese MW, Randell SH. Airway epithelial cell tolerance to Pseudomonas aeruginosa. Respir Res. 2005;6:26. doi: 10.1186/1465-9921-6-26. [DOI] [PMC free article] [PubMed] [Google Scholar]


