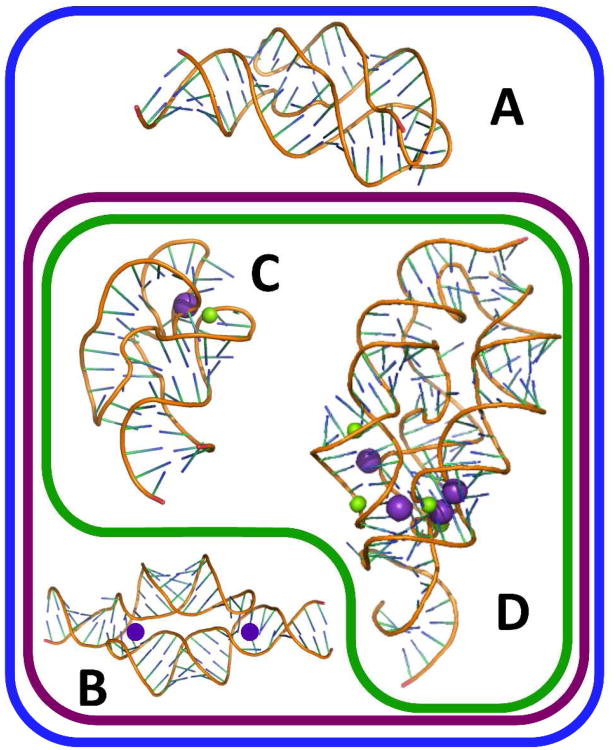
Figure 1.
Venn diagram depicting the RNA structures analyzed in this study and how they interact with cations. Blue outline contains population of RNAs stabilized by cations residing in the ion atmosphere. Purple outline contains RNAs that, in addition, have chelated K+ ions (purple spheres). RNAs within the green outline also have chelated Mg2+ ions (green spheres). A) A-riboswitch, PDB ID: 3G4M. B) TLR RNA, PDB ID:2I7E; (K+ ions have been added as discussed in text). C) 58mer rRNA, PDB ID: 1HC8. D) M-box riboswitch, PDB ID: 2QBZ. See Figure S1 for sequences used in this study.

