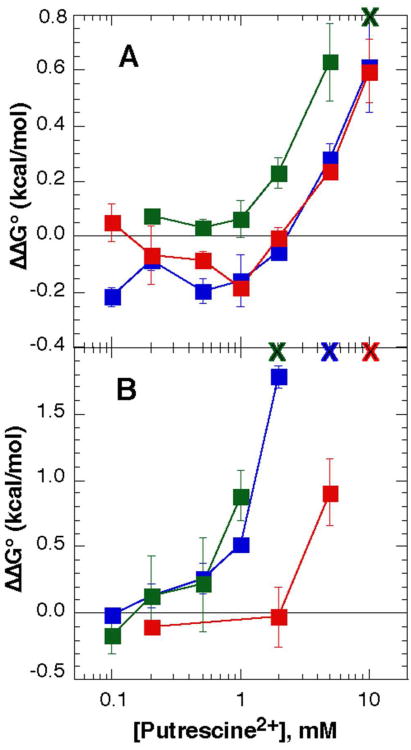
Figure 6.
Stability of the magnesium-chelating RNAs in varying concentrations of putrescine2+. A, stability of the 58mer rRNA fragment relative to stability in buffer with 50 mM K+ and 0.5 mM (green), 1.0 mM (blue), or 2.0 mM (red) MgCl2. The green “X” at the top of the graph represents the concentration of putrescine2+ (with 0.5 mM Mg2+) at which the tertiary structure can no longer be detected in the melting curves. B, stability of the M-box RNA relative to buffer with 50 mM K+ and 0.75 mM (green), 1.0 mM (blue), or 2.0 mM (red) MgCl2. An “X” at the top of graph represents the concentration of putrescine where the tertiary structure is no longer observed with 0.75 mM (green), 1 mM (blue), or 2 mM (red) Mg2+.

