Abstract
Aquaporin Z (AQPZ) is a tetrameric protein that forms water channels in the cell membrane of Escherichia coli. The histidine residue (residue 174) in the selectivity filter (SF) region plays an important role in the transport of water across the membrane. In this work, we perform equilibrium molecular dynamics (MD) simulations to illustrate the gating mechanism of the SF and the influences of residue 174 in two different protonation states: Hsd174 with the proton at Nδ, and Hse174 with the proton at Nε. We calculate the pore radii in the SF region versus the simulation time. We perform steered MD to compute the free-energy profile, i.e., the potential of mean force (PMF) of a water molecule through the SF region. We conduct a quantum mechanics calculation of the binding energy of one water molecule with the residues in the SF region. The hydrogen bonds formed between the side chain of Hsd174 and the side chain of residue 189 (Arg189) play important roles in the selectivity mechanism of AQPZ. The radii of the pores, the hydrogen-bond analysis, and the free energies show that it is easier for water molecules to permeate through the SF region of AQPZ with residue 174 in the Hse state than in the Hsd state.
Keywords: AQPZ, Water channels, Steered molecular dynamics, BD-FDT
Introduction
Aquaporins (AQPs) are a family of intrinsic membrane channel proteins present in various organisms from humans to bacteria [1]. AQPs play a significant role in water homeostasis in living cells, and mutations of them are responsible for various human diseases ranging from diabetes to congenital cataract formation [2]. They have been discovered in organisms as diverse as archaea, bacteria, plants, insects, and mammals [3, 4]. Since their discovery by Agre and coworkers [1], many researchers have focused their attention on AQPs [5]. As a result, more high-resolution structural data is currently available for AQPs than for any other membrane channel protein family. Savage and coworkers have reported the crystal structure of AQPZ [6]. AQPZ and the other all known AQP structures share a common molecular architecture containing four monomeric subunits assembled into a homotetrameric structure. Each channel monomer contains two highly conserved regions, the conserved Asn-Pro-Ala (NPA) motifs and the aromatic/arginine constriction region [7–11]. The NPAs are located at the ends of the two half helices. The two asparagine side chains of the NPAs point into the pore. The aromatic/arginine constriction region—known as the selectivity filter (SF)—is located near to the extracellular exit of the channel, and is the narrowest point in the entire channel. Therefore, it is generally assumed to be important in the selection mechanics of the permeation of water through the channel. It is formed by the side chains of Phe43, His174, and Arg189, and the carbonyl of Thr183. The trio of His174, Thr183, and Arg189 create a hydrophilic triangle opposite the hydrophobic Trp200 (all of these residue numbers are the same as in Savage's structure [6]). Two different conformations of the AQPZ structure have been reported by Fu and coworkers [12].
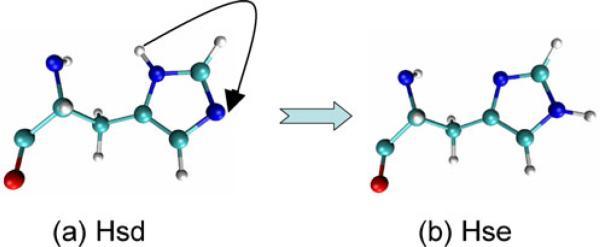
As suggested by experimental and molecular dynamics (MD) simulation studies, the mechanism for the channel gating of AQPZ involves switching between the two conformations (denoted “up” and “down,” respectively) of the side chain of Arg189 [13–24]. The up conformation implies that the water is distributed continuously throughout the channel, while the water distribution is interrupted in the down conformation. MD simulations and experiments on this topic that are reported in the literature demonstrate that the permeation of water across AQPZ does not exhibit pH sensitivity in the range of 4.5≤pH ≤7.5, even though the pKa of free histidine is 6.0 [25–29]. When the imidazole ring of histidine is neutral, the proton of the imidazole can exist on either of the two nitrogen atoms, giving rise to either the Hsd (Fig. 1a) or the Hse (Fig. 1b) tautomer. NMR shows that when the pH increases to approximately 8, the proton shift of Hsd drops slightly, while the chemical shift of Hse drops considerably. This indicates that the Hsd tautomer is preferred, presumably due to the neighboring ammonium [30, 31]. However, current experimental data are not sufficient to differentiate the effects of AQPZ in the different protonation states (Hsd and Hse)—the detailed mechanisms are still not known.
Fig. 1.
Tautomers of histidine: a Hsd and b Hse
In the work described in this paper, we aimed to demonstrate the effects of AQPZ in these two different protonation states by investigating them through MD simulation. MD is a powerful tool for understanding the influences of residues in different protonation states. MD simulations and free-energy calculations have shown that the protonation state strongly influences HIV-1 protease inhibitor complexes [32–34]. Also, steered molecular dynamics (SMD) simulation has recently emerged as a flexible and powerful tool for providing information about the energy landscape [35, 36]. We therefore carried out two MD simulations and two SMD simulations of AQPZ with His174 in either the Hsd or the Hse protonation state. Comparisons of the MD trajectories and energies between AQPZd (AQPZ with the His174 in the Hsd protonation state) and AQPZe (AQPZ with the His174 in the Hse protonation state) were made to clarify the influences of these different protonation states of His174.
Modeling and simulation
Modeling
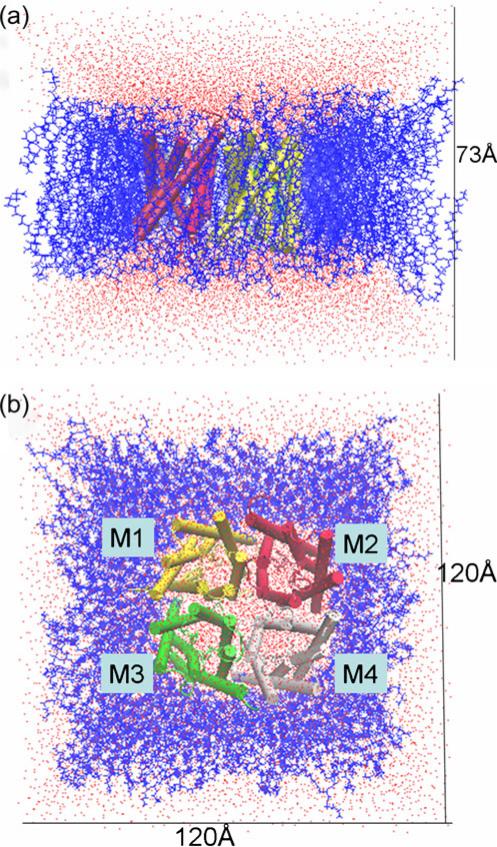
We built the simulated system of the AQPZ tetramer as follows: a 120×120 Å2 palmitoyloleoylphosphatidylethanolamine (POPE) bilayer patch was first built using VMD's “membrane” plugin [37], with the normal direction of the membrane aligned with the z-axis (see Fig. 2). The tetramer of AQPZ (pdb code 1RC2) [6] was embedded into this bilayer. All of the lipid and water molecules within 0.8 Å of the heavy atoms of the protein were removed. Two 18 Å slabs of TIP3 water molecules [38] were then added to the top and the bottom of the lipid and protein complex using the “solvate” plugin of VMD to fully hydrate the bilayer. To neutralize the system, 80 Na+ and 80 Cl– ions were added using VMD's “autoionize” plugin [37], generating an ionic concentration of 0.5 mol/L. In the first system, His174 was in the Hsd protonation state, leading to the AQPZd system (Fig. 1a). The second system, called the AQPZe system, had its His174 in the Hse protonation state (Fig. 1b). The AQPZe system was constructed by taking the last structure of the AQPZd system obtained at the end of the 28th ns of the MD trajectory and mutating Hsd174 into Hse174. Each of the two systems (see Fig. 2) contains an AQPZ tetramer (in the Hsd or the Hse protonation state), 17,036 water molecules, 287 lipid molecules, 80 sodium ions, and 80 chlorine ions: 100,703 atoms in total. The AQPZ tetramer has four monomers: M1, M2, M3, and M4 (see Fig. 2b).
Fig. 2.
Side (a) and top (b) views of the MD system for AQPZd. The size of the initial system is ~120×120× 73 Å3. The four monomers are shown in different colors in a cartoon representation. The tetramer is fully embedded into a POPE lipid bilayer, shown as blue lines, and solvated by TIP3 water molecules, shown in red and white
Molecular dynamics simulations
Two simulations were performed with the NAMD simulation package [39] using the CHARMM27 force-field parameter set [40]. The pressure was fixed at 1 bar using the Langevin piston algorithm [41]. Periodic boundary conditions were employed. A constant simulation temperature of 310 K was also employed using Langevin dynamics. Covalent bonds involving a hydrogen atom were constrained to be their equilibrium lengths by means of the SHAKE algorithm. The Lennard–Jones potential was smoothly truncated. The r-RESPA multiple time-step propagator [42] was used to integrate the equations of motion with time steps of 2 and 4 fs for short- and long-range forces, respectively. The particle mesh Ewald (PME) method [43] was employed to compute electrostatic interactions. The AQPZd system was minimized by performing 2000 cycles with fixed water molecules, the protein, and the phosphorus atoms, followed by 2000 cycles with the protein atoms restrained using a force constant of 2 kcal/(mol Å2). After energy minimization, in which harmonic restraints with a force constant of 2 kcal/(mol Å2) were applied to the protein, 500 ps of equilibration were performed. Finally, 40 ns of isothermal isobaric ensemble (NPT)-MD simulation was performed without any restraints. Twelve nanoseconds of NPT-MD simulation was performed for the AQPZe system.
Steered molecular dynamics
Starting from the equilibrium state obtained at the end of the conventional MD simulations, we performed SMD [44, 45] simulations on the AQPZd and AQPZe systems using NAMD. In order to improve the statistics, we used an infinitely stiff spring to pull (steer) the centers of mass of selected water molecules. In the limit of infinite stiffness, k→∞, this pulling can be accomplished by fixing the z-coordinate of the center of mass of the pulled molecule, z(x), to a control parameter λF(R)(t) at each time step t. Here, x represents the coordinates of all of the atoms in the system. In this limit, dz=vdt, and the pulling force then is equal to the net force on the pulled molecule exerted by the rest of the entire system, i.e.,
| (1) |
Here, H0(x) is the Hamiltonian of the entire system in the absence of the pulling force. We chose four water molecules, one in each pore, with the same z-coordinate. We pulled the z-coordinate of the center of mass of a water molecule through the pore. L.Y. Chen pulled a glycerol through the aquaglyceroporin Glpf at two speeds (v = ±0.05A/ps and v = ±0.02A/ps ) using the same method as employed in this paper. The results showed that both speeds yield similar free energy profiles within the margins for error. Due to the extremely high complexity (and thus time-consuming nature from a computational perspective) of the free-energy profile for a large system, the speed was kept constant (v = ±0.05A/ps). The work involved in pulling the four water molecules was averaged. The Brownian dynamics fluctuation–dissipation theorem (BD-FDT) [46, 47] was applied to extract the equilibrium free-energy profile from the measured nonequilibrium, irreversible work. This method has been successfully applied to investigate ligand–protein interactions [48] and the free-energy profile of water molecules passing through a GlpF membrane protein [49]. We sampled five forward and five reverse pulling paths and measured the work involved in this pulling. The mechanical work done to the system along a forward path (from state A to state B) and a reverse path (from B to A) can be, respectively, expressed as
| (2) |
| (3) |
In terms of mechanical work, the BD-FDT relates the equilibrium free energy to the nonequilibrium work as follows:
| (4) |
Here, ΔG = GB – GA is the difference between the free energies of states A and B. β=1/kBT, where kB and T are the Boltzmann constant and the absolute temperature, respectively. The statistical average of the various forward paths is
| (5) |
where the index p indicates the pth path among the NF forward paths from state A to state B.
The statistical average of the NR reverse paths from state B to state A is
| (6) |
Results and discussion
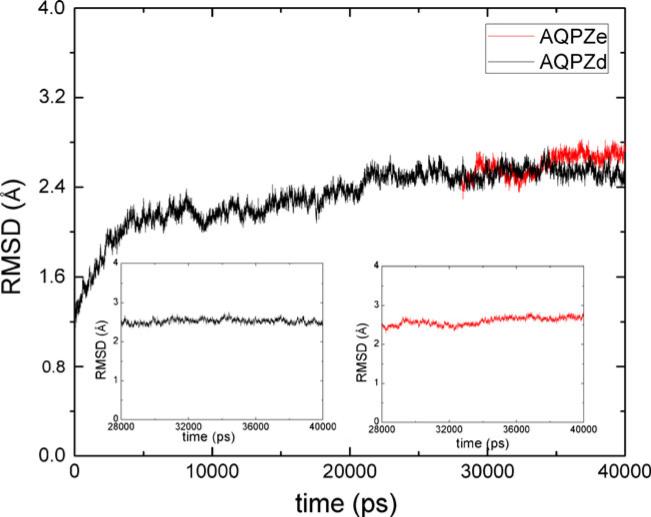
We carried out 40 ns of MD simulation of AQPZd. We observed the root mean-square deviations (RMSDs) of the backbone obtained from the X-ray crystallographic structure. The backbone RMSD curve for the entire trajectory of AQPZd is shown in Fig. 3. The configuration stabilizes at 21 ns, and the average RMSD for the last 10 ns is 2.54 Å. Figure 3 also shows the RMSD of the AQPZe system. The average RMSD for the last 10 ns is 2.60 Å for the AQPZe system. An equilibrated MD simulation for AQP1 shows that the average RMSD is approximately 3.3 Å [50], so the AQPZd and AQPZe systems show good stability, meaning that it was reasonable for us to generate the structure of AQPZe from that of AQPZd at the end of the 28th ns of simulation. This method saves a lot of computing time relating to the equilibration of the starting structure. When compared to the X-ray crystallographic structure, AQPZd and AQPZe appear to be very similar to each other. In both cases, the RMSD of the backbone plot relative to the starting structure barely fluctuates during the last 10 ns of MD simulation (Fig. 3). All subsequent analysis is therefore based on the trajectory for the last 10 ns of MD simulation for the two systems.
Fig. 3.
The root mean-square deviations (RMSDs) of the backbone atoms of AQPZd and AQPZe relative to their crystal structures as a function of time. The insets are the RMSD curves for the last 10 ns of MD simulation
To examine whether the protonation state influences the permeation of water molecules through AQPZ, the unidirectional permeation rate of water was obtained by counting the number of times that a water molecule passed completely through the AQPZ channel pore during the last 10 ns of simulation. Water permeated through AQPZd 8 times and through AQPZe 36 times. This indicates that the protonation state has a strong influence on the permeation of water through AQPZ.
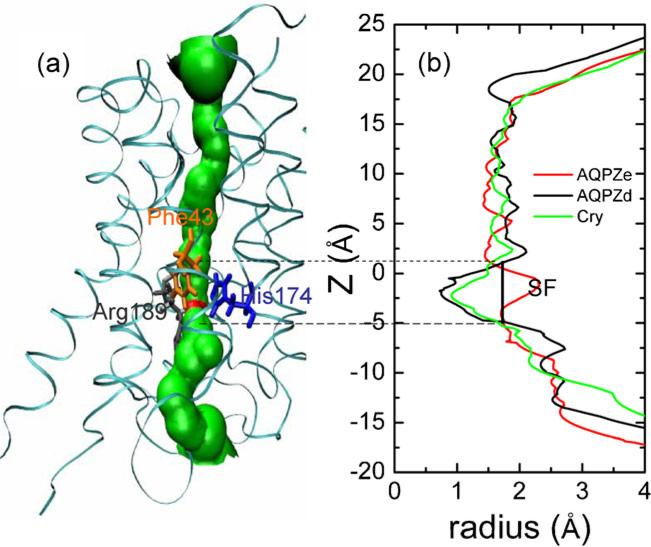
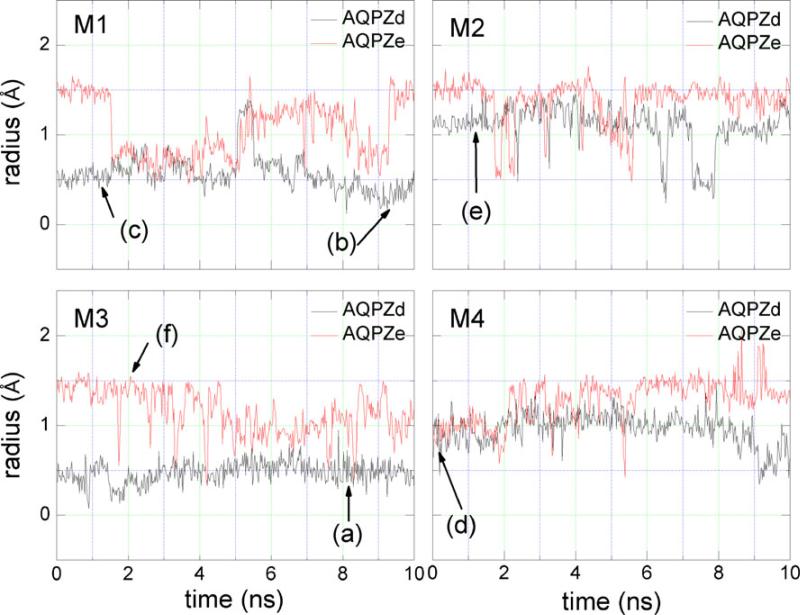
Figure 4 shows the radius of the water pore along the water permeation route. The radii were calculated using the program HOLE [51]. The profile of the pore radius of AQPZd resembles that of the crystallographic structure, but AQPZe shows a large difference from the crystallographic structure and from AQPZd in the SF region. The narrowest region of the pore is observed in the SF region in the crystallographic structure and AQPZd, but the narrowest region of AQPZe is not the SF region. Figure 4 only shows the pore of one snapshot along the MD trajectory. Nevertheless, it indicates that the Hse protonation state may cause significant conformational deviations from the crystallographic structure, while the Hsd protonation state does not lead to much deviation. In order to show how the radii change along the whole MD trajectory, we chose a total of 5000 structures—one frame per 2 ps—from the last 10 ns of the MD trajectory. We obtained the minimum radius of every structure in the SF region. However, there were large variations in the radii we chose. Thus, for each ten consecutive minimum radii, we calculated the average minimum radius, and plotted these minimum pore radii versus the simulation time: see Fig. 5. It is clear from Fig. 5 that the minimum radius of AQPZd is significantly smaller than the minimum radius of AQPZe most of the time.
Fig. 4.
Structural representation a shows the position of the water pore in red and green colors. AQPZ is shown as ribbons. The residues (Phe 43, His174, and Arg189) are shown as licorice, and each residue of interest is colored individually. Plot b shows the pore radii for AQPZd (black line), AQPZe (red line), and the crystallographic structure (green line) along the channel axis. The SF region is labeled
Fig. 5.
The average minimum radius in the SF region during the last 10 ns of MD simulation versus simulation time for the four pores in the AQPZd and AQPZe systems
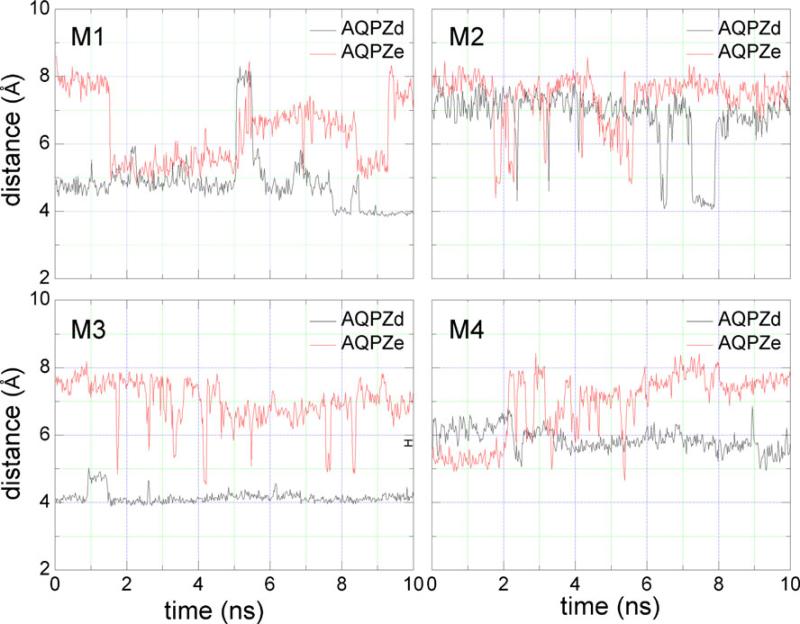
Figure 6 shows the minimum distance between the center of mass of the side chain of Arg189 and that of the side chain of His174. The distances is generally smaller for AQPZd than for AQPZe. Comparisons between the minimum radii (Fig. 5) and the minimum distances (Fig. 6) were performed. In all four pores for both AQPZd and AQPZe, the trend for the distance versus time is very similar to the trend for the minimum radii versus time. Thus, the minimum radius of the SF region is determined by the minimum distance between the side chain of Arg189 and the side chain of His174. Figure 7 shows the number of hydrogen bonds that formed between the side chain of Arg189 and the side chain of His174 during the MD simulation. Hydrogen bonds are defined by acceptor...donor distances of less than 3.5 Å and acceptor...H–donor angles of greater than 120°. In pore M1, the average minimum radius of AQPZd during the last 2 ns is clearly generally smaller than that of AQPZe. On the other hand, more hydrogen bonds are observed during the last 2 ns (Fig. 7). In pore M2 of AQPZd, the minimum radius is smaller during the seventh and the eighth nanoseconds. Figure 7 also shows that there are more hydrogen bonds during those two nanoseconds. In pore M3 of AQPZd, the minimum radius fluctuates by less than 0.5 Å and the hydrogen bonds are similar to the hydrogen bonds of pore M2 from 7.2 ns to 7.9 ns. In pore M4, the minimum radius is generally larger than it is in pore M3, and there are no hydrogen bonds during this entire time period. For AQPZe, we observe that there are nearly no hydrogen bonds and that the average minimum radius tends to be larger than that for AQPZd in all four pores. The pore is open when there are water molecules in the pore; the radius of the pore in this case is about 1 Å. The pore is closed when the radius of the pore is less than 0.8 Å. Thus, based on the distance between the two side chains of the two residues, the average minimum radii, and the number of hydrogen bonds present, we can conclude that the state of each pore is determined by the interaction between the side chain of His174 and the side chain of Arg189. As shown in Figs. 5 and 6, all four pores are open in AQPZe except during the period 1.7–5 ns, when pore M1 is closed. In AQPZd, pores M1 and M3 are closed and pores M2 and M4 are almost always open during the last 10 ns of the MD simulation. Based on the positions of the side chain of His174 and the side chain of Arg189, we can see that the unprotonated Nε atom in the Hsd state can more easily form a hydrogen bond with the side chain of Arg189 than the protonated Nε atom in the Hse state can. Hydrogen-bond analysis also shows that very few hydrogen bonds are formed in the AQPZe system. The average interaction free energy between the side chain of Arg189 and the side chain of His174 calculated with Charmm force field is larger for the AQPZd system (16.3 kcal mol–1) than for the AQPZe system (1.9 kcal mol–1). This may indicate that the protonation state of His174 is affected by the side chain of Arg189. When the interaction between the side chain of Arg189 and the side chain of His174 is weaker, His174 is in the Hse protonation state.
Fig. 6.
The average minimum distance between the side chain of Arg189 and the side chain of His174 during the last 10 ns of MD simulation versus simulation time
Fig. 7.
The total number of hydrogen bonds between the side chain of His174 and the side chain of Arg189 versus simulation time for the four pores in AQPZd and AQPZe
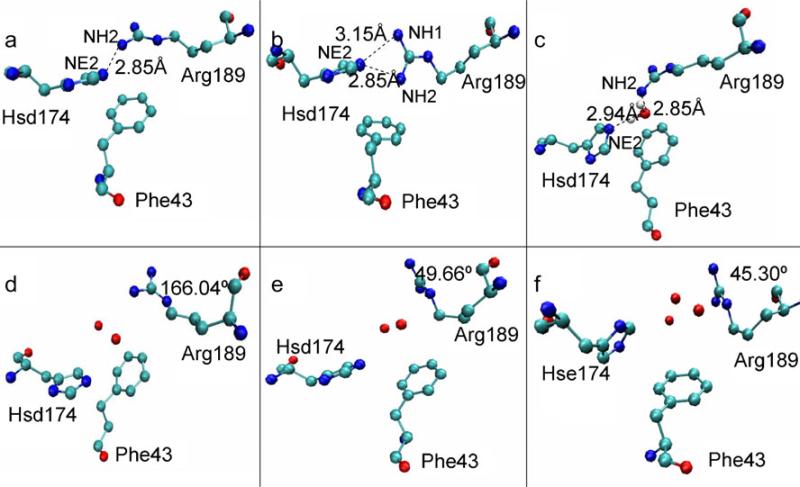
We find that the key residues have three different configurations when the SF region is in the closed state. There are two different configurations when the SF region is in the open state with a water molecule in the SF region. Figure 8 shows the different states of the SF region for the structures taken from the last 10 ns of MD simulation at the times marked in Fig. 5. Figure 8a, b, and c show the closed states. The configurations in the three states are mainly differ in relation to the residue Arg189. In Fig. 8a, the distance between the NE2 atom of Hsd174 and the NH2 atom of Arg189 is 2.85 Å. The angle formed between the NE2 atom of Hsd174 and the HH22 and NH2 atoms of Arg189 is 140°, so there is a strong hydrogen bond between them. The hydrogen bond closes the pore and blocks the passage of water molecules through it. The state shown in Fig. 8b is from the last 1 ns of simulation for pore M1 of AQPZd. The distances between the NE2 atom of Hsd174 and the two nitrogen atoms of the Arg189 are 2.85 Å and 3.15 Å, respectively. Hydrogen-bond analysis also shows multiple hydrogen bonds. The interaction between the two side chains must be strong in this case. The interaction free energy between the side chain of Arg189 and the side chain of Hsd174 calculated within VMD is greatest during the last 1 ns in pore M1. The state depicted in Fig. 8c state is for pore M1; there is a water molecule locked at the SF region during the first 3 ns. Thus, the side chain of Arg189 and the side chain of Hsd174 cannot form a hydrogen bond, although these two side chains still interact via the locked water molecule because the water molecule forms two hydrogen bonds with the two side chains. As shown in Fig. 8c, the distances between the donor atoms and the acceptor atoms indicate that these two hydrogen bonds are strong. When the SF region is in this state, the locked water molecule blocks the other water molecules from passing through the pore. Figures 8d, e, and f show the open states. Figure 8f relates to AQPZe. In this case, there are two or three water molecules in-between the Arg189 and Hsd174 residues, implying that the pore is open. The configuration of the Arg189 side chain has two different states. One is shown in Fig. 8d, where the dihedral angle<Cβ–Cγ–Cδ–Nε of Arg189 is 166.04°. The other state is shown in Figs. 8e and f, where the dihedral angle <Cβ–Cγ–Cδ–Nε of Arg189 is 49.66° and 45.30°, respectively.
Fig. 8.
The conformations of the three residues in the SF region. The snapshots are taken from the last 10 ns of MD simulation. The three residues and the water molecules are shown in ball-and-stick representation and each element is shown in a different color. The distances between the hydrogen-bond donor and acceptor and the dihedral angles <Cβ–Cγ–Cδ–Nε of Arg189 are also marked
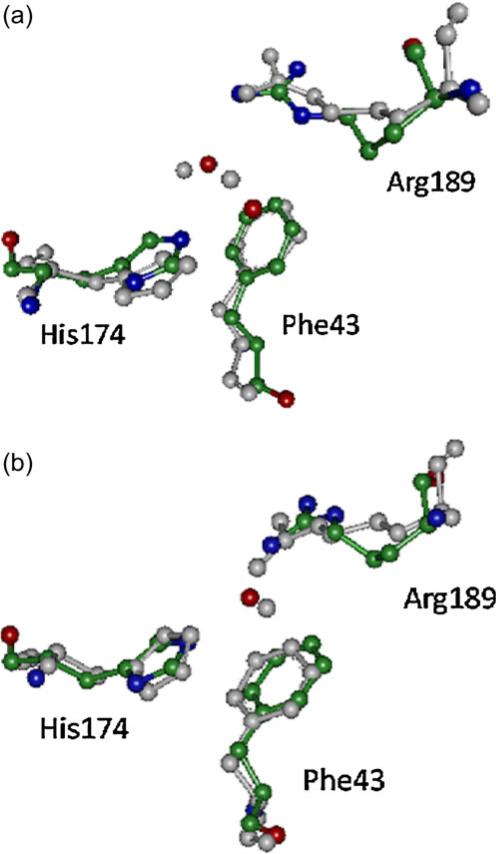
The crystallographic structure of AQPZ (pdb code 1RC2) shows that the SF region has two conformations (Fig. 9). A comparison of the conformations of the three residues in the crystallographic structure and in the MD structures was performed to show which of the protonation states most plausibly corresponds to the crystallographic structure. The crystallographic conformation was compared to the MD conformation presented in Fig. 8d (see Fig. 9a), while the crystallographic conformation was also compared with the MD conformation shown in Fig. 8c (see Fig. 9b). We can see that the crystallographic structure conformation is a very close fit to the MD conformation in AQPZd. This means that the protonation state of His174 is most plausibly Hsd.
Fig. 9.
The conformation of the three residues in the SF region of the crystallographic structure superimposed on the two conformations of the MD structure. The MD conformation is shown in gray and the crystallographic structure is colored according to element
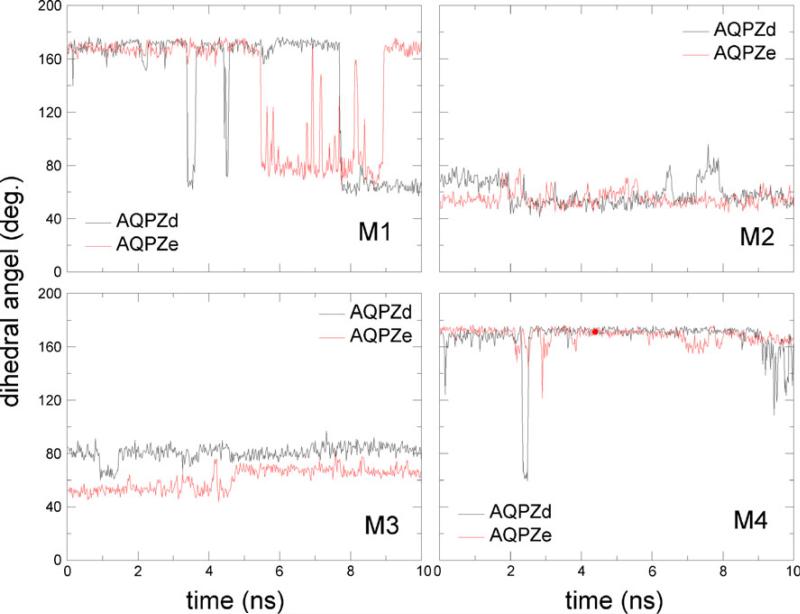
In Jensen's report [14], it was observed that each pore can be in an open, intermediate, or closed state. The gate mechanism of the pore between the open and closed states is characterized by the dihedral angel <Cβ–Cγ–Cδ–Nε of residue Arg189. The characteristic angle <Cβ–Cγ–Cδ–Nε is 165°, 61°, and 98° for the up, mid, and down states, respectively. Figure 10 shows the dihedral angles for the four pores in AQPZd and AQPZe versus the simulation time. The Arg189 side chain exhibited highly dynamic behavior in our two MD simulations. A comparison between the minimum radius (Fig. 5) of the pore and the dihedral angle <Cβ–Cγ–Cδ–Nε (Fig. 10) of residue Arg189 was performed to examine the correlation between the state of the SF region and this dihedral angle. For AQPZe, when pores M2, M3, and M4 are in the open state, the dihedral angles are ~60° or ~160°. For AQPZd, when the dihedral angle is about 60°, pore M2 is open but pore M3 is closed. However, when pore M1 is nearly closed, the dihedral angle fluctuates from 160° to 60°. We can conclude that the dihedral angle of the Arg189 side chain is insufficient to represent the state of the pore.
Fig. 10.
Dynamic behavior of the dihedral angle <Cβ–Cγ–Cδ–Nε of Arg189 for the four monomers M1–M4 in the two simulations
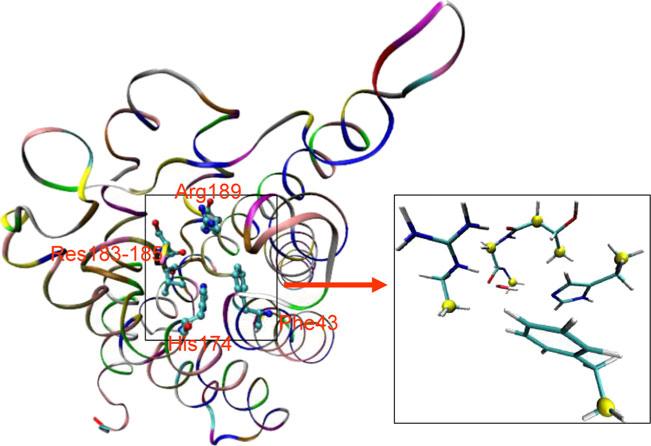
We then examined the free-energy landscape for one water molecule to pass through the SF region for the AQPZd and AQPZe systems. Quantum mechanics (QM) and FDT were used to do this. Figure 11 shows the location of the SF region of one AQPZ monomer. It also shows the model used for the QM calculation. There were 72 atoms in the QM-modeled region. Three steps were performed in the QM calculation procedure. Firstly, the water molecule was dragged from the QM-modeled region to an infinite distance in order to achieve a QM unbound state. Secondly, the intrinsic total energies for the QM region (Etot) and the QM unbound state (Eunb) were calculated using the Gaussian software package at the HF-6-31 g level [52] in the gas phase with several atoms fixed, as shown in Fig. 11. Thirdly, the binding free energy (Ebin) between the water molecule and the QM model excluding the water molecule was obtained using the equation: Ebin = Etot – Eunb. The original structure that was used to perform the QM calculations was obtained from the lowest potential energy snapshot acquired during the equilibrated MD simulation. The binding free energies between the water molecule and the QM region of AQPZd and AQPZe were –11.23 and –5.81 kcal mol–1, respectively (Table 1). This shows that the binding energy for AQPZd is much higher than that for AQPZe, which means that it is more difficult for a water molecule to traverse the SF region in the AQPZd system than that in the AQPZe system.
Fig. 11.
Left: the location of the SF region in AQPZ. AQPZ is shown in the ribbon representation. The residues that are involved in the quantum mechanics (QM) calculation are shown in stick-and-ball representation. Right: enlargement of the QM region, which is shown in the stick representation. The fixed atoms in the QM calculation are shown as yellow balls
Table 1.
Summary of the energies of the SF areas in AQPZd and AQPZe in kcal mol–1
| System | QM | FDT |
|---|---|---|
| AQPZd | –11.23 | –5.69 |
| AQPZe | –5.81 | –1.92 |
| Difference | –5.42 | –3.77 |
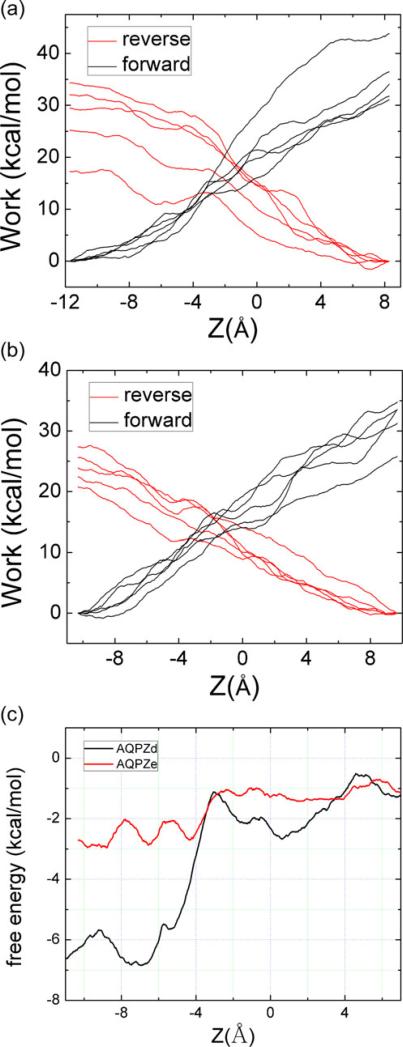
We performed SMD and used the BD-FDT to compute the free-energy profile for the passage of a water molecule though the pores of AQPZd and AQPZe. We sampled five forward and five reverse pulling paths. The work done in each case is shown in Fig. 12a and b. The work curves indicate that the pulling is irreversible. We applied the BD-FDT to the five forward and five reverse paths and obtained a set of free-energy differences for AQPZd, and then did the same for AQPZe. In this work, we focused on the SF region, so we pulled the water molecules through the SF regions and pulled them out of the pores. The free-energy landscape is shown in Fig. 12c. The free-energy barriers are 5.69 and 1.97 kcal mol–1 for AQPZd and AQPZe, respectively (Table 1). As can be seen from Fig. 12c, the free-energy barrier for the AQPZd system is much larger for the passage of a water molecule that enters the pore and passes though the SF region than it is for the equivalent passage through the AQPZe system. Therefore, it is easier for a water molecule to permeate through the AQPZe pore than the AQPZd pore. Note that the relative free energy obtained using quantum mechanics is consistent with that provided by the BD-FDT.
Fig. 12.
Work done along the forward (black lines) and reverse (red lines) pulling paths: a for AQPZd; b for AQPZe. c Free-energy profiles of AQPZd (black) and AQPZe (red) estimated with the BD-FDT
Conclusions
The histidine residue in the selectivity filter (SF) region of AQPZ plays an important role in the transport of water across the membrane of Escherichia coli. In this work, we performed equilibrium molecular dynamics (MD) simulations to investigate the influences of the two protonation states and the gating mechanism of the SF. We calculated the pore radius, the minimum distance and the hydrogen bonds between the side chain of Arg189 and the side chain of His174, and the dihedral angle <Cβ–Cγ–Cδ–Nε of Arg189 in the SF region versus the simulation time. The interaction between the side chain of His174 and the side chain of Arg189 plays an important role in the SF gating mechanism. The minimum radius of the hole can be used to gauge the state of the pore. However, the dihedral angle <Cβ–Cγ–Cδ–Nε of Arg189 does not correlate with the state of the SF region. We performed steered MD to compute the free-energy profile (i.e., the potential of mean force, PMF) of a water molecule passing through the SF region. We also calculated the binding energy of one water molecule to the residues in the SF region using the Gaussian code. The results obtained using quantum mechanics are consistent with those produced by the FDT. We found that it is easier for water molecules to permeate through the SF region when His174 is in the Hse protonation state than when it is in the Hsd state.
Acknowledgments
The authors acknowledge support from the National Institutes of Health (grant no. GM084834), the UTSA Computational Biology Initiative, and the Texas Advanced Computing Center.
Contributor Information
Guodong Hu, Department of Physics, University of Texas at San Antonio, San Antonio, TX 78249, USA; Shandong Provincial Key Laboratory of Functional Macromolecular Biophysics, Dezhou 253023, China; Department of Physics, Dezhou University, Dezhou 253023, China.
Liao Y. Chen, Department of Physics, University of Texas at San Antonio, San Antonio, TX 78249, USA
Jihua Wang, Shandong Provincial Key Laboratory of Functional Macromolecular Biophysics, Dezhou 253023, China; Department of Physics, Dezhou University, Dezhou 253023, China.
References
- 1.Preston GM, Carroll TP, Guggino WB, Agre P. Science. 1992;256:385–387. doi: 10.1126/science.256.5055.385. [DOI] [PubMed] [Google Scholar]
- 2.Borgnia M, Nielsen S, Engel A, Agre P. Annu Rev Biochem. 1999;68:425–458. doi: 10.1146/annurev.biochem.68.1.425. [DOI] [PubMed] [Google Scholar]
- 3.Agre P, Kozono D. FEBS Lett. 2003;555:72–78. doi: 10.1016/s0014-5793(03)01083-4. [DOI] [PubMed] [Google Scholar]
- 4.King LS, Kozono D, Agre P. Nat Rev Mol Cell Biol. 2004;5:687–698. doi: 10.1038/nrm1469. [DOI] [PubMed] [Google Scholar]
- 5.Hub JS, Grubmuller H, de Groot BL. Handb Exp Pharmacol. 2009;190:57–76. doi: 10.1007/978-3-540-79885-9_3. [DOI] [PubMed] [Google Scholar]
- 6.Savage DF, Egea PF, Robles-Colmenares Y, O'Connell JD, III, Stroud RM. PLoS Biol. 2003;1:E72. doi: 10.1371/journal.pbio.0000072. [DOI] [PMC free article] [PubMed] [Google Scholar]
- 7.Murata K, Mitsuoka K, Hirai T, Walz T, Agre P, Heymann JB, Engel A, Fujiyoshi Y. Nature. 2000;407:599–605. doi: 10.1038/35036519. [DOI] [PubMed] [Google Scholar]
- 8.Sui HX, Han BG, Lee JK, Walian P, Jap BK. Nature. 2001;414:872–878. doi: 10.1038/414872a. [DOI] [PubMed] [Google Scholar]
- 9.Fu DX, Libson A, Miercke LJW, Weitzman C, Nollert P, Krucinski J, Stroud RM. Science. 2000;290:481–486. doi: 10.1126/science.290.5491.481. [DOI] [PubMed] [Google Scholar]
- 10.Savage DF, Stroud RM. J Mol Biol. 2007;368:607–617. doi: 10.1016/j.jmb.2007.02.070. [DOI] [PMC free article] [PubMed] [Google Scholar]
- 11.Savage DF, O'Connell JD, III, Miercke LJ, Finer-Moore J, Stroud RM. Proc Natl Acad Sci USA. 2010;107:17164–17169. doi: 10.1073/pnas.1009864107. [DOI] [PMC free article] [PubMed] [Google Scholar]
- 12.Jiang JS, Daniels BV, Fu D. J Biol Chem. 2006;281:454–460. doi: 10.1074/jbc.M508926200. [DOI] [PubMed] [Google Scholar]
- 13.Wang Y, Schulten K, Tajkhorshid E. Structure. 2005;13:1107–1118. doi: 10.1016/j.str.2005.05.005. [DOI] [PubMed] [Google Scholar]
- 14.Jensen MO, Mouritsen OG. Biophys J. 2006;90:2270–2284. doi: 10.1529/biophysj.105.073965. [DOI] [PMC free article] [PubMed] [Google Scholar]
- 15.Hashido M, Ikeguchi M, Kidera A. FEBS Lett. 2005;579:5549–5552. doi: 10.1016/j.febslet.2005.09.018. [DOI] [PubMed] [Google Scholar]
- 16.de Groot BL, Grubmuller H. Science. 2001;294:2353–2357. doi: 10.1126/science.1066115. [DOI] [PubMed] [Google Scholar]
- 17.Tajkhorshid E, Nollert P, Jensen MO, Miercke LJ, O'Connell J, Stroud RM, Schulten K. Science. 2002;296:525–530. doi: 10.1126/science.1067778. [DOI] [PubMed] [Google Scholar]
- 18.Jensen MO, Tajkhorshid E, Schulten K. Biophys J. 2003;85:2884–2899. doi: 10.1016/S0006-3495(03)74711-0. [DOI] [PMC free article] [PubMed] [Google Scholar]
- 19.Burykin A, Warshel A. Biophys J. 2003;85:3696–3706. doi: 10.1016/S0006-3495(03)74786-9. [DOI] [PMC free article] [PubMed] [Google Scholar]
- 20.Burykin A, Kato M, Warshel A. Prot Struc Funct Gen. 2003;52:412–426. doi: 10.1002/prot.10455. [DOI] [PubMed] [Google Scholar]
- 21.Kato M, Pisliakov AV, Warshel A. Proteins. 2006;64:829–844. doi: 10.1002/prot.21012. [DOI] [PubMed] [Google Scholar]
- 22.de Groot BL, Grubmuller H. Curr Opin Struct Biol. 2005;15:176–183. doi: 10.1016/j.sbi.2005.02.003. [DOI] [PubMed] [Google Scholar]
- 23.Chen H, Ilan B, Wu Y, Zhu F, Schulten K, Voth GA. Biophys J. 2007;92:46–60. doi: 10.1529/biophysj.106.091934. [DOI] [PMC free article] [PubMed] [Google Scholar]
- 24.Wang Y, Shaikh SA, Tajkhorshid E. Physiology (Bethesda) 2010;25:142–154. doi: 10.1152/physiol.00046.2009. [DOI] [PMC free article] [PubMed] [Google Scholar]
- 25.Calamita G. Mol Microbiol. 2000;37:254–262. doi: 10.1046/j.1365-2958.2000.02016.x. [DOI] [PubMed] [Google Scholar]
- 26.Borgnia MJ, Kozono D, Calamita G, Maloney PC, Agre P. J Mol Biol. 1999;291:1169–1179. doi: 10.1006/jmbi.1999.3032. [DOI] [PubMed] [Google Scholar]
- 27.Pohl P. Biol Chem. 2004;385:921–926. doi: 10.1515/BC.2004.120. [DOI] [PubMed] [Google Scholar]
- 28.Vila JA, Arnautova YA, Vorobjev Y, Scheraga HA. Proc Natl Acad Sci USA. 2011;108:5602–5607. doi: 10.1073/pnas.1102373108. [DOI] [PMC free article] [PubMed] [Google Scholar]
- 29.Cheng F, Sun H, Zhang Y, Mukkamala D, Oldfield E. J Am Chem Soc. 2005;127:12544–12554. doi: 10.1021/ja051528c. [DOI] [PubMed] [Google Scholar]
- 30.Roberts JD. ABCs of FT-NMR. University Science Books; Sausalito, CA: 2000. pp. 258–259. [Google Scholar]
- 31.Hu F, Luo W, Hong M. Science. 2010;330:505–508. doi: 10.1126/science.1191714. [DOI] [PMC free article] [PubMed] [Google Scholar]
- 32.Lu YP, Yang CY, Wang SM. J Am Chem Soc. 2006;128:11830–11839. doi: 10.1021/ja058042g. [DOI] [PubMed] [Google Scholar]
- 33.Duan LL, Tong Y, Mei Y, Zhang QG, Zhang JZH. J Chem Phys. 2007;127:145101–145106. doi: 10.1063/1.2770720. [DOI] [PubMed] [Google Scholar]
- 34.Shi SH, Hu GD, Chen JZ, Zhang SL, Zhang QG. Acta Chim Sinica. 2009;67:2791–2797. [Google Scholar]
- 35.Sotomayor M, Schulten K. Science. 2007;316:1144–1148. doi: 10.1126/science.1137591. [DOI] [PubMed] [Google Scholar]
- 36.Colizzi F, Perozzo R, Scapozza L, Recanatini M, Cavalli A. J Am Chem Soc. 2010;132:7361–7371. doi: 10.1021/ja100259r. [DOI] [PubMed] [Google Scholar]
- 37.Humphrey W, Dalke A, Schulten K. J Mol Graph. 1996;14:33–38. 27–28. doi: 10.1016/0263-7855(96)00018-5. [DOI] [PubMed] [Google Scholar]
- 38.Jorgensen WL, Chandrasekhar J, Madura JD, Impey RW, Klein ML. J Chem Phys. 1983;79:926–935. [Google Scholar]
- 39.Phillips JC, Braun R, Wang W, Gumbart J, Tajkhorshid E, Villa E, Chipot C, Skeel RD, Kale L, Schulten K. J Comput Chem. 2005;26:1781–1802. doi: 10.1002/jcc.20289. [DOI] [PMC free article] [PubMed] [Google Scholar]
- 40.MacKerell AD, Bashford D, Bellott M, Dunbrack RL, Evanseck JD, Field MJ, Fischer S, Gao J, Guo H, Ha S, Joseph-McCarthy D, Kuchnir L, Kuczera K, Lau FTK, Mattos C, Michnick S, Ngo T, Nguyen DT, Prodhom B, Reiher WE, Roux B, Schlenkrich M, Smith JC, Stote R, Straub J, Watanabe M, Wiorkiewicz-Kuczera J, Yin D, Karplus M. J Phys Chem B. 1998;102:3586–3616. doi: 10.1021/jp973084f. [DOI] [PubMed] [Google Scholar]
- 41.Feller SE, Zhang YH, Pastor RW, Brooks BR. J Chem Phys. 1995;103:4613–4621. [Google Scholar]
- 42.Tuckerman M, Berne BJ, Martyna GJ. J Chem Phys. 1992;97:1990–2001. [Google Scholar]
- 43.Darden T, York D, Pedersen L. J Chem Phys. 1993;98:10089–10092. [Google Scholar]
- 44.Park S, Schulten K. J Chem Phys. 2004;120:5946–5961. doi: 10.1063/1.1651473. [DOI] [PubMed] [Google Scholar]
- 45.Isralewitz B, Baudry J, Gullingsrud J, Kosztin D, Schulten K. J Mol Graph Model. 2001;19:13–25. doi: 10.1016/s1093-3263(00)00133-9. [DOI] [PubMed] [Google Scholar]
- 46.Chen LY. J Chem Phys. 2008;129:144113–144117. doi: 10.1063/1.2992153. [DOI] [PMC free article] [PubMed] [Google Scholar]
- 47.Chen LY, Bastien DA, Espejel HE. Phys Chem Chem Phys. 2010;12:6579–6582. doi: 10.1039/b926889h. [DOI] [PMC free article] [PubMed] [Google Scholar]
- 48.Hu G, Chen LY. Biophys Chem. 2010;153:97–103. doi: 10.1016/j.bpc.2010.10.008. [DOI] [PMC free article] [PubMed] [Google Scholar]
- 49.Chen LY. Phys Chem Chem Phys. 2011;13:6176–6183. doi: 10.1039/c0cp02799e. [DOI] [PMC free article] [PubMed] [Google Scholar]
- 50.Hirano Y, Okimoto N, Kadohira I, Suematsu M, Yasuoka K, Yasui M. Biophys J. 2010;98:1512–1519. doi: 10.1016/j.bpj.2009.12.4310. [DOI] [PMC free article] [PubMed] [Google Scholar]
- 51.Smart OS, Neduvelil JG, Wang X, Wallace BA, Sansom MSP. J Mol Graph. 1996;14:354–360. doi: 10.1016/s0263-7855(97)00009-x. [DOI] [PubMed] [Google Scholar]
- 52.Frisch MJ, Trucks GW, Schlegel HB, Scuseria GE, Robb MA, Cheeseman JR, Scalmani G, Barone V, Mennucci B, Petersson GA, Nakatsuji H, Caricato M, Li X, Hratchian HP, Izmaylov AF, Bloino J, Zheng G, Sonnenberg JL, Hada M, Ehara M, Toyota K, Fukuda R, Hasegawa J, Ishida M, Nakajima T, Honda Y, Kitao O, Nakai H, Vreven T, Montgomery Jr JA, Peralta JE, Ogliaro F, Bearpark M, Heyd JJ, Brothers E, Kudin KN, Staroverov VN, Kobayashi R, Normand J, Raghavachari K, Rendell A, Burant JC, Iyengar SS, Tomasi J, Cossi M, Rega N, Millam NJ, Klene M, Knox JE, Cross JB, Bakken V, Adamo C, Jaramillo J, Gomperts R, Stratmann RE, Yazyev O, Austin AJ, Cammi R, Pomelli C, Ochterski JW, Martin RL, Morokuma K, Zakrzewski VG, Voth GA, Salvador P, Dannenberg JJ, Dapprich S, Daniels AD, Farkas Ö , Foresman JB, Ortiz JV, Cioslowski J, Fox DJ. Gaussian 03, revision C.02. Gaussian Inc.; Wallingford: 2009. [Google Scholar]


