

Abstract
Despite the availability of combination antiretroviral therapy, at least mild cognitive dysfunction is commonly observed in HIV-infected patients, with an estimated prevalence of 35-70%. Neuropsychological studies of these HIV-associated neurocognitive disorders (HAND) have documented aberrations across a broad range of functional domains, although the basic pathophysiology remains unresolved. Some of the most common findings have been deficits in fine motor control and reduced psychomotor speed, but to date no neuroimaging studies have evaluated basic motor control in HAND. In this study, we used magnetoencephalography (MEG) to evaluate the neurophysiological processes that underlie motor planning in older HIV-infected adults and a matched, uninfected control group. MEG is a noninvasive and direct measure of neural activity with good spatiotemporal precision. During the MEG recording, participants fixated on a central crosshair and performed a finger-tapping task with the dominant hand. All MEG data was corrected for head movements, preprocessed, and imaged in the time-frequency domain using beamforming methodology. All analyses focused on the pre-movement beta desynchronization, which is known to be an index of movement planning. Our results demonstrated that HIV-1-infected patients have deficient beta desynchronization relative to controls within the left/right precentral gyri, and the supplementary motor area. In contrast, HIV-infected persons showed abnormally strong beta responses compared to controls in the right dorsolateral prefrontal cortex and medial prefrontal areas. In addition, the amplitude of beta activity in the primary and supplementary motor areas correlated with scores on the Grooved Pegboard test in HIV-infected adults. These results demonstrate that primary motor and sensory regions may be particularly vulnerable to HIV-associated damage, and that prefrontal cortices may serve a compensatory role in maintaining motor performance levels in infected patients.
Keywords: HAND, cognitive disorders, biomarker, AIDS, MEG, beta ERD
Introduction
Since the availability of potent combination antiretroviral therapy (cART), the nature of human immunodeficiency virus type one (HIV) infection has dramatically shifted from a terminal illness to a chronic manageable condition. Nonetheless, overall life expectancy still remains 10-30 years less than that of seronegative persons (Antiretroviral Therapy Cohort Collaboration 2008; Deeks 2009), and infected patients remain at an increased risk of developing HIV-associated neurocognitive disorders (HAND; Gannon et al. 2011; Heaton et al. 2010, 2011; Sacktor et al. 2002; Simioni et al. 2010). Recent studies have shown that 35-70% of all HIV-infected patients (treated and untreated) are at least subtly impaired on neuropsychological assessments of cognitive performance (Cysique and Brew 2009; Gannon et al. 2011; Heaton et al. 2010, 2011; Simioni et al. 2010; Tozzi et al. 2007). Although the overwhelming majority of these patients suffer from milder forms of HAND, as cART has sharply decreased the prevalence of the more severe HIV-associated dementia (HAD; Antinori et al. 2007; Cysique and Brew 2009; Dore et al. 2003; Heaton et al. 2010, 2011; Robertson et al. 2007).
While neuropsychological studies have documented abnormalities across a broad range of functional domains, deficits in fine motor control and reduced psychomotor speed have been some of the most common findings in HAND (Cysique and Brew 2009; Hardy and Vance 2009; Joska et al. 2010; Robertson et al. 2009; Woods et al. 2009). In fact, this was partially reflected in the original nomenclature, which included diagnostic categories for HAD (3 subtypes) and a less severe condition termed minor cognitive motor disorder (MCMD; Janssen et al., 1991). The MCMD category was phased out in 2007 with the adoption of the current classification system, which includes HAD, mild neurocognitive impairment, and asymptomatic cognitive impairment (Antinori et al., 2007). Nonetheless, motor-related deficits remain a critical problem in HIV-infected patients and are an essential feature of HAND assessment (Mind Exchange Working Group 2013). The Trail Making Test, Color Trails Test Part 2, Finger Tapping Test, and/or the Grooved Pegboard Test are the most commonly employed motor assessments (Joska 2010; Robertson et al. 2009), with outcome measures that include total completion time (for the test), average tapping rate for each hand, total pegs placed, and related measures. HIV-infected patients typically exhibit prolonged completion times (e.g., in Trail Making and Color Trails Tests) and lower average tapping rates compared to age- and often culture-based normative data (Joska 2010; Mind Exchange Working Group 2013; Robertson et al. 2009). Thus, while these tests are relatively sensitive to deficits in function, they provide only limited information on the nature of the deficit and lack specificity in regards to the neural bases of observed impairments. For example, non-motor issues like abnormal executive functioning can sharply decrease performance on measures of motor coordination and psychomotor speed, and ultimately masquerade as a pure motor deficit in the absence of extensive neuropsychological testing.
In the current study, we investigated the neural regions serving motor control in a group of aging HIV-infected patients and a matched-group of uninfected controls using magnetoencephalography (MEG). MEG is a noninvasive neurophysiological imaging method that quantifies the minute magnetic fields that naturally emanate from populations of active neural cells in the neocortex. The method has excellent temporal resolution and good spatial precision, which allows neural activity serving individual movements to be decomposed into planning, execution, and termination stages. In healthy participants, these different stages are represented by three distinct neural responses that have been widely studied (Cheyne et al. 2008; Gaetz et al. 2010, 2011; Jurkiewicz et al. 2006; Tzagarakis et al. 2010; Wilson et al. 2010, 2011). Briefly, there is an event-related desynchronization (ERD) in the beta-frequency range (14-28 Hz) that peaks before movement onset and continues slightly afterward, which is termed the pre-movement beta ERD response. There is an event-related synchronization (ERS) in the gamma-frequency range that coincides with the movement onset and is very brief (i.e., 200 ms), and finally there is a post-movement beta ERS that reaches maximum amplitude slightly after the termination of movement (Cheyne et al. 2008; Gaetz et al. 2010, 2011; Jurkiewicz et al. 2006; Tzagarakis et al. 2010; Wilson et al. 2010, 2011). This latter response is generally termed the post-movement beta rebound (PMBR). For clarity, the frequency range (e.g., beta-band) of these responses merely indicates the dominant neuronal firing rate across the population of neurons that generates the specific response.
Our primary goal in the current study was to identify the critical brain regions and neural processes that underlie the altered fine motor control and psychomotor speed typically seen in HIV-infected persons. To this end, we investigated an older population of patients comprised of both cognitively impaired and unimpaired persons according to the Frascati criteria (Antinori et al. 2007). During the MEG recording session, participants performed a MEG-compatible version of the finger tapping task with their dominant hand. We focused on an older group of patients (i.e., ~60 years-old) because HIV-infected persons are living much longer in the cART era (Hardy and Vance, 2009), and these patients may be underrepresented in research studies. Moreover, we included a mix of mildly impaired and non-impaired patients in order to capture the spectrum, while avoiding patients with severe motor deficits so that behavioral performance (e.g., accuracy) could be standardized during the MEG experiment. This standardization provided an important control for group comparisons, as significant performance differences alone can produce activation differences. No previous functional neuroimaging studies have evaluated motor activity in HIV-infected patients, although one structural imaging study reported significant cortical thinning in the primary motor, sensory, and premotor regions of patients relative to matched controls (Thompson et al. 2005). Based on these findings and our past MEG studies of motor control, we hypothesized that HIV-infected patients would show abnormally reduced pre-movement beta ERD activation in primary motor regions (e.g., precentral gyri), and that the amplitude of this activity would be significantly correlated with CD4+ T-cell counts and neuropsychological measures of motor performance in the patient group.
Methods
We evaluated 12 HIV-infected adults (9 males) and 12 uninfected matched controls (9 males). Participants in the control group were individually-matched to patients in the HIV-infected group in regards to age, sex, ethnicity, and handedness. Exclusionary criteria included any pre-existing major psychiatric or neurological disorder, active brain infection (except for HIV-1), presence of brain neoplasm or space-occupying lesion, history of head trauma, current substance abuse, and the MEG Laboratory’s standard exclusion criteria (e.g., orthodontic braces, extensive dental work, ferromagnetic implants, etc.). The study was approved by the University of Nebraska Medical Center Institutional Review Board and all participants gave written informed consent.
Neuropsychological Assessments
All patients underwent neuropsychological testing prior to the MEG recording session. The neuropsychological battery tested multiple domains and was designed to adhere to the recommendations of the Frascati consensus (Antinori et al. 2007). The assessed functional domains included gross and fine motor, language, verbal learning, verbal memory, speed of information processing, attention and working memory, and executive functioning. Correlation analyses were conducted on the MEG data and a selection of individual neuropsychological tests, including the Grooved Pegboard and Trail Making Test B, which are known to assess fine motor control and psychomotor speed and thus, were especially relevant to our primary hypotheses.
Experimental Paradigm
Throughout the movement task, participants were seated within the magnetically-shielded room with both arms resting in front of them on a tray attached to the chair body. Participants were instructed to fixate on a centrally-presented cross hair and to perform a single knuckle flexion-extension, using the right index finger, each time a dot reached the 12 o’clock position. This dot completed one full revolution, around a clock-like circle without tick marks or numbers, every 6 s (see Figure 1A) and was meant to serve as a pacing device. The precise timing of movement onset was determined by a laser beam system (see Figure 1B), whereby the initiation of movement interrupted a laser beam that extended across a groove, designed to be the finger landing area at the completion of each tap. This disruption of the laser beam functioned to break an electrical circuit, which caused a TTL pulse to be emitted. These TTL pulses were recorded, along with the MEG data, by the main acquisition computer. Each participant performed approximately 120 trials and the total recording time was ~11 min.
Figure 1.
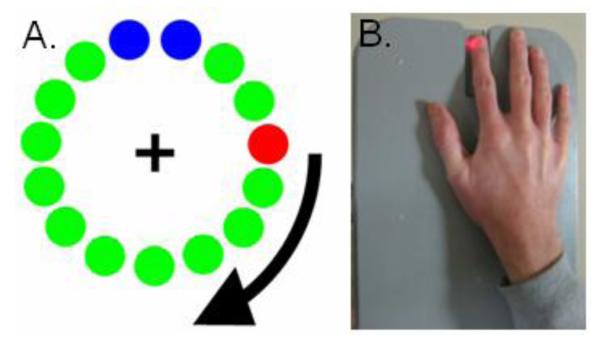
Experimental Paradigm. (A) Participants fixated on the central cross hair as the red dot moved clockwise toward the two blue dots, displacing each green dot in turn. Participants were instructed to make one finger-tap movement when the red dot was within the blue area, but only one movement per revolution. Each revolution took approximately 6 s. (B) The temporal onset of finger-tap responses were determined using a laser system. Essentially, finger movement interrupted a laser-beam that extended across a narrow groove, with the groove functioning as the finger landing area for the completion of each tap. This disruption of the laser beam was registered by the MEG system and synced with the neural data.
MEG Data Acquisition
All recordings were conducted in a one-layer magnetically-shielded room with active shielding engaged for advanced environmental noise compensation. During data acquisition, participants were monitored via real-time audio-video feeds from inside the shielded room. With an acquisition bandwidth of 0.1 – 330 Hz, neuromagnetic responses were sampled continuously at 1 kHz using an Elekta Neuromag system (Helsinki, Finland) with 306 MEG sensors, including 204 planar gradiometers and 102 magnetometers. Using the MaxFilter software (Elekta), each MEG data set was individually corrected for head motion during task performance and subjected to noise reduction using the signal space separation method with a temporal extension (Taulu and Simola 2006; Taulu et al. 2005).
MEG Coregistration & Structural MRI Processing
Prior to MEG measurement, four coils were attached to the participant’s head and the locations of these coils, together with the three fiducial points and scalp surface, were determined with a 3-D digitizer (Fastrak 3SF0002, Polhemus Navigator Sciences, Colchester, VT, USA). Once the participant was positioned for MEG recording, an electric current with a unique frequency label (e.g., 322 Hz) was fed to each of the coils. This induced a measurable magnetic field and allowed each coil to be localized in reference to the sensors throughout the recording session. Since coil locations were also known in head coordinates, all MEG measurements could be transformed into a common coordinate system. With this coordinate system (including the scalp surface points), each participant’s MEG data was coregistered with structural T1-weighted MRI data prior to source space analyses. Structural MRI data were aligned parallel to the anterior and posterior commissures and transformed into the Talairach coordinate system (Talairach and Tournoux 1988) using BrainVoyager QX (Brain Innovations, The Netherlands).
MEG Pre-Processing
Artifact rejection was based on a fixed threshold method, supplemented with visual inspection. Epochs were of 5.0 s duration (−2.0 to 3.0 s), with 0.0 s defined as movement onset and the baseline being the −2.0 to −1.2 s time window. Artifact-free epochs were transformed into the time-frequency domain using complex demodulation (resolution: 2.0 Hz, 25 ms; Hoechstetter et al. 2004; Papp and Ktonas 1977), and the resulting spectral power estimations per sensor were averaged over trials to generate time-frequency plots of mean spectral density.
MEG Source Imaging
Cortical networks were imaged through an extension of the linearly constrained minimum variance vector beamformer (Gross et al. 2001), which employs spatial filters in the frequency domain to calculate source power for the entire brain volume. The single images are derived from the cross spectral densities of all combinations of MEG sensors averaged over the time-frequency range of interest, and the solution of the forward problem for each location on a grid specified by input voxel space. Following convention, the source power in these images was normalized per subject using a separately averaged pre-stimulus noise period of equal duration and bandwidth (van Veen et al. 1997). In principle, the beamformer operator generates a spatial filter for each grid point, which passes signals without attenuation from the given neural region while minimizing interference from activity in all other brain areas. The properties of these filters are determined from the MEG covariance matrix and the forward solution for each grid point in the image space, which are used to allocate sensitivity weights to each sensor in the array for each voxel in the brain (for a review, see Hillebrand et al. 2005).
Normalized source power was computed for the time-frequency range of interest (beta ERD: 14-28 Hz, −350 to 250 ms) over the entire brain volume per participant at 4.0 × 4.0 × 4.0 mm resolution. Each subject’s functional images, which were co-registered to anatomical images prior to beamforming, were transformed into a standardized space (Talairach and Tournoux 1988) using the transform previously applied to the structural MRI volume. MEG pre-processing and imaging used the Brain Electrical Source Analysis (BESA version 5.3.2) software, and MEG-MRI coregistration used the BrainVoyager QX (Version 2.2) software.
Given the primary objective and hypotheses of this study, all MEG data analyses were focused on the pre-movement beta ERD response. This oscillatory response occurs within the 14-28 Hz frequency range, and it begins and reaches peak amplitude before movement onset, then dissipates slightly after movement commences. The other parameters of the beta ERD are equally-well characterized, as several MEG studies of healthy controls were recently conducted by our group and others (Cheyne et al. 2008; Gaetz et al. 2010; Jurkiewicz et al. 2006; Tzagarakis et al. 2010; Wilson et al. 2010, 2011). Thus, we imaged the beta ERD response (−350 to 250 ms, 14-28 Hz) using beamforming, and statistically evaluated the resulting 3D maps of functional brain activity using a mass univariate approach based on the general linear model. Briefly, the effect of group was examined using a random effects analysis, whereas task effects were examined using one-sample t-tests in each group. In both cases, the statistical parametric maps were initially thresholded and a cluster-based correction method (i.e., 40 contiguous voxels) was applied to the supra-threshold voxels to reduce the risk of false positive results.
Results
Participant Demographics, Blood Work, & Neuropsychological Measures
Mean age was 57.9 years-old (range: 50-69) in the HIV-infected group, and 58.3 years-old (range: 50-70 years) in the control group. This difference did not approach significance. All HIV-infected participants were receiving effective antiretroviral therapy and had undetectable viremia during the study. The mean duration of HIV diagnosis was 17 years (range: 10-22), and the average CD4+ T-cell count was 741 cells/mm3 (range: 267-1276). Of the 12 HIV-infected patients, six were impaired in at least two domains and thus were considered impaired according to the Frascati criteria (Antinori et al. 2007); however, only two of the twelve patients were impaired on tests of motor function.
MEG Task Effects
HIV-infected participants exhibited significant beta ERD responses near the hand knob feature of the left precentral gyrus (Yousry et al. 1997), and this activity extended posterior to include the central sulcus and left postcentral gyrus. These participants also exhibited significant beta ERD in the right precentral gyrus (extending to the postcentral gyrus) and the medial prefrontal cortices (all p’s < 0.001, cluster-corrected; see Figure 2). Uninfected controls also had significant beta ERD responses centered near the motor hand knob feature of the left precentral gyrus, which extended posterior to include aspects of the central sulcus and left postcentral gyrus. In addition, significant beta ERD was found in the right precentral gyrus and the supplementary motor area (SMA) of uninfected controls (all p’s < 0.001, cluster-corrected; see Figure 2).
Figure 2.

Beta Event-Related Desynchronizations (ERD) in Each Group. Statistical parametric maps (SPMs) showed strong beta ERD responses in the left precentral gyrus of each group, extending posterior to include areas of the postcentral gyrus. In healthy controls, strong ERD responses were also apparent in the supplementary motor area (SMA) and the right precentral gyrus, whereas HIV-infected patients had significant beta responses in the medial prefrontal cortices (not shown). All images are shown in neurological convention (Left = Left) and have been thresholded at (p < 0.001, cluster-corrected).
MEG Group Effects
Responses in the right dorsolateral prefrontal cortex (DLPFC), medial prefrontal cortices, and a small area of the left inferior frontal gyrus were significantly stronger in HIV-infected participants compared with controls (all p’s < 0.01; cluster-corrected; see Figure 3). Conversely, beta ERD responses in the SMA and the left and right precentral gyri were significantly stronger in healthy controls compared with HIV-infected participants (all p’s < 0.01, cluster-corrected; see Figure 3).
Figure 3.

Group Differences in Beta ERD Activity. Uninfected controls exhibited significantly stronger responses compared with HIV-infected patients (blue areas; p < 0.01, cluster-corrected) in the left precentral gyrus, SMA, and a small area of the right precentral gyrus (not shown). In contrast, significantly greater beta ERD responses were detected in the right dorsolateral prefrontal cortices (DLPFC), medial prefrontal cortices, and the left inferior frontal gyrus of HIV-infected patients relative to controls (orange areas; p < 0.01, cluster-corrected). All images are shown in neurological convention.
Neuropsychological, CD4, & MEG Correlations
To examine possible relationships between MEG measures of beta ERD, CD4 T-cell counts, and neuropsychological metrics of fine motor control and psychomotor speed, we conducted a series of Pearson-correlation analyses in the HIV-infected participants. To this end, we used the maximum amplitude value in each brain region where group differences were found, and the participant scores on individual neuropsychological assessments of fine motor control (Grooved Pegboard: dominant-hand raw score) and psychomotor speed (Trail Making Test A-B). Since these analyses were restricted to brain areas where significant group differences were observed, we did not correct p-values for multiple comparisons (e.g., using the Bonferroni method).
These analyses showed that performance on the Grooved Pegboard task (raw score for the dominant hand) was significantly correlated with the amplitude of beta ERD responses in the left precentral gyrus, r(12) = 0.70 (p < 0.01, two-tailed) and the SMA, r(12) = 0.79 (p < 0.01, two-tailed), but not in other brain regions of HIV-infected participants (see Figure 4). Performance on the Trail Making Test – A (HIV-infected participants) was significantly correlated with response amplitude in the left inferior frontal gyrus, r(12) = 0.58 (p < 0.05, two-tailed) and marginally in the right DLPFC, r(12) = 0.51 (p < 0.10, two-tailed). Performance on the Trail Making Test – B was correlated with beta response amplitude in the medial prefrontal cortices, r(12) = 0.66 (p < 0.05, two-tailed) and the right DLPFC, r(12) = 0.75 (p < 0.01, two-tailed) in HIV-infected participants. Beta ERD amplitude in other brain regions was not correlated with performance on the Trail Making Tests (A-B). Finally, CD4+ T-cell counts at the time of MEG recording were negatively correlated with beta ERD amplitude in the SMA, r(12) = −0.48 (p = 0.11, two-tailed), which indicates that patients with the highest CD4 counts had the strongest beta ERD responses in the SMA (i.e., were more like controls). However, this effect was only marginal and CD4 count did not correlate with activity in other brain areas, or performance on neuropsychological measures of psychomotor speed or fine motor control.
Figure 4.

Correlation of Neuropsychological Assessments and Beta ERD Amplitude. Correlation between raw scores on the Grooved Pegboard Test (dominant hand; x-axis) and the amplitude of beta ERD responses (y-axis) in the left precentral gyrus, SMA, left inferior frontal gyrus, right dorsolateral prefrontal cortices, and the medial prefrontal area in HIV-infected patients (top left). As shown, there was a significant positive correlation between Grooved Pegboard scores and activity in the left precentral gyrus and SMA (p < 0.01, two-tailed). Below, correlations between the amplitude of beta ERD responses (y-axis) and the raw scores on the Trail Making Test – Part A (left) and Part B (right) are shown. There was a significant positive correlation between performance on the Trail Making Test – A and beta ERD in the left inferior frontal gyrus (p < 0.05, two-tailed) and marginally in the right DLPFC (p < 0.10, two-tailed). Likewise, there was a significant positive correlation between Trail Making Test – B scores and activity in the dorsolateral prefrontal cortices (p < 0.01, two-tailed) and the medial prefrontal cortices (p < 0.05, two-tailed) in HIV-infected patients. The color legend appears on the top right.
Discussion
Our most important findings were the sharply reduced beta ERD responses in the primary motor cortices and the SMA of HIV-infected participants. Moreover, these reductions in key regions for motor control were accompanied by significantly stronger responses in higher-order brain centers, such as the right DLPFC and medial prefrontal cortices, which may reflect some sort of compensatory mechanism in HIV-infected participants. The motor-related beta ERD response, which begins and reaches peak amplitude before movement onset, has been widely acknowledged as a marker of motor planning (e.g., Gaetz et al. 2010; Jurkiewicz et al. 2006; Tzagarakis et al. 2010; Wilson et al. 2010, 2011) and would be an obvious candidate for such compensatory processing. In addition, we found that activity in these higher-order brain areas was correlated with performance on neuropsychological measures of psychomotor speed, whereas assessments of fine motor control (i.e., Grooved Pegboard) were more closely tied to beta ERD responses in the primary and supplementary motor areas. Below, we discuss the implications of these findings for understanding the neural circuitry of motor-related deficits in HIV-infected participants (Cysique and Brew 2009; Hardy and Vance 2009; Joska et al. 2010; Woods et al. 2009), and more generally for neuroimaging studies of HAND.
Uninfected controls generated a strong beta ERD response slightly before movement onset in the left and right primary motor cortex, and the SMA in this study. These results are consistent with many prior studies of healthy adults and children (Gaetz et al. 2010; Jurkiewicz et al. 2006; Tzagarakis et al. 2010; Wilson et al. 2010, 2011; among others), which have characterized this response as a marker of movement planning. Compared with controls, HIV-infected participants exhibited a similar beta ERD response, although its magnitude was significantly diminished in primary motor cortices (bilaterally) and the SMA. These results are consistent with recent reports that used functional magnetic resonance imaging (fMRI) to investigate visual areas. Ances and colleagues (2009, 2010) showed reduced activation in the primary visual cortices during a basic visual stimulation task, and decreased resting cerebral-blood-flow to the same visual areas in a large group of HIV-infected patients relative to a group of uninfected healthy controls (Ances et al. 2009, 2010). While the current observations pertain to the motor cortices, both primary visual and primary motor areas are considered modality-specific, non-association areas and thus, share at least some parallels. Furthermore, there is growing evidence that the distinction between association and non-association cortices is vital to understanding HIV-related brain abnormalities (Chang et al. 2004), as brain areas within each category exhibit a core pattern of dysfunction (discussed below). Ances et al. (2010) also reported comparable abnormalities in cognitively-impaired and unimpaired patients in visual regions, which is conceptually supportive of our findings in a similarly mixed (i.e., cognitively-impaired and un-impaired) HIV-infected sample. Essentially, we observed significant differences in the core centers of motor control, yet our patients were unimpaired or only mildly impaired on neuropsychological tests of motor function. We specifically focused on this group (i.e., mildly or unimpaired) to prevent performance differences from confounding our MEG group comparisons. Interestingly, in the current study, the amplitude of beta ERD responses in the left primary motor cortices and SMA of HIV-infected patients was significantly correlated with neuropsychological assessments of fine motor control with the same dominant hand. In other words, patients who performed the best on neuropsychological measures of fine motor control also had the strongest beta ERD responses in the left primary motor cortex and SMA. Thus, while MEG abnormalities may be detectable in neuropsychologically “normal” patients, our data suggests that certain MEG indices scale with the severity of impairment. Future studies should examine the nature of this relationship (e.g., linear, nonlinear) as it could be harnessed as a diagnostic marker.
In contrast to the pattern seen in primary motor areas, HIV-infected patients had stronger beta responses compared with controls in the right DLPFC, medial prefrontal cortices, and the left inferior frontal gyrus. Activation in these brain regions is not generally reported in normative studies of finger-tapping (e.g., Cheyne et al. 2008; Gaetz et al. 2010, 2011; Jurkiewicz et al. 2006; Tzagarakis et al. 2010; Wilson et al. 2010, 2011), which may indicate that these regions serve an active compensatory role in HIV-infected patients. Essentially, these participants had reduced motor planning responses in the primary motor cortices and the SMA, yet they continued to perform normally on the finger-tapping task, which suggests some sort of active compensatory mechanism was likely in place. Consistent with these data, several fMRI studies have reported greater activation in the frontal and prefrontal cortices during attention and working memory tasks in HIV-infected participants relative to uninfected controls (Chang et al. 2001, 2004, 2008; Ernst et al. 2002, 2009). Additionally, a few of these studies used parametric working memory tasks and showed that patients exhibit larger increases in activation as a function of task difficulty (i.e., memory set size), with performance remaining the same as that observed in uninfected controls (Chang et al. 2004, 2008; Ernst et al. 2009). In other words, task performance remained equal between patients and controls, but the amplitude of neural responses in prefrontal cortices and other association areas increased significantly more in HIV-infected patients as task difficulty increased. This pattern clearly suggests that neural activity in the prefrontal cortices is serving an active compensatory role, and that it may allow the HIV-infected patients to maintain a high level of task performance. In contrast, Melrose et al. (2008) reported decreased left prefrontal and left caudate activation during a picture sequencing task in HIV-infected patients who had mild motor deficits relative to healthy controls. Patients in this study, however, performed less accurately than controls (p = 0.07) in the picture sequencing task (Melrose et al. 2008), which at least partially supports the notion that prefrontal hyper-activation is compensatory in HIV-infected patients. Finally, a recent study of tissue specimens suggested that downregulation of Type 2 dopamine receptor mRNA in prefrontal regions may also serve a compensatory role in HIV-infection (Gelman et al. 2012). Such downregulation in the prefrontal cortices was correlated with neuropsychological function in several cognitive domains (including motor), and occurred primarily in HIV-infected patients who were cognitively unimpaired, and not in patients with HIV-encephalitis or significant neurocognitive impairments (Gelman et al. 2012). In the current study, activation in the prefrontal cortices presumably reflects additional processing in HIV-infected patients, and perhaps stronger or more direct modulation of movement generating centers in the primary motor cortex. Since patients did not show a separate activation maxima in the SMA, as controls did, the DLPFC may compensate for, or replace, SMA function by directly interacting with the primary motor cortices. The notion that these higher-order brain centers play a distinct role in task performance, from that of the primary and supplementary motor areas, is supported by our neuropsychological data. Briefly, whereas performance on the Grooved Pegboard correlated with activation in the left primary motor cortices and SMA, performance on the Trail Making Test – Part B correlated with beta ERD amplitude in the right DLPFC and medial prefrontal cortices. These findings suggest that neural activity in prefrontal areas is more tightly linked to psychomotor speed, while that in primary motor cortex and the SMA is more closely connected to fine motor control. However, this distinction should be understood as a gradient, and presumably all of these brain areas contribute to all aspects of motor performance. Lastly, it is worth noting that we recently observed abnormal activation in the frontal-eye fields of HIV-infected patients during a visual processing task (unpublished data). The frontal-eye fields overlap and are spatially contiguous with the SMA, which may suggest that this brain region is especially affected in HIV-infection. The SMA was also the only brain region in the current study where the peak activation amplitude was marginally correlated with CD4+ cell counts.
More broadly, the current study has several parallels with neurophysiological findings in the human electroencephalography (EEG) and monkey SIV (simian immunodeficiency virus) literature. Many early EEG studies showed that the amplitude of the P300 event-related potential was abnormally reduced in HIV-infected patients (Arendt et al. 1993; Egan et al. 1993; Fein et al. 1995; Goodin et al. 1990; Ollo et al. 1991). The P300 is thought to reflect attention and working memory processes (Johnson 1988; Polich 1998), and is sensitive to dementia (Polich et al. 1986, 1990). A more recent EEG study confirmed these P300 findings and found that oscillatory activity in the delta, theta, and global band (1-70 Hz) was significantly stronger in the frontal electrodes of HIV-infected patients compared with healthy controls, while alpha activity was abnormally reduced in the central-parietal electrodes of the same patients (Polich et al. 2000). These data are largely consistent with our findings of stronger frontal activity and weaker central-parietal activity in HIV-infected patients, although we focused on the beta-band and the findings of Polich et al. (2000) were mostly restricted to alpha and lower bands. One caveat with these previous investigations is that it is unclear whether the patients were being treated with ART, as many studies do not discuss the treatment status of patients. In regards to the monkey SIV data, early studies showed abnormal motor behavior in SIV-infected monkeys, and delayed latencies in brainstem auditory-evoked potentials (Fox et al. 2000). Such behavioral aberrations in basic motor function were widely replicated (Cheney et al. 2008), and numerous studies have shown aberrant motor-evoked potentials in SIV-infected monkeys (Raymond et al. 1998, 1999, 2000). Thus, the current findings are broadly consistent with studies of motor function in the SIV monkey model of neuroAIDS, and neurophysiological data using EEG in HIV-infected patients.
Previous functional and structural neuroimaging studies have improved understanding of the neural underpinnings of HAND, but prior to the current investigation no functional imaging study had examined motor control or general motor function in HIV-infected patients. However, one high-resolution, whole-brain, structural imaging study did report reduced cortical thickness throughout the primary motor and somatosensory cortices, the SMA, and premotor areas in HIV-infected patients (Thompson et al. 2005). Thus, the functional abnormalities observed here were not completely unexpected. In regards to previous MEG studies, only two have investigated patients with HIV/AIDS. One reported abnormal mutual information between MEG sensors in the anterior right part of the helmet and those in the posterior left part. Measures of mutual information are thought to reflect connectivity, thus these findings suggest abnormal functional connectivity between right frontal regions and left posterior areas in HIV patients (Becker et al., 2012a). However, caution is warranted as sensor-level MEG data (i.e., magnetic field strength measurements) contains neural activity from a mix of many different brain areas, and it is tenuous to link such activity to specific brain regions. Another relevant MEG study examined measurement reliability, and provided preliminary evidence that broadband sensor-level data had good test-retest reliability after ~24 weeks in both HIV-infected patients and uninfected controls (Becker et al. 2012b). Such findings are strongly supportive of using MEG methods to develop biomarkers for the early identification of HAND, and the current study also makes important contributions to this long-term goal.
In summary, we evaluated whole-brain neurophysiological activity using MEG in HIV-infected participants and a group of uninfected controls who were performing a finger-tapping task. Our primary findings were that infected patients have abnormal activation in the right DLPFC, medial prefrontal, bilateral primary motor cortices, and the SMA. HIV-infected patients had stronger responses in the right DLPFC and medial prefrontal areas, and the amplitude of this activity correlated with neuropsychological performance on the Trail Making Test – B, which is generally considered a measure of psychomotor speed. In contrast, HIV-infected patients had weaker activation in the SMA and primary motor cortices, and the amplitude of these responses correlated with performance on the Grooved Pegboard Test, which is an assessment of fine motor control. Lastly, the current study is not without limitations. All of our patients were undergoing combination antiretroviral therapy, and the effects of therapy on the MEG signal are unknown. In addition, some of our patients had a history of drug or alcohol use, which may have a long-term impact on cortical physiology that is not directly related to HIV. We also studied only older adults, and our findings cannot be directly generalized to younger patients who have been infected for a shorter period of time. Finally, our sample size was rather small compared to previous fMRI studies, although it is comparable to many MEG studies in psychiatry and neurology. Future studies should use larger samples and evaluate the effects of antiretroviral treatment and infection duration.
Acknowledgements
This work was supported by NIH grant P30 MH062261 (HSF). The Center for Magnetoencephalography at the University of Nebraska Medical Center was founded through an endowment from an anonymous donor. We would like to thank our participants for volunteering.
Footnotes
The authors declare that they have no conflict of interest.
References
- Ances BM, Sisti D, Vaida F, Liang CL, Leontiev O, Perthen JE, et al. Resting cerebral blood flow: a potential biomarker of the effects of HIV in the brain. Neurology. 2009;73:702–8. doi: 10.1212/WNL.0b013e3181b59a97. [DOI] [PMC free article] [PubMed] [Google Scholar]
- Ances BM, Vaida F, Yeh MJ, Liang CL, Buxton RB, Letendre S, et al. HIV infection and aging independently affect brain function as measured by functional magnetic resonance imaging. J Infect Dis. 2010;201:336–40. doi: 10.1086/649899. [DOI] [PMC free article] [PubMed] [Google Scholar]
- Antinori A, Arendt G, Becker JT, Brew BJ, Byrd DA, Cherner M, et al. Updated research nosology for HIV-associated neurocognitive disorders. Neurology. 2007;69:1789–99. doi: 10.1212/01.WNL.0000287431.88658.8b. [DOI] [PMC free article] [PubMed] [Google Scholar]
- Antiretroviral Therapy Cohort Collaboration Life expectancy of individuals on combination antiretroviral therapy in high-income countries: A collaborative analysis of 14 cohort studies. Lancet. 2008;372:293–9. doi: 10.1016/S0140-6736(08)61113-7. [DOI] [PMC free article] [PubMed] [Google Scholar]
- Arendt G, Hefter H, Jablonowski H. Acoustically evoked event-related potentials in HIV-associated dementia. Electroenceph Clin Neurophysiol. 1993;86:152–160. doi: 10.1016/0013-4694(93)90002-d. [DOI] [PubMed] [Google Scholar]
- Becker JT, Bajo R, Fabrizio M, Sudre G, Cuesta P, Aizenstein HJ, et al. Functional connectivity measured with magnetoencephalography identifies persons with HIV disease. Brain Imaging Behav. 2012a;6(3):366–373. doi: 10.1007/s11682-012-9149-4. [DOI] [PMC free article] [PubMed] [Google Scholar]
- Becker JT, Fabrizio M, Sudre G, Haridis A, Ambrose T, Aizenstein HJ, et al. Potential utility of resting-state magnetoencephalography as a biomarker of CNS abnormality in HIV disease. J Neurosci Methods. 2012b;206(2):176–82. doi: 10.1016/j.jneumeth.2012.02.022. [DOI] [PMC free article] [PubMed] [Google Scholar]
- Chang L, Tomasi D, Yakupov R, Lozar C, Arnold S, Caparelli E, Ernst T. Adaptation of the attention network in human immunodeficiency virus brain injury. Ann Neurol. 2004;56(2):259–72. doi: 10.1002/ana.20190. [DOI] [PubMed] [Google Scholar]
- Chang L, Speck O, Miller EN, Braun J, Jovicich J, Koch C, et al. Neural correlates of attention and working memory deficits in HIV patients. Neurology. 2001;57:1001–7. doi: 10.1212/wnl.57.6.1001. [DOI] [PubMed] [Google Scholar]
- Chang L, Yakupov R, Nakama H, Stokes B, Ernst T. Antiretroviral treatment is associated with increased attentional load-dependent brain activation in HIV patients. J Neuroimmune Pharmacol. 2008;3:95–104. doi: 10.1007/s11481-007-9092-0. [DOI] [PMC free article] [PubMed] [Google Scholar]
- Cheyne D, Bells S, Ferrari P, Gaetz W, Bostan AC. Self-paced movements induce high-frequency gamma oscillations in primary motor cortex. Neuroimage. 2008;42:332–42. doi: 10.1016/j.neuroimage.2008.04.178. [DOI] [PubMed] [Google Scholar]
- Cheney PD, Riazi M, Marcario JM. Behavioral and neurophysiological hallmarks of simian immunodeficiency virus infection in macaque monkeys. J Neurovirol. 2008;14(4):301–308. doi: 10.1080/13550280802116322. [DOI] [PubMed] [Google Scholar]
- Cysique LA, Brew BJ. Neuropsychological functioning and antiretroviral treatment in HIV/AIDS: A review. Neuropsychol Rev. 2009;19:169–85. doi: 10.1007/s11065-009-9092-3. Review. [DOI] [PubMed] [Google Scholar]
- Deeks SG. Immune dysfunction, inflammation, and accelerated aging in patients on antiretroviral therapy. Top HIV Med. 2009;17:118–23. [PubMed] [Google Scholar]
- Dore GJ, McDonald A, Li Y, Kaldor JM, Brew BJ, National HIV Surveillance Committee Marked improvement in survival following AIDS dementia complex in the era of highly active antiretroviral therapy. AIDS. 2003;17:1539–45. doi: 10.1097/00002030-200307040-00015. [DOI] [PubMed] [Google Scholar]
- Gaetz W, Edgar JC, Wang DJ, Roberts TP. Relating MEG measured motor cortical oscillations to resting γ-aminobutyric acid (GABA) concentration. Neuroimage. 2011;55:616–21. doi: 10.1016/j.neuroimage.2010.12.077. [DOI] [PMC free article] [PubMed] [Google Scholar]
- Gaetz W, Macdonald M, Cheyne D, Snead OC. Neuromagnetic imaging of movement-related cortical oscillations in children and adults: age predicts post-movement beta rebound. Neuroimage. 2010;51:792–807. doi: 10.1016/j.neuroimage.2010.01.077. [DOI] [PubMed] [Google Scholar]
- Gannon P, Khan MZ, Kolson DL. Current understanding of HIV-associated neurocognitive disorders pathogenesis. Curr Opin Neurol. 2011;24:275–83. doi: 10.1097/WCO.0b013e32834695fb. Review. [DOI] [PMC free article] [PubMed] [Google Scholar]
- Egan VG, Chiswick A, Brettle R, Goodwin G. The Edinburgh cohort of HIV-positive drug users: the relationship between auditory P3 latency, cognitive function and self-related mood. Psychol Med. 1993;23:613–622. doi: 10.1017/s0033291700025393. [DOI] [PubMed] [Google Scholar]
- Ernst T, Chang L, Jovicich J, Ames N, Arnold S. Abnormal brain activation on functional MRI in cognitively asymptomatic HIV patients. Neurology. 2002;59(9):1343–9. doi: 10.1212/01.wnl.0000031811.45569.b0. [DOI] [PubMed] [Google Scholar]
- Ernst T, Yakupov R, Nakama H, Crocket G, Cole M, Watters M, et al. Declined neural efficiency in cognitively stable human immunodeficiency virus patients. Ann Neurol. 2009;65:316–25. doi: 10.1002/ana.21594. [DOI] [PMC free article] [PubMed] [Google Scholar]
- Fein G, Biggines CA, MacKay S. Alcohol abuse and HIV infection have additive effects on frontal cortex function as measured by auditory evoked potential P3a latency. Biol Psychiat. 1995;37:183–195. doi: 10.1016/0006-3223(94)00119-N. [DOI] [PubMed] [Google Scholar]
- Fox HS, Weed MR, Huitron-Resendiz S, Baig J, Horn TF, Dailey PJ, et al. Antiviral treatment normalizes neurophysiological but not movement abnormalities in simian immunodeficiency virus-infected monkeys. J Clin Invest. 2000;106(1):37–45. doi: 10.1172/JCI9102. [DOI] [PMC free article] [PubMed] [Google Scholar]
- Gelman BB, Lisinicchia JG, Chen T, Johnson KM, Jennings K, Freeman DH, Jr, Soukup VM. Prefrontal dopaminergic and enkephalinergic synaptic accommodation in HIV-associated neurocognitive disorders and encephalitis. J Neuroimmune Pharmacol. 2012;7(3):686–700. doi: 10.1007/s11481-012-9345-4. [DOI] [PMC free article] [PubMed] [Google Scholar]
- Goodin DS, Aminoff MJ, Chernoff DN, Hollander H. Long latency event-related potentials in patients infected with human immunodeficiency virus. Ann Neurol. 1990;27:414–419. doi: 10.1002/ana.410270409. [DOI] [PubMed] [Google Scholar]
- Gross J, Kujala J, Hamalainen M, Timmermann L, Schnitzler A, Salmelin R. Dynamic imaging of coherent sources: studying neural interactions in the human brain. Proc Natl Acad Sci U S A. 2001;98:694–699. doi: 10.1073/pnas.98.2.694. [DOI] [PMC free article] [PubMed] [Google Scholar]
- Hardy DJ, Vance DE. The neuropsychology of HIV/AIDS in older adults. Neuropsychol Rev. 2009;19:263–72. doi: 10.1007/s11065-009-9087-0. [DOI] [PubMed] [Google Scholar]
- Heaton RK, Clifford DB, Franklin DR, Jr, Woods SP, Ake C, Vaida F, et al. HIV-associated neurocognitive disorders persist in the era of potent antiretroviral therapy: CHARTER Study. Neurology. 2010;75:2087–96. doi: 10.1212/WNL.0b013e318200d727. [DOI] [PMC free article] [PubMed] [Google Scholar]
- Heaton RK, Franklin DR, Ellis RJ, McCutchan JA, Letendre SL, Leblanc S, et al. HIV-associated neurocognitive disorders before and during the era of combination antiretroviral therapy: differences in rates, nature, and predictors. J Neurovirol. 2011;17:3–16. doi: 10.1007/s13365-010-0006-1. [DOI] [PMC free article] [PubMed] [Google Scholar]
- Hillebrand A, Singh KD, Holliday IE, Furlong PL, Barnes GR. A new approach to neuroimaging with magnetoencephalography. Hum Brain Mapp. 2005;25:199–211. doi: 10.1002/hbm.20102. [DOI] [PMC free article] [PubMed] [Google Scholar]
- Hoechstetter K, Bornfleth H, Weckesser D, Ille N, Berg P, Scherg M. BESA source coherence: a new method to study cortical oscillatory coupling. Brain Topogr. 2004;16:233–238. doi: 10.1023/b:brat.0000032857.55223.5d. [DOI] [PubMed] [Google Scholar]
- Janssen RS, Cornblath DR, Epstein LG, McArthur J, Price RW. Nomenclature and research case definitions for neurological manifestations of human immunodeficiency virus type-1 (HIV-1) infection. Report of a Working Group of the American Academy of Neurology AIDS Task Force. Neurology. 1991;41:778–85. doi: 10.1212/wnl.41.6.778. [DOI] [PubMed] [Google Scholar]
- Johnson R. The amplitude of the P300 component of the event-related potentials: Review and synthesis. In: Ackles P, Jennings JR, Coles MGH, editors. Advances in Psychophysiology: A Research Annual, 3. JAI Press, Inc; Greenwich, CT: 1988. pp. 69–137. [Google Scholar]
- Joska JA, Gouse H, Paul RH, Stein DJ, Flisher AJ. Does highly active antiretroviral therapy improve neurocognitive function? A systematic review. J Neurovirol. 2010;6:101–14. doi: 10.3109/13550281003682513. Review. [DOI] [PubMed] [Google Scholar]
- Jurkiewicz MT, Gaetz WC, Bostan AC, Cheyne D. Post-movement beta rebound is generated in motor cortex: evidence from neuromagnetic recordings. Neuroimage. 2006;32:1281–89. doi: 10.1016/j.neuroimage.2006.06.005. [DOI] [PubMed] [Google Scholar]
- Melrose RJ, Tinaz S, Castelo JM, Courtney MG, Stern CE. Compromised fronto-striatal functioning in HIV: an fMRI investigation of semantic event sequencing. Behav Brain Res. 2008;188(2):337–47. doi: 10.1016/j.bbr.2007.11.021. [DOI] [PubMed] [Google Scholar]
- The Mind Exchange Working Group Assessment, diagnosis, and treatment of HIV-associated neurocognitive disorder: A consensus report of the mind exchange program. Clin Infect Dis. 2013 Jan 10; doi: 10.1093/cid/cis975. [Epub ahead of print] PubMed PMID: 23175555. [DOI] [PMC free article] [PubMed] [Google Scholar]
- Ollo C, Johnson R, Grafman J. Signs of cognitive change in HIV disease: An event-related brain potential study. Neurology. 1991;41:209–215. doi: 10.1212/wnl.41.2_part_1.209. [DOI] [PubMed] [Google Scholar]
- Papp N, Ktonas P. Critical evaluation of complex demodulation techniques for the quantification of bioelectrical activity. Biomed Sci Instrum. 1977;13:135–143. [PubMed] [Google Scholar]
- Polich J. P300 clinical utility and control of variability. J Clin Neurophysiol. 1998;15:14–33. doi: 10.1097/00004691-199801000-00004. [DOI] [PubMed] [Google Scholar]
- Polich J, Ehlers CL, Otis S, Mandell AJ, Bloom FE. P300 latency reflects the degree of cognitive decline in dementing illness. Electroenceph Clin Neurophysiol. 1986;63:138–144. doi: 10.1016/0013-4694(86)90007-6. [DOI] [PubMed] [Google Scholar]
- Polich J, Ilan A, Poceta JS, Mitler MM, Darko DF. Neuroelectric assessment of HIV: EEG, ERP, and viral load. Int J Psychophysiol. 2000;38(1):97–108. doi: 10.1016/s0167-8760(00)00133-1. [DOI] [PubMed] [Google Scholar]
- Pollock VE, Schneider L, Lyness S. EEG amplitudes in health, late middle-aged, and elderly adults: normality of the distributions and correlations with age. Electroenceph Clin Neurophysiol. 1990;75:276–288. doi: 10.1016/0013-4694(90)90106-t. [DOI] [PubMed] [Google Scholar]
- Raymond LAM, Wallace D, Berman NEJ, Marcario J, Foresman L, Joag SV, et al. Auditory brainstem responses in a rhesus macaque model of neuro-AIDS. J Neuro Virol. 1998;4:512–520. doi: 10.3109/13550289809113495. [DOI] [PubMed] [Google Scholar]
- Raymond LAM, Wallace D, Berman NEJ, Marcario J, Foresman L, Joag SV, et al. Motor evoked potentials in a rhesus macaque model of neuro-AIDS. J Neuro Virol. 1999;5:217–231. doi: 10.3109/13550289909015808. [DOI] [PubMed] [Google Scholar]
- Raymond LAM, Wallace D, Zhou J, Raghavan R, Marcario JK, Johnson JK, et al. Sensory evoked potentials in SIV-infected monkeys with rapidly and slowly progressing disease. AIDS Res Hum Retroviruses. 2000;16:1163–1173. doi: 10.1089/088922200415018. [DOI] [PubMed] [Google Scholar]
- Robertson K, Liner J, Heaton R. Neuropsychological assessment of HIV-infected populations in international settings. Neuropsychol Rev. 2009;19:232–49. doi: 10.1007/s11065-009-9096-z. [DOI] [PMC free article] [PubMed] [Google Scholar]
- Robertson KR, Smurzynski M, Parsons TD, Wu K, Bosch RJ, Wu J, et al. The prevalence and incidence of neurocognitive impairment in the HAART era. AIDS. 2007;21:1915–21. doi: 10.1097/QAD.0b013e32828e4e27. [DOI] [PubMed] [Google Scholar]
- Sacktor N, McDermott MP, Marder K, Schifitto G, Selnes OA, McArthur JC, et al. HIV-associated cognitive impairment before and after the advent of combination therapy. J Neurovirol. 2002;8:136–42. doi: 10.1080/13550280290049615. [DOI] [PubMed] [Google Scholar]
- Simioni S, Cavassini M, Annoni JM, Rimbault Abraham A, Bourquin I, Schiffer V, et al. Cognitive dysfunction in HIV patients despite long-standing suppression of viremia. AIDS. 2010;24:1243–50. doi: 10.1097/QAD.0b013e3283354a7b. [DOI] [PubMed] [Google Scholar]
- Talairach G, Tournoux P. Co-planar stereotaxic atlas of the human brain. Thieme; New York: 1988. [Google Scholar]
- Taulu S, Simola J, Kajola M. Applications of the signal space separation method (SSS) IEEE Trans Signal Process. 2005;53:3359–3372. [Google Scholar]
- Taulu S, Simola J. Spatiotemporal signal space separation method for rejecting nearby interference in MEG measurements. Phys Med Biol. 2006;51:1759–1768. doi: 10.1088/0031-9155/51/7/008. [DOI] [PubMed] [Google Scholar]
- Thompson PM, Dutton RA, Hayashi KM, Toga AW, Lopez OL, Aizenstein HJ, Becker JT. Thinning of the cerebral cortex visualized in HIV/AIDS reflects CD4+ T lymphocyte decline. Proc Natl Acad Sci U S A. 2005;102:15647–52. doi: 10.1073/pnas.0502548102. [DOI] [PMC free article] [PubMed] [Google Scholar]
- Tozzi V, Balestra P, Bellagamba R, Corpolongo A, Salvatori MF, Visco-Comandini U, et al. Persistence of neuropsychologic deficits despite long-term highly active antiretroviral therapy in patients with HIV-related neurocognitive impairment: Prevalence and risk factors. J Acquir Immune Defic Syndr. 2007;45:174–82. doi: 10.1097/QAI.0b013e318042e1ee. [DOI] [PubMed] [Google Scholar]
- Tzagarakis C, Ince NF, Leuthold AC, Pellizzer G. Beta-band activity during motor planning reflects response uncertainty. J Neurosci. 2010;30:11270–7. doi: 10.1523/JNEUROSCI.6026-09.2010. [DOI] [PMC free article] [PubMed] [Google Scholar]
- van Veen BD, van Drongelen W, Yuchtman M, Suzuki A. Localization of brain electrical activity via linearly constrained minimum variance spatial filtering. IEEE Trans Biomed Eng. 1997;44:867–880. doi: 10.1109/10.623056. [DOI] [PubMed] [Google Scholar]
- Wilson TW, Slason E, Asherin RM, Kronberg E, Reite ML, Teale PD, Rojas DC. An extended motor network generates beta and gamma oscillatory perturbations during development. Brain Cogn. 2010;73:75–84. doi: 10.1016/j.bandc.2010.03.001. [DOI] [PMC free article] [PubMed] [Google Scholar]
- Wilson TW, Slason E, Asherin RM, Kronberg E, Teale PD, Reite ML, Rojas DC. Abnormal gamma and beta MEG activity during finger movements in early-onset psychosis. Dev Neuropsychol. 2011;36:596–613. doi: 10.1080/87565641.2011.555573. [DOI] [PMC free article] [PubMed] [Google Scholar]
- Woods SP, Moore DJ, Weber E, Grant I. Cognitive neuropsychology of HIV-associated neurocognitive disorders. Neuropsychol Rev. 2009;19:152–68. doi: 10.1007/s11065-009-9102-5. [DOI] [PMC free article] [PubMed] [Google Scholar]
- Yousry TA, Schmid UD, Alkadhi H, Schmidt D, Peraud A, Buettner A, Winkler P. Localization of the motor hand area to a knob on the precentral gyrus. A new landmark. Brain. 1997;120:141–57. doi: 10.1093/brain/120.1.141. [DOI] [PubMed] [Google Scholar]