

Abstract
Background
Demographic and policy changes appear to be increasing the complexity of consultations in general practice.
Aim
To describe the number and types of problems discussed in general practice consultations, differences between problems raised by patients or doctors, and between problems discussed and recorded in medical records.
Design and setting
Cross-sectional study based on video recordings of consultations in 22 general practices in Bristol and North Somerset.
Method
Consultations were examined between 30 representative GPs and adults making a pre-booked day-time appointment. The main outcome measures were number and types of problems and issues discussed; who raised each problem/issue; consultation duration; whether problems were recorded and coded.
Results
Of 318 eligible patients, 229 (72.0%) participated. On average, 2.5 (95% CI = 2.3 to 2.6) problems were discussed in each consultation, with 41% of consultations involving at least three problems. Seventy-two per cent (165/229) of consultations included problems in multiple disease areas. Mean consultation duration was 11.9 minutes (95% CI = 11.2 to 12.6). Most problems discussed were raised by patients, but 43% (99/229) of consultations included problems raised by doctors. Consultation duration increased by 2 minutes per additional problem. Of 562 problems discussed, 81% (n = 455) were recorded in notes, but only 37% (n = 206) were Read Coded.
Conclusion
Consultations in general practice are complex encounters, dealing with multiple problems across a wide range of disease areas in a short time. Additional problems are dealt with very briefly. GPs, like patients, bring an agenda to consultations. There is systematic bias in the types of problems coded in electronic medical records databases.
Keywords: communication, consultation, family practice, general practice, office visits, video-recording
INTRODUCTION
General practice in most countries has been based historically on providing short consultations to provide accessible treatment for common health problems, while identifying patients with serious problems requiring specialist referral. Several trends are challenging this approach. The ageing population and the shift of work from hospitals into the community mean that the main role of general practice is now managing chronic conditions.1 To improve quality of care, managing chronic conditions has become highly structured, based on evidence-based guidelines, with adherence incentivised through pay-for-performance schemes.2 However, most patients consulting in general practice have multiple coexisting chronic conditions, or multimorbidity,3 which means that a large number of guidelines and incentivised actions could apply to each patient encountered in typical consultations.4,5
These trends are likely to have an impact on the content and complexity of general practice consultations. Clinicians may be expected to undertake screening, health promotion, and chronic disease management alongside responding to the patient’s presenting complaints.6 Given that each patient may have multiple chronic conditions, typical consultations may require consideration of a wide range of problems, some raised by the patient and some by the doctor. It can be impossible to adequately deal with all these problems within a short time-limited consultation, so prioritisation is sometimes necessary.7
There is a long history of research to describe the clinical content of general practice, for example the national morbidity studies in the UK8, the BEACH study in Australia,9 and the CONTENT project in Germany10. However, fewer studies have explored the number of different problems dealt with at each consultation. Most of these have been based on analysis of medical records or encounter forms completed by GPs11–14 (an approach which assumes that doctor’s records capture the full content of consultations), whereas those based on direct observation or video recordings15–18 have been limited in scope and have had methodological limitations, in particular providing little information about the reliability of the process of coding consultations. Furthermore, since this research was conducted there have been major changes that are likely to have increased the complexity of consultations, including new models of chronic disease management, the use of guidelines, introduction of pay-for-performance schemes, and developments in computerised record systems which prompt doctors to raise additional problems.
How this fits in
GPs are expected to address an ever-increasing number of issues within each time-limited consultation. In this study, the average consultation included discussion of 2.5 different problems across a wide range of disease areas in less than 12 minutes, with each additional problem being discussed in just 2 minutes. Doctors raised problems, in addition to those presented by patients, in 43% of consultations. Only 37% of problems were coded in electronic medical records, raising concerns about the validity of some epidemiological studies based on general practice records databases.
Understanding the content of primary care consultations through observation is also relevant to epidemiological studies using databases based on extraction of routine data from electronic general practice records. The validity of these studies is dependent on the extent to which the medical record reflects the full range of problems discussed in consultations.
The aims of this research were to describe the number and types of problems discussed in primary care consultations, the differences between problems raised by patients or by doctors, and how these variables were related to characteristics of patients and doctors. Differences between the number and types of problems discussed in consultations and recorded in electronic medical records were also explored.
METHOD
Design
This was a cross-sectional study based on video recordings of sequential consultations with a sample of GPs, analysed retrospectively using a pre-tested proforma.
Setting
The study was conducted among 30 GPs from 22 practices around Bristol and North Somerset, which includes urban, suburban, and rural areas. Consultations were recorded between October 2010 and June 2011.
Selection and recruiting GPs and patients
A purposeful approach was used to recruit general practices that represented affluent, average, and deprived areas, using tertiles based on their postcodes mapped to the Index of Multiple Deprivation.19 From practices that agreed to participate, GPs were purposefully selected to include a range in terms of sex, age-group, and years since qualification. GPs were excluded who provided fewer than 6 hours a week of daytime appointments and also GPs in training.
Patients were eligible for inclusion if they were aged ≥18 years, attended a pre-booked appointment between 8 am and 8 pm, and gave informed consent. Patients were excluded if they were unable to give informed consent, indicated before the consultation that they wished to discuss a third party, or did not speak English. Data on all eligible patients were collected during one half-day surgery session for each participating GP. Patients were given brief information about the study by telephone when they booked their appointment, and invited to give informed consent when they arrived.
Analysis of content of consultations
Prior to the main study, 13 consultations with two different GPs were video recorded and used to develop a proforma for the analysis of content of consultations. This proforma recorded data about the length of consultations (measured using a stop watch), whether the patient or practice initiated the consultation, and details of each ‘problem’ and ‘issue’ dealt with in the consultation. Following Flocke et al,15 ‘problems’ were defined as a topic requiring the GP to make a decision or diagnosis, to provide treatment, or to undertake monitoring or administration. Each problem identified was coded using the International Classification of Primary Care (ICPC-2), which comprises 726 codes within 17 chapters representing bodily systems/topic areas such as musculoskeletal or circulatory conditions.20
Within each ‘problem’, the different ‘issues’ or topics raised were recorded and coded into one or more of 10 issue categories, such as physical symptoms or medication-related activities (Appendix 1). Each problem had at least one issue and each issue could be of more than one type. For example a patient with depression might discuss their mood, some side-effects from their antidepressant medication, and problems this was causing with their work. This would be coded as one problem, with three issues: psychological/emotional, medication-related, and social. It was recorded whether the patient, GP, or a third party first raised each problem and each issue.
The proforma used to code consultations was developed using the pilot data. It proved difficult to determine when one problem ended and another began, so the proforma was developed over several iterations, repeatedly refining definitions and an operational protocol to develop a sufficiently reliable measurement tool. The inter-rater reliability of the final version of the proforma was tested by two researchers independently coding 60 randomly selected consultations. Intraclass correlation coefficients for inter-rater reliability for the number of problems in a consultation, and for agreement about ICPC coding and issue types, were 0.93, 0.85 and 0.80 respectively.
Data sources and measurement
Information about the doctors’ sex, ethnicity, and number of years qualified was obtained using a questionnaire. Data were obtained from practice appointment records about the age and sex of each patient booked to attend a designated surgery session. Information about ethnicity (white or other) was based on direct observation by the researcher.
A video camera was set up in each GP’s consulting room, operated by the GP using a remote control, recording only patients who had consented. GPs’ records of consultations were extracted from the practice computer system after the surgery session. Two researchers used the proforma to independently code 60 randomly selected consultations from the video recordings, and (having established the validity of the process) one researcher coded the remaining consultations. Problems identified from the video recorded consultations were compared with those entered by the GP in the medical records, collecting data about whether each problem was entered in free-text and also whether it was coded using Read Codes.
Sample size
Assuming 15 patients were booked for each surgery session, that 10% failed to attend, 15% were ineligible, and 30% declined to participate, then 30 participating GPs would provide 240 consultations for analysis. Allowing for clustering by GP (assuming an intra-cluster correlation coefficient of 0.05), this sample size allowed estimates of proportions within 95% confidence intervals (CI) of ±7.4%, with smaller CI for proportions further from 50%.
Statistical methods
Descriptive statistics were used to describe the number and types of problems and issues discussed in consultations. Linear regression analysis was used to explore the relationship between the number of problems discussed and the length of consultations. Investigation of the types of problems and issues raised by patients and GPs used two-level logit models, treating issues and problems as clustered within GPs (as a random effect) and using robust estimates of variance to account for intermediate clustering within patients.21 The same analysis approach was used to describe whether problems observed in consultations were recorded and coded in the records. All analyses were conducted using Stata (version 12).
RESULTS
Characteristics of sample
Practices and GPs
The 22 practices participating in the study were evenly balanced between affluent (n = 7), average (n = 7), and deprived (n = 8) areas. There were no differences between practices that agreed or declined to participate in terms of mean list size or deprivation. Fifteen male and 15 female GPs were recruited, all but one of whom was of white ethnicity. Doctors had been qualified as a GP for a mean of 18.1 years (standard deviation 8.3; range 1–32 years).
Patient sample
Flow of patients through the study is shown in Figure 1. From 357 pre-booked appointments, 318 patients were eligible to take part, 230 (72.3%) agreed to participate and 229 were video recorded. There were no differences in sex or age-group between those who agreed or declined to participate (Table 1).
Figure 1.

Flow of patients through the study.
Table 1.
Characteristics of patient sample
| Patients | Consenting N = 230 | Non-consenting N = 88 | ||
|---|---|---|---|---|
|
| ||||
| n | % | n | % | |
| Age, years | χ2 = 1.799; df = 3; P = 0.62 | |||
| 18–34 | 34 | 14.8 | 15 | 17.0 |
| 35–54 | 67 | 29.1 | 28 | 31.8 |
| 55–74 | 78 | 33.9 | 23 | 26.1 |
| ≥75 | 51 | 22.2 | 22 | 25.0 |
|
| ||||
| Sex | χ2 = 2.32; df = 2; P = 0.13 | |||
| Male | 100 | 43.5 | 30 | 34.1 |
| Female | 130 | 56.5 | 58 | 65.9 |
|
| ||||
| Ethnicitya | ||||
| White | 221 | 96.5 | b | |
| Other | 8 | 3.5 | b | |
Missing data on ethnicity for one patient.
Not recorded. df = degrees of freedom.
Problems
Within the 229 videoed consultations, a total of 564 problems were identified, an average of 2.5 problems in each appointment (95% CI = 2.3 to 2.6; median 2; range 1–8). More than three-quarters (76.4% [175/229]) of consultations included discussion of more than one problem and 41.5% (n = 55) of consultations included at least three different problems (Figure 2). The number of problems discussed was positively associated with increasing patient age, but no strong independent associations with other patient or GP characteristics were found (Table 2).
Figure 2.

Number of problems discussed in each consultation. Figures are percentages of all consultations (n = 229).
Table 2.
Number of problems in relation to practice, patient and doctor characteristics
| Characteristic | Incident rate ratio | 95% CI | P-value |
|---|---|---|---|
| Practice level | |||
| Deprivation: moderate versus affluent | 0.96 | 0.76 to 1.22 | 0.762 |
| Deprivation: deprived versus affluent | 1.15 | 0.90 to 1.47 | 0.255 |
|
| |||
| GP level | |||
| GP sex: female versus male | 1.04 | 0.87 to 1.26 | 0.649 |
| GP age: >40 years versus <40 years | 1.03 | 0.73 to 1.46 | 0.856 |
| GP ethnicity: other versus white | 1.01 | 0.58 to 1.76 | 0.975 |
| Years of practising as a GP: for each 10-year increase in age | 0.96 | 0.82 to 1.13 | 0.611 |
|
| |||
| Patient level | |||
| Patient age: for each 10-year increase in age | 1.08 | 1.02 to 1.13 | 0.003 |
| Patient sex: female versus male | 1.13 | 0.94 to 1.35 | 0.181 |
| Ethnicity: other versus white | 1.11 | 0.70 to 1.76 | 0.644 |
Based on mixed Poisson regression adjusting for clustering by GP.
The mean duration of consultations was 11.9 minutes (95% CI = 11.2 to 12.6; SD 5.4; range 2.0–30.8 minutes). There was a positive association between the number of problems discussed and the mean length of consultations. The Lowess line22 (akin to a weighted moving average) in Figure 3 suggests that this relationship is quite linear, at least up to six problems, with the length of consultations increasing by an average of 2.0 minutes (95% CI = 1.6 to 2.5) for each additional problem above a baseline of 9.0 minutes for the first problem.
Figure 3.
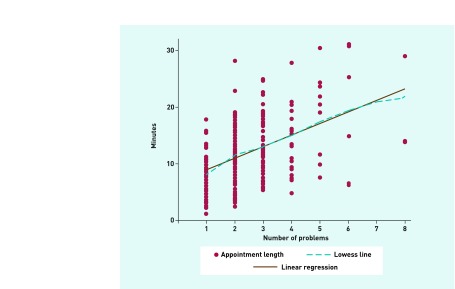
Consultation length in relation to number of problems discussed, and fitted Lowess line.
Disease areas
The types of problems categorised according to the 17 ICPC disease categories are shown in Table 3. The most common category was musculoskeletal problems, accounting for 19% of all problems discussed. Typical consultations included multiple problems covering a wide range of disease areas (ICPC categories), with almost three-quarters (165/229; 72.1%) of consultations including problems in more than one disease area. The mean number of different disease areas discussed in each consultation was 2.2 (95% CI = 2.0 to 2.4). Apart from a positive association between number of disease areas and patient age (incident rate ratio 1.07 [95% CI = 1.02 to 1.13] for each 10-year increase in age), there were no independent associations with other patient or GP characteristics.
Table 3.
Types of problems raised by patients or doctors
| Problem ICPC heading | Problem type | Frequency | % |
Who raised the problem?a
|
|||
|---|---|---|---|---|---|---|---|
| Patient | % | GP | % | ||||
| W | Pregnancy, childbearing, family planning | 16 | 2.8 | 15 | 93.8 | 1 | 6.3 |
| S | Skin | 46 | 8.2 | 42 | 93.3 | 3 | 6.7 |
| N | Neurological | 24 | 4.3 | 21 | 91.3 | 2 | 8.7 |
| L | Musculoskeletal | 107 | 19.0 | 95 | 88.8 | 12 | 11.2 |
| D | Digestive | 46 | 8.2 | 39 | 88.6 | 5 | 11.4 |
| U | Urological | 19 | 3.4 | 16 | 84.2 | 3 | 15.8 |
| R | Respiratory | 44 | 7.8 | 37 | 84.1 | 7 | 15.9 |
| H | Ear | 9 | 1.6 | 7 | 77.8 | 2 | 22.2 |
| X | Female genital | 12 | 2.1 | 9 | 75.0 | 3 | 25.0 |
| P | Psychological | 43 | 7.6 | 32 | 74.4 | 11 | 25.6 |
| F | Eye | 11 | 2.0 | 8 | 72.7 | 3 | 27.3 |
| T | Endocrine/metabolic and nutritional | 36 | 6.4 | 24 | 66.7 | 12 | 33.3 |
| Z | Social problems | 12 | 2.1 | 7 | 63.6 | 4 | 36.4 |
| K | Cardiovascular | 34 | 6.0 | 21 | 61.8 | 13 | 38.2 |
| Y | Male genital | 11 | 2.0 | 6 | 60.0 | 4 | 40.0 |
| A | General and unspecified | 86 | 15.2 | 48 | 57.1 | 36 | 42.9 |
| B | Blood, and immune mechanism | 8 | 1.4 | 3 | 37.5 | 5 | 62.5 |
| Total | 564 | 100 | 430 | 77.3 | 126 | 22.7 | |
Problems raised by third parties (n = 8) are omitted for ease of presentation. ICPC = International Classification of Primary Care.
Issues
A total of 942 issues were raised (mean 4.1 [95% CI = 3.8 to 4.4] issues in each consultation). These were most commonly physical symptoms (56.3%) or related to medication (40.6%) (Table 4).
Table 4.
Types of issues raised by patients or by doctors
| Issue type | Frequencya | %b |
Who raised the issue?c
|
|||
|---|---|---|---|---|---|---|
| Patient | % | GP | % | |||
| Social | 113 | 12.0 | 96 | 85.0 | 14 | 12.4 |
| Emotional/psychological | 86 | 9.1 | 72 | 83.7 | 11 | 12.8 |
| Third party issues | 32 | 3.4 | 25 | 78.1 | 5 | 15.6 |
| Physical | 530 | 56.3 | 369 | 69.6 | 149 | 28.1 |
| Discuss test results/treatment | 203 | 21.5 | 87 | 42.9 | 115 | 56.6 |
| Medication related | 382 | 40.6 | 146 | 38.2 | 233 | 61.0 |
| Behavioural health prevention | 173 | 18.4 | 49 | 28.3 | 123 | 71.1 |
| Administrative | 56 | 5.9 | 12 | 21.4 | 44 | 78.6 |
| Medicalised health prevention | 84 | 8.9 | 16 | 19.0 | 68 | 80.9 |
| Order/refer for tests | 135 | 14.3 | 16 | 11.8 | 119 | 88.1 |
There are 942 issues but each issue can be coded as relating to more than issue type.
Percentage of all 942 issues being of this type.
Issues raised by third parties are omitted for ease of presentation, so percentages in each row may add to less than 100%.
Are there differences between the types of problems and issues raised by patients or doctors?
Most consultations were initiated by the patient (n = 192; 83.8%) with 18 (7.9%) being initiated by the doctor (in the remaining 19 [8.3%] consultations it was not possible to tell). Most (76.2% [430/564]) problems discussed were raised by patients, with 22.3% (126/564) being raised by the GP and 1.4% (8/564) by a third party present in the consultation. Patients and doctors raised a mean of 1.9 (95% CI = 1.7 to 2.0; range 1–8) and 0.6 (95% CI = 0.5 to 0.6; range 1–4) problems in each consultation respectively. Although patients raised problems in almost all consultations (96.5% [221/229]), more than two-fifths (43.2% [99/229]) of consultations included problems raised by doctors. There were differences in the types of problems raised by patients and doctors (df = 16, χ2 = 53.5, P<0.001). For example, skin, musculoskeletal, and digestive problems were mainly raised by patients, but a relatively high proportion of problems relating to cardiovascular or endocrine/metabolic diseases were raised by doctors (Table 3).
Issues in relation to problems were raised almost equally by patients (473/942 [50.2%]) or by doctors (452/942 [48.0%]), with 17 (1.8%) being raised by third parties. There were marked differences in the types of issues raised by patients and by doctors (df = 9, χ2 = 327.76, P<0.001). In particular, patients were more likely to present physical symptoms or emotional/psychological or social issues, whereas doctors were more likely to raise issues relating to prevention, medication, tests, and administrative topics (Table 4).
Recording in notes
Of 562 problems discussed in consultations (excluding one patient with two problems in which notes were missing), 455 (81.0%) were recorded in the medical notes, but only 206 (36.7%) were Read Coded. Further analysis shows that some types of problem were significantly more or less likely to be recorded or Read Coded (Table 5). For example, problems relating to the respiratory or neurological systems, the genitals, contraception, or childbirth were more likely to be coded than musculoskeletal, psychological, social, or poorly defined problems (all of which were common categories).
Table 5.
Which types of problems are recorded and coded?
| ICPC heading | Problem type | Total | Recorded in notesa | Read Codedb | ||
|---|---|---|---|---|---|---|
|
| ||||||
| Yes | % | Yes | % | |||
| H | Ear | 9 | 9 | 100.0 | 5 | 55.6 |
| X | Female genital | 12 | 12 | 100.0 | 6 | 50.0 |
| U | Urological | 19 | 18 | 94.7 | 9 | 47.4 |
| K | Cardiovascular | 34 | 32 | 94.1 | 16 | 47.1 |
| W | Pregnancy, childbearing, family planning | 16 | 15 | 93.8 | 8 | 50.0 |
| S | Skin | 46 | 40 | 87.0 | 18 | 39.1 |
| L | Musculoskeletal | 107 | 91 | 85.0 | 34 | 31.8 |
| R | Respiratory | 44 | 37 | 84.1 | 22 | 50.0 |
| N | Neurological | 24 | 20 | 83.3 | 12 | 50.0 |
| F | Eye | 11 | 9 | 81.8 | 3 | 27.3 |
| Y | Male genital | 10 | 8 | 80.0 | 4 | 40.0 |
| P | Psychological | 43 | 34 | 79.1 | 18 | 41.9 |
| D | Digestive | 46 | 36 | 78.3 | 20 | 43.5 |
| T | Endocrine/metabolic and nutritional | 36 | 27 | 75.0 | 13 | 36.1 |
| Z | Social problems | 12 | 9 | 75.0 | 4 | 33.3 |
| A | General and unspecified | 85 | 54 | 63.5 | 14 | 16.5 |
| B | Blood, and immune mechanism | 8 | 4 | 50.0 | 0 | 0 |
| Total | 562 | 455 | 81.0 | 206 | 36.7 | |
ICPC = International Classification of Primary Care.
Wald χ2 = 28.70, df = 16, P = 0.026.
Wald χ2 32.15, df = 16, P = 0.0096.
DISCUSSION
Summary
This study demonstrates that most general practice consultations are not simple transactions relating to single problems, but are complex encounters dealing with several problems across a very wide range of disease areas. On average GPs spend 11.9 minutes dealing with 2.5 problems, and multiple issues for each problem, in each appointment. Patients and doctors both contribute to the agenda for each consultation, and they raise different types of problems and issues. Most (but not all) problems discussed are recorded in the notes, but only a minority are Read Coded and this is associated with the type of disease area.
Strengths and limitations
A high level of patient recruitment was achieved, including doctors and practices with a range of characteristics to maximise generalisability. However, only 48% of practices invited agreed to participate. It is recognised that doctors who agree to take part in this type of research may be atypical, and it is notable that doctors from black and minority ethnic groups are under-represented.
One of the reasons this study was conducted was to understand the complexity of typical consultations given the high prevalence of multimorbidity. It was only possible to assess the range of problems explicitly discussed, and doctors also need to consider patients’ other ongoing problems in managing consultations (even if these are not discussed) therefore this study may underestimate the complexity of consultations from the doctor’s perspective. This topic is being explored using qualitative research based on these video recordings and subsequent interviews with the GPs, to be published elsewhere.
Comparison with existing literature
This appears to be the first study to quantify the number and range of problems discussed in general practice consultations using methods that are based on observation of consultations, auditable, and have demonstrable reliability. The findings of the present study are broadly similar to those of Flocke,15 who asked medical students to directly observe (with no recordings) and code 266 family practice consultations in the US in 1999 and found that an average of 2.7 problems were discussed. However, the mean duration of these consultations was much longer at 19.3 minutes than those observed in this study (11.9 minutes).
The present findings on the extent to which diagnoses are coded in electronic medical records appear to be at odds with a recent systematic review, which suggested that the validity of diagnoses in the General Practice Research Database is high.23 However, this systematic review demonstrated high positive predictive values (that about 89% of coded diagnoses were confirmed from other sources), whereas the present study has demonstrated low sensitivity (only 37% of diagnoses were coded).
Implications for research and practice
These findings suggest that general practice needs to change to reflect the complex range of issues now discussed in each consultation, for example through providing longer appointments. The wide range of problems discussed demonstrates why clinicians working in primary care need generalist knowledge and skills. The present findings question the wisdom of attempts to provide primary care through less highly-trained staff working with the support of computerised algorithms to assess and manage common problems.24 This idea is predicated on the assumption that patients consult with single well-defined problems, but the present study suggests that this is not the case. The difficulty encountered in designing a reliable data collection proforma illustrates that even defining the nature of the problems presented can be problematic.
Although it is predictable that consultations were longer when more problems were discussed, the linear relationship of an average 2 minutes for each extra problem is surprising. This could be interpreted as demonstrating the efficiency of the generalist model, where several problems can be dealt with at once, or it could suggest that problems are not dealt with thoroughly if too many are presented at one time-limited consultation. This pressure on consultation time is likely to increase as the population ages, as older patients in this study presented more problems.
The finding that there was substantial under-recording of problems in electronic medical records, and in particular systematic differences in the types of problems which are coded, has important implications for epidemiological studies based on coded data extracted from routine general practice records. It may be important to include free text as well as coded data to answer some research questions. The sample size was not large enough to provide more detailed analysis of which specific conditions were not well coded, but this should be a priority for future research.
This study builds on a substantial body of research about the agenda that patients bring to primary care consultations.25–27 It demonstrates that doctors also have an agenda, as many consultations include problems and issues raised by doctors rather than patients. These particularly relate to the managing of chronic conditions such as cardiovascular and endocrine disease and to health promotion. This highlights the importance of the opportunities for prevention provided by primary care,6 based on patients bringing their new problems to a ‘medical home’ which also looks after their ongoing problems.28
Acknowledgments
We thank all the patients and doctors who took part in this study, Michael Steinman for commenting on the design of the study and Peter Bower for comments on study design and help with testing the coding proforma.
Appendix 1.
Issue categories
| Physical (P) | Any discussion of or reference to physical symptom, or where the problem is discussed as a physical symptom, disability, or loss of function. (Recording of physical investigations for example, weight, blood pressure does not get recorded here). |
| Emotional/ psychological (EP) | When the consultation directly addresses psychological or emotional dimensions or consequences of the problem. It is anticipated this will mostly relate to voicing or exploring worries, but is not confined to this. This box does not apply if emotional dimensions are only inferred, only if they are addressed. |
| Social (S) | Discussion of the consequences of the problem on the patient’s normal social roles or activities of daily living. |
| Administrative (A) | Dealing with requests for letters and sick notes; making referrals for further consultations; making repeat appointments. Information being sent outwards from the GP for decision making elsewhere. |
| Medication related (M) | Activities relating to any existing medication; any prescription or administration of new medication. Includes the direct administration of medication. Includes reviews and re-prescriptions of medication. |
| Order/refer for tests (OT) | Issues that raise or resolve the need for tests or investigations to be done beyond the current consultation. |
| Discuss test results/ treatment (DT) | Issues that follow up test results, investigations, or treatments (other than medication) that were performed prior to the consultation. Includes information coming inwards from elsewhere, to be acted on by the GP. |
| Behavioural health prevention/ maintenance (BM) | Information given or sought relating to patient actioned prevention, self-management or risk management or behaviours. Includes discussions of giving up smoking, losing weight, alcohol consumption, improving diet, cardiovascular risk assessment, screening of any type. NB: if any of these discussions identify a problem, which then leads to a substantial discussion about how to manage this problem (for example, heavy drinking and obesity), then start a new Problem rather than including this as an issue type. |
| Medicalised health prevention/maintenance (MM) | Information given or sought relating to GP actioned prevention or risk management issues. Particularly discussions or investigations which are not relating to a current symptomatic health problem, but are intended to prevent problems in future. Includes taking blood pressure, weighing, discussion of vaccinations, cervical smears and flu jabs. NB: if any of these discussions identify a problem, which then leads to a substantial discussion about how to manage this problem (for example, heavy drinking and obesity), then start a new Problem rather than including this as an issue type. |
| Third party issues (3P) | Discussion of problems relating to someone other than the patient. This does not include accounts of others’ comments or views on any of the patient’s problems that are discussed. |
Funding
The study was funded by the NIHR School for Primary Care Research.
Ethical Approval
The study received ethical approval from South West Central Bristol Local Research Ethics Committee ref 10/H0106/14. Informed consent was obtained from all participants.
Provenance
Freely submitted; externally peer reviewed.
Competing interests
The authors have declared no competing interests.
Discuss this article
Contribute and read comments about this article on the Discussion Forum: http://www.rcgp.org.uk/bjgp-discuss
REFERENCES
- 1.The King’s Fund . Improving the quality of care in general practice. London: The King’s Fund; 2011. http://www.kingsfund.org.uk/publications/improving-quality-care-general-practice (accessed 1 Oct 2013). [Google Scholar]
- 2.Campbell S, Reeves D, Kontopantelis E, et al. Quality of primary care in England with the introduction of pay for performance. N Engl J Med. 2007;357(2):181–190. doi: 10.1056/NEJMsr065990. [DOI] [PubMed] [Google Scholar]
- 3.Salisbury C, Johnson L, Purdy S, et al. Epidemiology and impact of multimorbidity in primary care: a retrospective cohort study. Br J Gen Pract. 2011;61(582) doi: 10.3399/bjgp11X548929. [DOI] [PMC free article] [PubMed] [Google Scholar]
- 4.Boyd CM, Darer J, Boult C, et al. Clinical practice guidelines and quality of care for older patients with multiple comorbid diseases. JAMA. 2005;294(6):716–724. doi: 10.1001/jama.294.6.716. [DOI] [PubMed] [Google Scholar]
- 5.Hughes LD, McMurdo MET, Guthrie B. Guidelines for people not for diseases: the challenges of applying UK clinical guidelines to people with multimorbidity. Age Ageing. 2012;42(1):62–69. doi: 10.1093/ageing/afs100. [DOI] [PubMed] [Google Scholar]
- 6.Stott NC, Davis RH. The exceptional potential in each primary care consultation. J R Coll Gen Pract. 1979;29:201–205. [PMC free article] [PubMed] [Google Scholar]
- 7.Bower P, Macdonald W, Harkness E, et al. Multimorbidity, service organization and clinical decision making in primary care: a qualitative study. Fam Pract. 2011;28(5):579–587. doi: 10.1093/fampra/cmr018. [DOI] [PubMed] [Google Scholar]
- 8.McCormick A, Fleming D, Charlton J. Morbidity Statistics from general practice. London: HMSO; 1995. Fourth national study 1991–1992. Series MB5 no.3. [Google Scholar]
- 9.Britt HC, Harrison CM, Miller GC, Knox SA. Prevalence and patterns of multimorbidity in Australia. Med J Aust. 2008;189(2):72–77. doi: 10.5694/j.1326-5377.2008.tb01919.x. [DOI] [PubMed] [Google Scholar]
- 10.Laux G, Kuehlein T, Rosemann T, Szecsenyi J. Co- and multimorbidity patterns in primary care based on episodes of care: results from the German CONTENT project. BMC Health Services Research. 2008;8(1):14. doi: 10.1186/1472-6963-8-14. [DOI] [PMC free article] [PubMed] [Google Scholar]
- 11.Beasley JW, Hankey TH, Erickson R, et al. How many problems do family physicians manage at each encounter? A WReN study. Ann Fam Med. 2004;2(5):405–410. doi: 10.1370/afm.94. [DOI] [PMC free article] [PubMed] [Google Scholar]
- 12.Britt HC, Valenti L, Miller GC. Determinants of consultation length in Australian general practice. Med J Aust. 2005;183(2):68–71. doi: 10.5694/j.1326-5377.2005.tb06924.x. [DOI] [PubMed] [Google Scholar]
- 13.Pan Y, Britt H, Charles J. Multiple chronic problems. Aust Fam Physician. 2009;38(1–2):9. [PubMed] [Google Scholar]
- 14.Bindman AB, Forrest CB, Britt H, et al. Diagnostic scope of and exposure to primary care physicians in Australia, New Zealand, and the United States: cross sectional analysis of results from three national surveys. BMJ. 2007;334(7606):1261. doi: 10.1136/bmj.39203.658970.55. [DOI] [PMC free article] [PubMed] [Google Scholar]
- 15.Flocke SA, Frank SH, Wenger DA. Addressing multiple problems in the family practice office visit. J Fam Pract. 2001;50(3):211–216. [PubMed] [Google Scholar]
- 16.Zyzanski SJ, Stange KC, Langa D, Flocke SA. Trade-offs in high-volume primary care practice. J Fam Pract. 1998;46(5):397–402. [PubMed] [Google Scholar]
- 17.Stange KC, Zyzanski SJ, Jaen CR, et al. Illuminating the ‘black box’. A description of 4454 patient visits to 138 family physicians. J Fam Pract. 1998;46(5):377–389. [PubMed] [Google Scholar]
- 18.Tai-Seale M, McGuire TG, Zhang W. Time allocation in primary care office visits. Health Serv Res. 2007;42(5):1871–1894. doi: 10.1111/j.1475-6773.2006.00689.x. [DOI] [PMC free article] [PubMed] [Google Scholar]
- 19.English Indices of Deprivation 2010. http://data.gov.uk/dataset/index-of-multiple-deprivation (accessed 22 September 2013).
- 20.Classification Committee of the World Organisation of Family Doctors . ICPC-2: International Classification of Primary Care. 2nd ed. Oxford: Oxford University Press; 1998. [Google Scholar]
- 21.Williams RL. A Note on Robust Variance Estimation for Cluster-Correlated Data. Biometrics. 2000;56(2):645–646. doi: 10.1111/j.0006-341x.2000.00645.x. [DOI] [PubMed] [Google Scholar]
- 22.Cleveland WS. Robust Locally Weighted Regression and Smoothing Scatterplots. J Am Stat Assoc. 1979;74(368):829–836. [Google Scholar]
- 23.Herrett E, Thomas SL, Schoonen WM, et al. Validation and validity of diagnoses in the General Practice Research Database: a systematic review. Br J Clin Pharmacol. 2010;69(1):4–14. doi: 10.1111/j.1365-2125.2009.03537.x. [DOI] [PMC free article] [PubMed] [Google Scholar]
- 24.Salisbury C, Chalder M, Scott TM, et al. National Walk-In Centre Evaluation Team. What is the role of walk-in centres in the NHS? BMJ. 2002;324(7334):399–402. doi: 10.1136/bmj.324.7334.399. [DOI] [PMC free article] [PubMed] [Google Scholar]
- 25.Levenstein JH, McCracken EC, McWhinney IR, et al. The Patient-centred clinical method. 1. A Model for the doctor-patient interaction in family medicine. Fam Pract. 1986;3(1):24–30. doi: 10.1093/fampra/3.1.24. [DOI] [PubMed] [Google Scholar]
- 26.Barry CA, Bradley CP, Britten N, et al. Patients’ unvoiced agendas in general practice consultations: qualitative study. BMJ. 2000;320(7244):1246–1250. doi: 10.1136/bmj.320.7244.1246. [DOI] [PMC free article] [PubMed] [Google Scholar]
- 27.Campion PD, Butler NM, Cox AD. Principle agendas of doctors and patients in general practice consultations. Fam Pract. 1992;9(2):181–190. doi: 10.1093/fampra/9.2.181. [DOI] [PubMed] [Google Scholar]
- 28.Kahn N. The future of family medicine: a collaborative project of the family medicine community. Ann Fam Med. 2004;2(1):29. doi: 10.1370/afm.130. [DOI] [PMC free article] [PubMed] [Google Scholar]