

Expression quantitative trait locus mapping in well-watered and drying soil revealed differential gene expression resulting from standing genetic variation, environmental condition, and gene × environment interactions. Genomic features were then shown to be predictive of genetic and environmental variation in gene expression, but in contrasting ways.
Abstract
The regulation of gene expression is crucial for an organism’s development and response to stress, and an understanding of the evolution of gene expression is of fundamental importance to basic and applied biology. To improve this understanding, we conducted expression quantitative trait locus (eQTL) mapping in the Tsu-1 (Tsushima, Japan) × Kas-1 (Kashmir, India) recombinant inbred line population of Arabidopsis thaliana across soil drying treatments. We then used genome resequencing data to evaluate whether genomic features (promoter polymorphism, recombination rate, gene length, and gene density) are associated with genes responding to the environment (E) or with genes with genetic variation (G) in gene expression in the form of eQTLs. We identified thousands of genes that responded to soil drying and hundreds of main-effect eQTLs. However, we identified very few statistically significant eQTLs that interacted with the soil drying treatment (GxE eQTL). Analysis of genome resequencing data revealed associations of several genomic features with G and E genes. In general, E genes had lower promoter diversity and local recombination rates. By contrast, genes with eQTLs (G) had significantly greater promoter diversity and were located in genomic regions with higher recombination. These results suggest that genomic architecture may play an important a role in the evolution of gene expression.
INTRODUCTION
The regulation of gene expression is of fundamental importance to biology (Wray et al., 2003; Stern and Orgogozo, 2008; Whittkop and Kalay, 2012; Gerstein, 2012; Jones et al., 2012). Many genes alter their level expression in response to environmental changes (E). Furthermore, gene expression can vary among individuals of a species due to natural genetic variation (G), and some genes may further exhibit genetic variation in their expression in response to the environment (expression GxE interactions). One promising avenue for studying natural variation in gene expression is through expression quantitative trait locus (eQTL) mapping (Li et al., 2006; Smith and Kruglyak, 2008; Keurentjes et al., 2007; Breitling et al., 2008; Fu et al., 2009, Cubillos et al., 2012a, 2012b; Snoek et al., 2012). Here, mRNA transcript abundance for each gene in the genome is treated as a trait for genetic mapping. Over the last decade, eQTL mapping has been used to understand the genetic architecture of variation in gene expression in model systems, crops, and humans (Brem et al., 2002; DeCook et al., 2006; West et al., 2007; Smith and Kruglyak, 2008; Kliebenstein, 2009; Holloway et al., 2011; Grundberg et al., 2011; Maranville et al., 2011; Zhang et al., 2011; Barreiro et al., 2012; Cubillos et al., 2012a, 2012b; Snoek et al., 2012). More recently, studies have begun to explore how eQTL effects on transcript abundance can interact with the environment (Li et al., 2006; Smith and Kruglyak, 2008; Grundberg et al., 2011; Maranville et al., 2011; Barreiro et al., 2012). However, surprisingly few plant studies have explored the occurrence of expression GxE interaction using eQTL methods.
Drought stress is one of the most fundamental environmental (E) factors limiting crop production and governing the composition of plant communities globally (Whittaker, 1975; Bohnert et al., 1995; Bray, 1997; Des Marais and Juenger, 2010). Within plant species, soil water availability has long been known to be a major factor driving the evolution of growth rate, flowering time, and life-history transitions (Clausen, 1951; Stebbins, 1952; Roux et al., 2006; Des Marais and Juenger, 2010; Lowry, 2012). Understanding genetic variation in response to water availability is thus of great importance to plant evolutionary biology, improvement of crop performance, and predicting how species will respond to climate change (Jump and Penuelas, 2005; Oliver et al., 2009; Chown et al., 2010). Drought tolerance and acclimation are thought to be at least partially mediated by gene expression in plants. Recent studies have identified numerous transcripts that respond to changes in osmotic stress in response to mannitol or through manipulation of soil water availability (Kreps et al., 2002; Seki et al., 2002; Kilian et al., 2007; Shinozaki and Yamaguchi-Shinozaki, 2007; Huang et al., 2008; Juenger et al., 2010; Des Marais et al., 2012). In addition, there are many examples where overexpression of single genes through transformation has increased drought tolerance in experimental conditions (Xu et al., 2009; Jeong et al., 2010; Yue et al., 2012). However, virtually nothing is known about natural variation in gene expression responses to drying soil or the role of this variation in adaptation. Recently, we demonstrated that there are numerous genotype × environment (GxE) interactions for gene expression in response to progressive soil drying (Des Marais et al., 2012). Here, we explore the genetic architecture underlying expression responses to soil drying using eQTL methods and associate this natural variation in expression with species-wide patterns of nucleotide polymorphism and features of the genome.
From an evolutionary perspective, the origin and maintenance of natural variation in gene expression responses (G) is a product of four fundamental forces: mutation, drift, selection, and recombination (Lynch, 2007). In addition, multiple features of the genome may play a major role in the evolution of quantitative traits, including diversity in gene expression, in a manner independent of individual gene function (Rockman et al., 2010). For example, many studies have now demonstrated a relationship between variation in gene size and the breadth of gene expression in plants (reviewed in Woody and Shoemaker, 2011). Differential rates of recombination, mutation, and selection throughout the genome can have a substantial impact on shaping standing genetic variation in phenotypic traits, including gene expression (Begun and Aquadro, 1992; Nachman, 2001; Hoffmann and Rieseberg, 2008; Wright and Andolfatto, 2008; Tung et al., 2009; Cutter and Choi, 2010; Charlesworth, 2010; Kirkpatrick, 2010; Rockman et al., 2010; McGaugh et al., 2012). Furthermore, recent research in sunflowers (Helianthus sp) has found that genomic features, especially recombination, are the most predictive factors for the genomic location of nucleotide divergence between related plant species (Renaut et al., 2013). Even so, it is unknown to what extent genomic features, such as levels of polymorphism, recombination, gene size, and gene density, are predictive of genes responding to the environment (E) or the occurrence of natural variation in gene expression (G) discovered through eQTL mapping.
In this study, we conducted an eQTL analysis of Arabidopsis thaliana grown under a soil drying treatment using a recombinant inbred line (RIL) mapping population. The accessions Kas-1 (Kashmir, India) and Tsu-1 (Tsushima, Japan) were selected as parents of the RILs because they are divergent in plant-water relations, including relative water content at wilting, survival under terminal soil drying, instantaneous and integrated measures of water use efficiency (McKay et al., 2003, 2008), and water deficit–induced Pro abundance (Verslues and Juenger, 2011). Kas-1 is generally more water use efficient and has more drought tolerance characteristics than Tsu-1. We examined the effects soil drying (E) had on genome-wide transcript abundance in this RIL population. In addition, we scanned the genome for main-effect eQTLs (G) and GxE eQTL interactions. A major goal of our study was to understand whether genes that respond to environmental stress (E) and genes with eQTL main effects (G) are associated with genomic features. To accomplish this goal, we combined our study of eQTL across environments with information on promoter polymorphism, local recombination rate, gene size, and gene density. Our combined genome-wide analyses provide for a broad study of the potential causes of natural variation in gene expression and its response to abiotic stress.
RESULTS
We grew two replicate plants of each of the TsuKas RILs under both well-watered (wet) and soil water deficit (dry) conditions. Our experimental protocol involved slowly imposed soil drying to mimic natural conditions and to allow plants to acclimate to the imposed stress. After 1 week of drought exposure, the soil of all the plants in the dry treatment was near the permanent wilting point of −1.5 MPa (soil in the wet treatment was maintained near 0 MPa). In response to this decrease in soil moisture, plants in the dry treatment increased investment into roots and ceased leaf expansion. The net effect of the changes in these two processes was that root mass ratio in the wet treatment was 13% and increased to 17% under drought, which represents an adaptive plastic response to the decrease in soil moisture. Abscisic acid (ABA) hormone, which is a central signaling molecule in drought responses (Cutler et al. 2010), was also elevated on a fresh mass basis in the dry treatment (RIL mean [se] = 0.81 [0.05] pmol/mg) over the well-watered treatment (RIL mean [se] = 0.38 [0.02] pmol/mg). At this point, leaf tissue from young leaves at the center of the rosette were collected from replicate plants in both environments and used for RNA extraction.
To quantify gene expression, we hybridized labeled samples to the Arabidopsis atSNPTILE array (Affymetrix; Zhang et al., 2007). Information from genome resequencing of the Tsu-1 and Kas-1 lines (see Methods) was used to exclude probes on the array containing single nucleotide polymorphisms (SNPs) between the study accessions. Our final data set for analyses, after the removal of all polymorphic probes, included gene expression phenotypes for 25,662 genes across 104 RILs and 208 arrays.
The general goal of our analyses was to identify (1) genes that changed expression in response to water availability (E), (2) genes that had natural genetic variation in gene expression in the form of eQTLs (G), and (3) genes that exhibit genotype x environment eQTL interactions (GxE). The details and algebraic logic of our analyses are described in Methods. Following these analyses, we asked the question of whether genomic features are predictive of E and G genes.
Water Availability Effects on Transcriptional Regulation (E)
Quantification of gene expression provided a powerful data set for exploring transcriptome responses to slow progressive soil drying. We detected 8585 genes responding to the soil drying treatments at a false discovery rate (FDR) of 0.05, with 4287 downregulated and 4298 upregulated in the dry treatment relative to the wet treatment (see Supplemental Data Set 1 online). In an earlier study, Des Marais et al. (2012) found 9305 genes with expression responses to a milder soil drying treatment across 17 Arabidopsis accessions (did not include the Tsu-1 and Kas-1 parents). In total, 4006 of the genes that responded to treatment in the TsuKas RILs (Figure 1) were not detected as soil moisture responsive across the 17 accessions surveyed by Des Marais et al. (2012).
Figure 1.
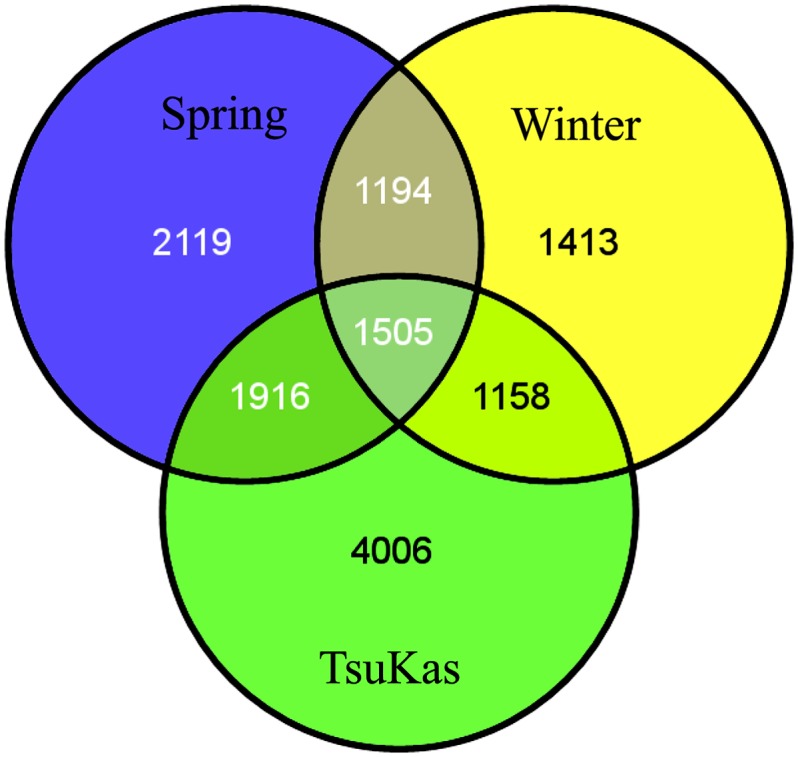
Comparison of Drought Response Genes across Experiments.
Venn diagram of overlap of genes responding to soil drying treatment across 10 spring accessions and seven winter accessions from Des Marais et al. (2012) with the TsuKas RIL mapping population at an FDR of 0.05.
[See online article for color version of this figure.]
To assess gene ontology (GO) enrichment of soil drying–responsive genes, we conducted singular enrichment analysis with agriGO (Du et al., 2010) for the 5584 transcripts with significant treatment effects at an FDR of 0.001. The most enriched biological process GO categories included responses to various stimuli/stresses, photosynthesis, and metabolism (see Supplemental Data Set 2 online). Very different GO categories were enriched for transcripts that were upregulated versus downregulated in response to soil drying. There was significant enrichment in 158 GO categories for genes downregulated in the dry treatment and 61 categories for upregulated genes at an FDR of 0.05. Only 24 categories were enriched for both up- and downregulated genes. Most strikingly, multiple components of photosynthesis and metabolic processes were downregulated in the dry treatment, while genes involved in response to abiotic stresses were upregulated.
Many individual genes known to be involved in drought response were differentially expressed across treatments at an FDR of 0.001, including ABA-responsive element binding factors (AREB1 and AREB2), ABA-insensitive genes (ABI2 and ABI5), dehydration-responsive element binding proteins (DREB2A and DREB2B), and multiple plasma membrane intrinsic proteins (PIP1A, PIP1B, PIP2A, PIP2B, and PIP1E). In addition to genes with known or predicted function, there were 810 genes with unknown function that responded to treatment at an FDR of 0.001.
Natural Genetic Variation in Gene Expression (G)
To identify main-effect eQTLs across environmental conditions, we conducted QTL mapping on the sum of expression level of each gene across the wet and dry treatment (Figure 2). As we explain in the Methods section, the sum can be used to map the average effect of a QTL across environments. Overall, we mapped 1508 eQTLs across 1480 expression traits at an FDR of 0.1 (nominal P < 0.008; Table 1). See Supplemental Data Set 3 online for eQTL lists.
Figure 2.

The Distribution of eQTLs across the Genome.
Location of eQTLs plotted against the location of the respective gene for each expression trait. Significant main effect eQTLs (G) at FDR = 0.1 (open circles) and GxE eQTLs at LOD > 5 (closed squares) are shown. cM, centimorgans.
[See online article for color version of this figure.]
Table 1. Numbers of eQTLs by Treatment and Linkage Type at Different FDRs.
Polymorphisms in cis-regulator binding motifs are well known to contribute to the evolution of gene expression (Wray et al., 2003; Gompel et al., 2005; Wray, 2007; Wagner and Lynch, 2008; Rockman et al., 2010; Whittkopp and Kalay, 2012). In eQTL studies, the relative location of eQTLs to the open reading frames (ORFs) of each transcript can be used as an estimate of the relative contribution of cis-regulatory variation. We compared the number of local linkages (ORFs within 1.5-logarithm of odds [LOD] drop interval of their respective eQTL) to distant linkages across environmental conditions. A slight majority (54.0%) of eQTLs were local at an FDR of 0.1. However, consistent with other studies (Holloway et al., 2011), the ratio of local to distant eQTLs was sensitive to the FDR threshold, with local eQTLs becoming proportionally more abundant at more stringent thresholds (Table 1).
We found that genes with main-effect eQTLs were primarily enriched for response to stimulus and stress GO terms (Table 2). This included enrichment for many biotic interaction GO terms, such as immune response, immune system processes, and defense responses. Genes with eQTLs were also enriched for response to abiotic stress and chemical stimulus.
Table 2. GO Enrichment for Genes with Main-Effect eQTLs.
| GO Accession | Biological Process | Query | Reference | P Value | FDR |
|---|---|---|---|---|---|
| GO:0050896 | Response to stimulus | 298 | 2900 | 1.50E-21 | 4.00E-18 |
| GO:0006950 | Response to stress | 196 | 1647 | 4.80E-20 | 6.50E-17 |
| GO:0006952 | Defense response | 90 | 551 | 1.60E-16 | 1.40E-13 |
| GO:0002376 | Immune system process | 54 | 266 | 1.30E-13 | 6.80E-11 |
| GO:0006955 | Immune response | 54 | 265 | 1.10E-13 | 6.80E-11 |
| GO:0008219 | Cell death | 46 | 209 | 7.20E-13 | 2.80E-10 |
| GO:0016265 | Death | 46 | 209 | 7.20E-13 | 2.80E-10 |
| GO:0045087 | Innate immune response | 50 | 249 | 1.50E-12 | 4.90E-10 |
| GO:0012501 | Programmed cell death | 41 | 176 | 2.70E-12 | 8.10E-10 |
| GO:0006915 | Apoptosis | 29 | 122 | 2.80E-09 | 7.50E-07 |
| GO:0051707 | Response to other organism | 60 | 442 | 1.10E-08 | 2.70E-06 |
| GO:0009607 | Response to biotic stimulus | 62 | 468 | 1.40E-08 | 3.20E-06 |
| GO:0051704 | Multi-organism process | 70 | 580 | 4.90E-08 | 1.00E-05 |
| GO:0009628 | Response to abiotic stimulus | 99 | 1034 | 2.50E-06 | 0.00049 |
| GO:0007165 | Signal transduction | 80 | 789 | 3.50E-06 | 0.00063 |
| GO:0042221 | Response to chemical stimulus | 130 | 1476 | 3.80E-06 | 0.00064 |
| GO:0023046 | Signaling process | 81 | 811 | 5.10E-06 | 0.00077 |
| GO:0023060 | Signal transmission | 81 | 811 | 5.10E-06 | 0.00077 |
| GO:0023052 | Signaling | 98 | 1057 | 9.70E-06 | 0.0014 |
| GO:0009987 | Cellular process | 524 | 7802 | 3.50E-05 | 0.0047 |
| GO:0006979 | Response to oxidative stress | 30 | 236 | 0.00014 | 0.018 |
| GO:0009620 | Response to fungus | 19 | 117 | 0.00015 | 0.019 |
| GO:0050832 | Defense response to fungus | 15 | 81 | 0.00021 | 0.025 |
| GO:0009814 | Defense response; incompatible interaction | 16 | 91 | 0.00023 | 0.025 |
GxE eQTL Interactions
To identify eQTLs with effects dependent on soil moisture content (e.g., GxE eQTL interactions for transcript abundances), we conducted mapping on the difference (dry − wet) in transcript abundance across our treatments, as previously analyzed in yeast (Smith and Kruglyak, 2008). We found no significant GxE eQTLs at the FDR thresholds that we used for main-effect eQTLs. Therefore, with caution, we report here only the 60 genotype × environment eQTLs at LOD > 5 (Table 1; see Supplemental Data Set 4 online).
To assess whether mapping on the difference was potentially underpowered to detect GxE eQTLs, we also fit a full fixed effect model (i.e., G + E + GxE + error) to map eQTLs with R/qtl (see https://github.com/davidbryantlowry/TsuKas_eQTL for R script). We then compared the top LOD scores from all genes from the interaction of the full model to the top LOD scores from mapping the interaction with the difference. There was a very strong correlation (r = 0.849) between top LOD scores for the interaction from the full model and from the difference (see Supplemental Figure 1 online), demonstrating that very similar GxE eQTLs would be discovered using either method.
This list of genes with GxE eQTLs includes a number of notable genes including drought-induced 21 (ATD21), several natural antisense genes (AT5G20225, AT2G13665, and AT1G67365), and two late embryogenesis abundant proteins (AT5G44310 and AT2G231110). One of the most compelling GxE eQTLs was for the trait of Flowering Locus C (FLC; AT5G10140) expression, which mapped to the short arm of chromosome 4 (LOD = 7.42; Figure 3). This region of chromosome 4 contains the well-studied flowering time gene FRIGIDA (FRI), which is upstream of FLC. Sequencing of the Tsu-1 and Kas-1 genomes revealed a 376-bp deletion in the Tsu-1 allele of the FRI promoter (Lovell et al., 2013), which could be the ultimate cause of the FLC GxE eQTL. In contrast with single-treatment eQTLs, the majority of the 60 eQTLs with treatment interaction effects (58.3%) had distant linkages. This finding is consistent with Smith and Kruglyak (2008), who also found that distant linkages are more common for interaction eQTLs than for main-effect eQTLs.
Figure 3.

GxE eQTL Interaction for FLC.
Expression levels (log2 transformed and normalized) of FLC (AT5G10140) across wet and dry environments for RILs homozygous for the Tsu-1 (solid line) or Kas-1 (dashed line) allele at a marker located in the FRI (AT4G00650) gene.
Contrasting Associations for E and G Genes with Genomic Features
Recent studies have found features of genome architecture to be predictive of patterns of divergence between species and patterns of gene expression (Woody and Shoemaker, 2011; Rockman et al., 2010; Woody et al., 2011; Renaut et al., 2013). However, in plants, it is unknown whether genomic features are predictive of which genes change expression in response to the environment and which genes harbor natural variation in gene expression. If such associations exist, it would suggest a potential role for genome architecture in the evolution of functional gene expression. To test this possibility, we examined whether the following genome features (gene size [fully transcribed region], gene density, local recombination rate, and nucleotide polymorphism in promoters) are predictive of genes responding to the environment (E) and/or for genes with local main-effect eQTLs (G). We did not examine potential associations for local GxE eQTLs because such analyses were underpowered by a low sample size (n = 25; Table 1).
In addition to our resequencing data on the Kas-1 and Tsu-1 parents, we used several available data sets to estimate summary statistics of genomic features for every gene for which data existed. Gene size (genome-wide median across genes = 2091 bp) and gene density (median = 28.75 genes/100 kb) were calculated using TAIR10 annotations. We calculated species-wide local recombination rates (median = 0.84763 ρ/100 kb) with data from a recent study that estimated historical recombination rates using genetic variation information from 1307 accession (Horton et al., 2012). To standardize analyses of promoter polymorphism, we focused on the 1000 bp upstream of the transcriptional start site of genes. We estimated species-wide promoter summary statistics for segregating sites (median θ = 0.00806), pairwise divergence (median π = 0.00427), and deletions (median = 2.6125 deletions/kb) from the first available 80 genomes of the Arabidopsis 1001 genome project (Cao et al., 2011). Every gene harbored polymorphism in their 1000-bp promoters across the 80 genomes. We found a significant, albeit weak, positive correlation between local recombination rate and polymorphism in promoters (n = 22,842 genes; θ: R2 = 0.084; P < 0.0001; π: R2 = 0.063; P < 0.0001). Finally, we used the resequenced Kas-1 and Tsu-1 genomes to calculate SNP divergence (median = 0.004 SNPs/bp) in all 1000-bp promoter regions. The vast majority of genes (87.0%) had at least one SNP difference in the 1000-bp promoter between the Tsu-1 and Kas-1 genomes. The distributions of these genome-wide summary statistics are presented in Figure 4 and Supplemental Figures 2 to 5 online.
Figure 4.

Distribution of Four Summary Statistics across Chromosome 1.
(A) Species-wide estimates of θ and (B) π were calculated for 1000-bp promoters of genes from the first 80 genomes of the 1001 Arabidopsis genome project (Cao et al. 2011).
(C) Pairwise divergence between the Tsu-1 and Kas-1 genomes for 1000-bp promoters.
(D) Species-wide estimates of recombination rate were calculated by Horton et al. (2012).
Centromere region is excluded. Data smoothed with a sliding 100-kb window (25-kb step). Similar plots for chromosomes 2 to 5 are provided as Supplemental Figures 2 to 5 online.
[See online article for color version of this figure.]
Following our summary of genomic features, we tested whether these features are predictive of which genes responded to the treatment (E) and which genes had eQTLs (G). Since the distribution for all genomic features was skewed, we tested for associations with nonparametric Wilcoxon ranked-sum tests. E genes, which changed expression in response to the treatment at an FDR of 0.001, had significantly lower promoter polymorphism than other genes in the genome for θ, π, and deletions across the 80 genomes of Arabidopsis (Table 3). There was also a lower level of SNP divergence in promoters of E genes between Tsu-1 and Kas-1. This suggests that treatment responsive genes have on average more conserved promoters than other genes in the genome. E genes were also found in regions with lower recombination rates and positively associated with gene length (Table 3).
Table 3. Associations of Genomic Features with Genes Responding to the Treatment (E) at an FDR of 0.001 (Wilcoxon Ranked-Sum Tests).
| Genomic Feature | N FDR < 0.001 | N FDR > 0.001 | Median FDR < 0.001 | Median FDR > 0.001 | W | P Value |
|---|---|---|---|---|---|---|
| Gene size (bp) | 5,580 | 20,060 | 2,405 | 2006 | 66,135,430 | 2.20E-16 |
| Gene density (100 kb) | 5,561 | 18,071 | 29 | 28.75 | 51,819,028 | 0.0004071 |
| Parental divergence (SNP/bp) | 5,564 | 18,081 | 0.003 | 0.004 | 48,204,299 | 2.23E-06 |
| Segregating sites (θ) | 5,480 | 17,589 | 0.00742 | 0.00792 | 44,926,310 | 3.18E-14 |
| Average pairwise (π) | 5,480 | 17,589 | 0.00381 | 0.00418 | 45,581,188 | 1.28E-09 |
| Deletions (bp/kb) | 5,480 | 17,589 | 2.35 | 2.575 | 45,642,884 | 3.10E-09 |
| Recombination rate (ρ/100kb) | 5,503 | 17,903 | 0.814 | 0.858 | 47,762,128 | 0.0006329 |
N, number of genes; W, Wilcoxon test statistic
Almost all genomic features were highly associated with the occurrence of local main-effect eQTLs (G genes). Across treatments, genes with local eQTLs were longer, located in regions with higher recombination rates, had elevated rates of species-wide polymorphism in promoters (θ, π, and deletions), and were more divergent in promoter regions between Kas-1 and Tsu-1 (Figure 5, Table 4). Thus, G genes have opposite associations with promoter polymorphism and local recombination rate than E genes.
Figure 5.

Genes with eQTLs Harbor Greater Polymorphism in Their Promoters.
Box plots comparing the difference in summary statistics for 1000-bp promoters between genes with and without local eQTLs.
Table 4. Associations of Local eQTL Genes (G) with Genomic Features (Wilcoxon Ranked-Sum Tests).
| Mapping Population | Genomic Feature | N with eQTL | N without eQTL | Median with eQTL | Median without eQTL | W | P Value |
|---|---|---|---|---|---|---|---|
| TsuKas | Parental divergence (SNP/bp) | 796 | 22,849 | 0.0065 | 0.003 | 11,587,792 | 2.20E-16 |
| No. of array probes | 815 | 24,847 | 10 | 10 | 10,694,198 | 6.17E-03 | |
| Gene size (bp) | 814 | 24,826 | 2458 | 2079 | 11,803,504 | 2.89E-16 | |
| Gene density (100 kb) | 796 | 22,836 | 28.5 | 28.75 | 8,890,780 | 0.2954 | |
| Segregating sites (θ) | 751 | 22,318 | 0.00889 | 0.00775 | 9,429,451 | 5.10E-09 | |
| Average pairwise (π) | 751 | 22,318 | 0.00541 | 0.00404 | 9,840,370 | 4.18E-16 | |
| Deletions (bp/kb) | 751 | 22,318 | 3.2125 | 2.4875 | 9,196,786 | 5.42E-06 | |
| Recombination rate (ρ/100 kb) | 791 | 22,615 | 0.99888 | 0.84229 | 9,850,496 | 1.23E-06 | |
| BurCol | Gene size (bp) | 1,555 | 23,286 | 2052 | 1991 | 18,856,320 | 6.06E-03 |
| Gene density (100kb) | 1,535 | 23,007 | 28.25 | 28.75 | 17,302,342 | 0.1858 | |
| Segregating sites (θ) | 1,459 | 22,354 | 0.00878 | 0.00791 | 17,740,572 | 1.76E-08 | |
| Average pairwise (π) | 1,459 | 22,354 | 0.00495 | 0.00415 | 18,165,446 | 2.79E-13 | |
| Deletions (bp/kb) | 1,459 | 22,354 | 3.10 | 2.58 | 17,389,700 | 2.09E-05 | |
| Recombination rate (ρ/100 kb) | 1,531 | 22,773 | 0.9786 | 0.8518 | 18,743,140 | 8.17E-07 | |
| CviCol | Gene size (bp) | 1,983 | 22,858 | 2005 | 1993 | 23,189,122 | 8.63E-02 |
| Gene density (100kb) | 1,966 | 22,576 | 28.5 | 28.75 | 22,128,460 | 0.8324 | |
| Segregating sites (θ) | 1,887 | 21,926 | 0.00871 | 0.00788 | 22,688,410 | 2.87E-12 | |
| Average pairwise (π) | 1,887 | 21,926 | 0.00498 | 0.00413 | 23,298,610 | 2.20E-16 | |
| Deletions (bp/kb) | 1,887 | 21,926 | 3.075 | 2.5625 | 22,001,346 | 4.51E-06 | |
| Recombination rate (ρ/100 kb) | 1,951 | 22,353 | 0.9759 | 0.8504 | 23,432,606 | 4.37E-08 | |
| BaySha | Gene size (bp) | 1,504 | 23,337 | 2116 | 1986 | 18,749,188 | 8.55E-06 |
| Gene density (100 kb) | 1,491 | 23,051 | 28.75 | 28.75 | 16,824,708 | 0.1747 | |
| Segregating sites (θ) | 1,436 | 22,377 | 0.00903 | 0.00789 | 18,172,749 | 2.20E-16 | |
| Average pairwise (π) | 1,436 | 22,377 | 0.00517 | 0.00413 | 18,661,320 | 2.20E-16 | |
| Deletions (bp/kb) | 1,436 | 22,377 | 3.2313 | 2.5625 | 17,516,056 | 9.49E-09 | |
| Recombination rate (ρ/100 kb) | 1,473 | 22,831 | 0.97305 | 0.85253 | 17,910,273 | 2.71E-05 |
To test whether local eQTL (G) occurrence is robustly associated with genomic features, we analyzed local eQTL occurrence across three other eQTL mapping data sets (Cvi-0 × Columbia-0 [Col-0], Bur-0 × Col-0, and Bay-0 × Shahdara), recently published by Cubillos et al. (2012a). We found that genomic features were predictive of eQTL occurrence in the same way across these three mapping populations as they were for the TsuKas RILs (Table 4). We also tested and found that patterns of associations for E and G genes in the TsuKas RILs held up when we used a longer upstream sequence to define promoters (1500 and 2000 bp; see Supplemental Tables 1 and 2 online). Finally, it should be noted that the number of microarray probes per gene had a small, but significant, positive association with genes with eQTLs (Table 3).
DISCUSSION
Our study identified thousands of soil drying–responsive genes and hundreds of eQTLs underlying genetic variation in leaf transcript abundances in an Arabidopsis RIL mapping population. This includes 810 drought-responsive genes that currently lack annotation of function on The Arabidopsis Information Resource. Genome wide, we discovered over 1500 main-effect eQTLs. However, there were very few GxE eQTLs, which was surprising given known genotype × environment differences in physiology for Kas-1 and Tsu-1 (McKay et al., 2003, 2008; Verslues and Juenger, 2011). Both soil drying–responsive genes (E) and genes with local eQTLs (G) were associated with genomic features, but in contrasting ways.
The Causes of Genotype × Environment Interactions
Understanding why individuals, populations, and species respond differently to environmental conditions is of fundamental importance to biology (Clausen, 1951; Stebbins, 1952; Bohnert et al., 1995; Bray, 1997; Roux et al., 2006; Cattivelli et al., 2008; Des Marais and Juenger, 2010). Genotype × environment interactions in morphology, physiology, and development could be the result of genotype × environment interactions in gene expression or could be the result of constitutive differences in gene expression among genotypes. Furthermore, there is no reason to assume that any given genotype × environment interaction is the result of evolution in gene expression. There are numerous examples of changes in protein coding regions that play a large role in adaptation to environmental stress (reviewed in Hoekstra and Coyne, 2007).
We found very few GxE eQTLs that might help explain previously identified gene × environment physiological differences in the responses of Kas-1 and Tsu-1 to soil drying (McKay et al., 2003, 2008). Even so, there were a few notable genotype × environment eQTLs with a LOD > 5. The FLC GxE eQTL interaction mapping to the FRI locus (Figure 3) was one of the most compelling interaction eQTLs. The magnitude of effect of natural variation at the FRI locus is known to be affected by cold vernalization (Wilczek et al., 2009). These results, as well as those of Lovell et al. (2013), suggest that drought may also modulate the effect of natural variation at the FRI locus, with the functional Kas-1 allele promoting the elevated expression of FLC in drier environmental conditions.
Limited statistical power may explain the relatively few GxE eQTLs detected in our study. However, we did map over 1500 significant main effect eQTLs, which indicates sufficient power to map at least moderate effect eQTLs. Cell and tissue heterogeneity may also inhibit the detection of GxE eQTL interactions. Smith and Kruglyak (2008) identified 1555 GxE eQTL interactions in yeast, but argued that the heterogeneity of expression response across tissues of multicellular organisms could make it more difficult to detect interactive eQTL effects. Indeed, Li et al. (2006) only identified 203 GxE eQTL interactions in Caenorhabditis elegans. Likewise, our pooling of leaves from different individuals for RNA extractions may also have obscured our ability to detect GxE eQTLs. Other studies of eQTL interactions with the environment have primarily focused on cis-regulation in human cell culture (Grundberg et al., 2011; Maranville et al., 2011; Barreiro et al., 2012), where tissue heterogeneity is less likely to be an issue. Those studies have generally only examined the robustness of eQTL detection across environmental conditions, rather than explicitly testing for GxE eQTL interactions as done here and by Smith and Kruglyak (2008). For example, Grundberg et al. (2011) found that 93% of eQTLs were detected in more than one out of 18 different human cell culture conditions.
Patterns of GO Enrichment
The genes that responded to the soil water treatment (E) were enriched for many GO terms that have been found in other studies of soil drying effects on gene expression (Juenger et al., 2010; Wilkins et al., 2010; Des Marais et al., 2012). The general pattern of downregulation of photosynthesis and many metabolic processes coupled with the upregulation of abiotic stress response genes is typical of changes in soil water content and suggests our methodology is sound.
Many of the GO terms enriched for main effect eQTLs (G) were associated with response to biotic and abiotic stresses. Cubillos et al. (2012a) found similar patterns of GO enrichment for genes with eQTLs across three mapping and argued that these enrichments may reflect local adaptation between Arabidopsis accessions. Furthermore, the enrichment of immune responses for eQTL genes could potentially indicate hybrid incompatibilities between Tsu-1 and Kas-1 (Bomblies and Weigel, 2007; Bomblies et al., 2007; Bomblies, 2009).
The Importance of Genome Architecture
Our study found that genomic features are predictive of whether a gene responds to environmental perturbation (E) or has a local eQTL (G). In addition, we found the same relationships between genomic features and genes with eQTLs across three other independent mapping populations (Cubillos et al., 2012a), which supports the hypothesis that these associations are common across Arabidopsis. The pattern of greater promoter polymorphism in genes with eQTLs (G) is striking when contrasted to genes responding to the soil drying treatment (E), which have significantly lower than average levels of promoter polymorphism. Taken together, these results indicate that genes involved in abiotic stress response have promoters that are more evolutionarily conserved, while genes with eQTLs have less conserved promoters. Overall, the fact that species-wide patterns of polymorphism, from 80 genomes that did not include Kas-1 or Tsu-1, are predictive of which genes have eQTLs suggests the possibility that genome architecture plays a role in generating this pattern. The question remains as to the causes of these associations with genomic features.
One possible reason why genes responding to the treatment (E) have more conserved promoters is that mutations that alter gene expression of stress-responsive genes are more deleterious than for other genes in the genome. Just as there are core developmental genes that cause large phenotypic changes when altered (Alonso-Blanco et al., 2009; Hay and Tsiantis, 2010; Bowman et al., 2012), there may be core genes involved in stress response that must function optimally when a plant is exposed to stress. Mutations in these genes would be eliminated by natural selection, leading to lower levels of promoter polymorphism (Lynch, 2007). As mentioned above, many crucial genes involved in photosynthesis and metabolism are downregulated in response to drought. Such important genes may also be less tolerant of mutations that alter gene expression. By contrast, genes with local eQTLs (G) may be more tolerant of mutations that alter gene expression and thus experience fewer bouts of natural selection that would reduce polymorphism in their promoters.
Heterogeneity in recombination rate across the genome could also be a major cause of the association between genomic features and genes with local eQTLs. Variation in recombination rate has been implicated in producing heterogeneity across the genome in both nucleotide diversity within species and divergence between species (McGaugh et al., 2012; Renaut et al., 2013; Roesti et al., 2013). If patterns of nucleotide variation can be affected by heterogeneity in recombination, then it is possible that natural variation in gene expression (eQTLs) could follow a similar pattern. In fact, a recent eQTL experiment in C. elegans found a major association between genomic features and genes with eQTLs (Rockman et al., 2010). In that study, chromosome arms were found to harbor far more eQTLs than chromosome centers. Rockman et al. (2010) argued that this pattern is likely the result of lower recombination rates in chromosome centers and higher rates in chromosomal arms. This is because selection acting at any given site will impact the frequency of polymorphisms at linked sites on the same chromosome (Hill and Robertson, 1968; Smith and Haigh, 1974; Charlesworth et al., 1993, 1997; Nordborg et al., 2005; McGaugh et al., 2012). In regions of elevated recombination (e.g., chromosome arms in C. elegans), linkage is reduced between sites such that selection has less impact on adjacent chromosomal positions and polymorphism is preserved. Recombination is also mutagenic and can increase polymorphism directly (Hellmann et al., 2003). However, a recent study in Drosophila melanogaster found that the combined contribution of recombination and selection on diversity appears to be substantially larger than recombination’s mutagenic effect (McGaugh et al., 2012).
The association of recombination rate with eQTL occurrence appears to be lower in Arabidopsis than C. elegans. Furthermore, while genes with eQTLs in Arabidopsis are associated with higher recombination and have elevated promoter diversity, these genes are not clustered in particular chromosomal regions, as in C. elegans (Rockman et al., 2010). Instead, there are many islands of elevated recombination and polymorphism across the Arabidopsis genome. For example, a region of chromosome 1, from ∼21 to 24 Mb, has elevated rates of polymorphism and recombination (Figure 4). This island has been observed previously and attributed to locally elevated rates of balancing selection (Clark et al., 2007) or elevated mutation rates (Yang and Gaut, 2011). Our results suggest that recombination rate may also play a role in elevating polymorphism in this region. It should be noted that our estimation of recombination rate came from a population genetic study (Horton et al., 2012). Greater associations might be found if recombination had been measured in crosses (McGaugh et al., 2012; Roesti et al., 2013).
One striking similarity between genes with eQTLs (G) and those that respond to soil drying (E) is that both categories contained genes that were on average longer than expected by chance. The breadth of gene expression across tissues is known to generally be a function of gene size, although the relationship is different for genes expressed at low versus high levels (Woody and Shoemaker, 2011; Woody et al., 2011). The mechanisms underlying those relationships are unknown but could involve selection for more efficient transcription and translation (Urrutia and Hurst, 2003; Seoighe et al., 2005) or reflect the larger mutational target size of longer genes in the case of eQTLs. Our study provides an additional dimension to the relationship by linking eQTL occurrence with gene length.
While our study has revealed multiple contrasting associations between genomic features and categories of genes (E versus G), our data are not sufficient to determine the causes of these associations. Future studies are needed to distinguish between the multiple potential mechanisms that drive these patterns. As recent studies have shown (Rockman et al., 2010; Woody and Shoemaker, 2011; McGaugh et al., 2012; Renaut et al., 2013; Roesti et al., 2013), genome architecture can have a profound effect on the evolution of individual genes. More detailed empirical analysis and theoretical work is clearly needed to determine the extent to which the architecture of genomes impacts the evolution of organismal phenotypes.
METHODS
Plant Materials and Growth Conditions
Seed of 108 RILs, from reciprocal crosses between Arabidopsis thaliana accessions Kas-1 (CS903) and Tsu-1 (CS1640), were sown on fritted clay (Profile Products) in 2.5-inch pots. Plants were arranged in a randomized complete block design consisting of four blocks (two replicate plants per treatment). Pots were refrigerated at 4°C in darkness for 6 d to cold-stratify the seeds prior to commencement of a 12-h photoperiod in Conviron ATC60 growth chambers (Controlled Environments), at 23°C and 40% humidity during the day and 20°C and 50% humidity during the dark period. Photosynthetic photon flux density was ∼330 µmol m−2 s−1. After 4 weeks of growth, half of the plants were given a drought treatment, while the others remained fully watered to optimal conditions. The drought treatment was randomly assigned to two of the four blocks and consisted of a slow decrease in soil moisture content over the course of 1 week. Each day, all pots assigned to the drought treatment were weighed, and water was added to individual pots to bring them to the target gravimetric water content. The target water content decreased each day in the following series: 100, 90, 80, 70, 60, 45, and 40% of field capacity. At the end of the treatment, leaf tissue was collected from both treatments for RNA extraction.
Resequencing of the Tsu-1 and Kas-1 Genomes
Nuclear DNA was extracted from Tsu-1 and Kas-1 parental lines and used to prepare sequencing libraries. Illumina library preparation and sequencing following standard protocols was performed at the University of California, Davis DNA Technologies Core Facility (http://dnatech.genomecenter.ucdavis.edu/). Genomic DNA was fragmented to an average size of 300 bp using the Bioruptor Standard (Diagenode). Illumina libraries were prepared from 300 ng of fragmented DNA on the Apollo 324 using the PrepX DNA library protocol following the manufacturer's protocol (IntegenX). Ligated DNA fragments were enriched with 15 cycles of PCR before library quantification and validation. To minimize amplification bias, individual libraries were prepared for each sequencing lane (three KAS libraries for three sequencing lanes; one TSU library for one sequencing lane). Libraries were sequenced on the Illumina GAIIx platform, single-end reads of 80 cycles were collected, and FASTQ files were generated using the Illumina pipeline.
The Tsu-1 and Kas-1 genome assemblies were constructed using the SHORE short-read assembler (Ossowski et al., 2008). We combined our raw sequencing data of Tsu-1 with a published assembly for this line released with Ossowski et al. (2008). We conducted quality-based trimming, such that a Phred score of <20 at two consecutive bases was the cutoff for any given read. As a result, single-end 83-bp reads were trimmed to an average of 75 bp prior to assembly. The assemblies used in these analyses are reference-based assemblies using the TAIR9 Columbia genome release and contain only SNP calls with at least support of 25 reads and 100% concordance, making this a conservative assembly with regards to SNPs. Insertions and deletions were disregarded for the purposes of our analyses. Overall, the parental genome assemblies for Tsu-1 and Kas-1 had a minimum of 25× coverage and 100% concordance at SNP calls (average coverage 44× and 40×, respectively).
Microarray Analysis
Leaf tissue was collected from RILs, preserved in RNAlater (Life Technologies), and stored at −80°. Total RNA was extracted from the tissue with an RNeasy plant mini kit (Qiagen) using the optional DNase treatment. The integrity of total RNA was qualified by Agilent Bioanalyzer 2100 capillary electrophoresis. RNA of the two replicate plants in each treatment was pooled prior to microarray hybridization. For target preparation, 7 µg of total RNA from each sample was converted without amplification to double-stranded cDNA using random primers and the GeneChip Whole Transcript Double-Stranded cDNA synthesis kit (Affymetrix) according to the manufacturer’s instructions. Sample cleanup was performed using the GeneChip Sample Cleanup Module, and cDNA samples were then quantified by spectrophotometric UV measurement on a ND-1000 Nanodrop device. Fragmentation and end labeling with biotin were performed using the GeneChip Whole Transcript Double-Stranded DNA Terminal labeling kit (Affymetrix), all according to the manufacturer’s instructions. Before labeling, the fragmented products were checked again on an Agilent Bioanalyzer 2100 to ensure fragmentation was complete. Fifty microliters (∼5 µg) of each fragmented, labeled sample was submitted to Asuragen for hybridization to Arabidopsis atSNPTILE array (Affymetrix; Zhang et al., 2007), scanning, and image analysis. Array hybridization, washing, staining, and scanning were performed using proprietary Asuragen hybridization protocols and reagents, the GeneChip Fluidics Station 450 (Affymetrix), GeneChip Scanner 3000 7G, and GeneChip operating software (Affymetrix), all according to the manufacturer’s instructions.
Processing of Microarray Expression Data
CEL files were imported into the program JMP Genomics (SAS Institute Inc., Cary, NC, USA), and gene expression measures were generated using a log2 transformation and quantile normalization of raw probes intensities, followed by a mean summary of probe sets. Probe sets were defined using a custom CDF file for the array (Dai et al., 2005) constructed from TAIR9 of the Arabidopsis genome (available for download at http://brainarray.mbni.med.umich.edu/Brainarray/Database/CustomCDF/genomic_curated_CDF.asp; Dai et al., 2005). In addition, we removed all probes that were identified as having sequence polymorphisms among Tsu-1, Kas-1, and Col-0 based on the parental resequencing data. We used 340,634 25-mer probes corresponding to 26,887 Arabidopsis genes to estimate gene level transcript abundances. Analysis of pairwise divergence between each parent and the Columbia reference of the Tsu-1 and Kas-1 genomes revealed that 40,840 of the probes contained SNPs. Those probes were excluded from further analyses. We required a minimum of three probes per gene to include a given gene in our analysis. Initial array processing schemes also incorporated a spatial correction to raw probe intensity measures. However, quality control steps and early QTL mapping analyses suggested that these steps reduced the signal in the data. As such, our final analyses relied on gene expression measures obtained without spatial correction.
To identify artifacts in our data set, we conducted principal components analysis on transcripts derived from the remaining ORFs. The first principal components in wet and dry conditions were plotted against each other and visually inspected. Four RILs, representing eight arrays (wet and dry), had strikingly greater principal component 1 values than the rest of the RILs (see Supplemental Figure 6 online). These arrays were confounded with hybridization processing (e.g., hybridization cocktail and hybridization station). Given this information, we chose to eliminate these eight arrays from the analysis.
Treatment Effects on Gene Expression
We explored the effect of soil drying on gene expression using a simple mixed-model analysis of variance including treatment as a fixed effect and batch (six total batches of confounding RNA extraction and microarray processing) as a random effect with JMP Genomics. An empirical Bayes approach was used to shrink the residual variance for each expression measure based on a prior distribution of the variance estimated from all genes using an inverted gamma distribution. This approach resulted in increased power and sensitivity by improving the stability of the residual variance estimates.
eQTL Mapping
Expression measures for each transcript in each environment were used for subsequent genome-wide eQTL scans (see https://github.com/davidbryantlowry/TsuKas_eQTL for scripts). Overall, our experiment is in the format of a classic two-environment factorial design. There are multiple ways to analyze this type of design in an eQTL mapping context (Li et al., 2006; Smith and Kruglyak, 2008; Grundberg et al., 2011; Maranville et al., 2011; Barreiro et al., 2012). Here, we conducted mapping using a simple statistical approach to identify main effect eQTLs across the treatments as well as GxE eQTL interactions. Our experimental design had a factorial structure: Every RIL was phenotyped in two environments. Our goal was to identify the QTLs that contribute to phenotypic variability in each transcript trait (main-effect QTL) and the loci whose effect depend on the environment (GxE interaction).
Let yij be the trait value in the ith RIL in the jth environment [i = 1(1)n; j = 1, 2], gi be the QTL genotype of the ith RIL, and xj be the environmental covariate in the jth environment. In our experiment, gi takes the values −1, 1 depending on whether the QTL is inherited from Tsu or Kas, and xj = −1, 1 depending on whether the dry or wet treatment was applied.
Assume the following generative model for the data:
where βo, β1, β2, and β3 are fixed effects (general mean, QTL main effect, environmental effect, and GxE interaction, respectively), αi is a random effect with mean 0 and variance τ2, and εij is random error with mean 0 and variance σ2.
Note that the random effect αi is used to capture the polygenic effect on a RIL and induces a correlation in the traits from a common RIL in two environments. If τ2 = 0, this model reduces to a fixed effects “full” model with a main effect for QTL and environment and a GxE effect.
Consider the sum and the difference under this model.
Sum:
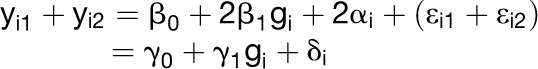 |
where γ0= 2β0, γ1= 2β1, δi= 2αi+εi1+εi2(has mean = 0, variance = 4τ2 + 2σ2)
Difference:
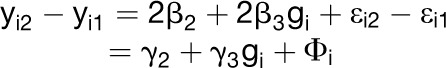 |
where γ2= 2β2, γ3= 2β3, Φi= εi2-εi1(has mean = 0, variance = 2σ2)
Note that γ1 = 0 iff β1 = 0; in other words, we find a QTL for the sum (yi1 + yi2) iff there is a main effect QTL. Similarly, γ3 = 0 iff β3 = 0; in other words, we find a QTL for the difference (yi2 − yi1) iff there is GxE.
Thus, genome scans for the sum and difference are equivalent to running genome scans for main-effect and GxE QTLs by fitting a full fixed-effect model. The resulting analysis takes into account trait correlations due to a common polygenic component in both environments and makes no assumption about homogenenity of variances in the two environments. In this sense, it is a more general and robust alternative to fitting a fixed-effect model (assuming τ2 = 0).
To map eQTLs, we conducted interval mapping (Haley-Knott regression) with the scanone function of R/qtl, a module of the statistical package R (Broman et al., 2003). A linkage map for the TsuKas RIL population has been described previously (McKay et al., 2008). To this map we added eight additional simple sequence length polymorphism markers and 55 single nucleotide polymorphism markers, based on the Sequenom MassARRAY genotyping platform (Sequenom). We added these markers using JoinMap4 (Van Ooijen, 2006) with the Kosambi mapping function, for a total of 168 markers and a total map length of 452.7 centimorgans. The map and genotype matrix of the TsuKas RILs are reported in Supplemental Data Set 5 online. We controlled for the effect of cytoplasm and array processing batch by fitting them as additive covariates in our model during interval mapping. Following interval mapping, we summarized the data by extracting the lowest genome-wide permutation corrected P value per each expression trait. The distribution of lowest P values derived from the mapping of all measured transcripts was then analyzed in R with the QVALUE package (Storey and Tibshirani, 2003) to determine an appropriate FDR. P value thresholds were determined for four FDRs (0.2, 0.15, 0.1, and 0.05). We calculated the additive effects and proportion of the variance explained for each eQTL using the R/eqtl package (Cubillos et al., 2012a).
To determine the relative contribution of local and distant eQTL linkages, we examined whether target transcripts fell within the 1.5-LOD drop confidence intervals of their respective eQTL. To establish the location of genes on the Tsu-1 × Kas-1 map, we fit linear regression models for each chromosome of centimorgan marker locations in the Tsu-1 × Kas-1 map against the physical map location of those markers in the Columbia (Col-0) genome. The regression models were then used to plot the map location of each eQTL with the genomic location of each study transcript.
Genomic Features Analyses
TAIR10 annotations (www.Arabidopsis.org) were used to calculate gene size, gene density, and define the regions for promoter analyses. Local gene density was estimated for each ORF with a 100-kb sliding window and a 25-kb step speed. Promoters were defined as the 1000-bp region upstream of transcriptional start site, regardless of whether this region overlapped with another gene. Promoter regions were extracted from 80 genomes of Arabidopsis, which were previously sequenced and aligned to the Col-0 reference (Cao et al., 2011). Promoters with >50% missing data were excluded from analyses. Average pairwise divergence (π), the number of segregating sites (S), and average number of deletions per kilobase were calculated for all remaining promoters. Nucleotide polymorphism was estimated as θ = S/a1, where a1 = 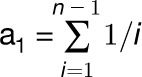 and n = the number of sequences (Watterson, 1975). Similarly, we calculated pairwise promoter divergence between Tsu-1 and Kas-1. Appropriate adjustments were made to all summary statistics to account for missing data and deletions. We estimated species-wide local recombination rate with data from a recent study based on 214,051 SNP polymorphisms screened in 1307 natural accessions (Horton et al., 2012).
Wilcoxon ranked-sum tests were used to test for differences in genome architecture and population genetic summary statistics between genes with and without local eQTLs. We conducted the same analyses for gene with treatment effects less than an FDR of 0.001 (E) versus the remaining genes in our data set. All analyses for the TsuKas mapping population were limited to the 25,662 genes in our expression data set. Likewise, we limited the analysis of the CviCol, BurCol, and BaySha mapping populations to the 24,900 genes surveyed by Cubillos et al. (2012a).
Accession Numbers
The array hybridizations from this study are accessible through the Gene Expression Omnibus series accession number GSE42408 (http://www.ncbi.nlm.nih.gov/geo/query/acc.cgi?acc=GSE42408). The Kas-1 and Tsu-1 Illumina data are available through the National Center for Biotechnology Information sequence read archive study accession numbers SRP000248 and SRP018903 (http://www.ncbi.nlm.nih.gov/sra). The Kas-1 and Tsu-1 assembled genomes are available as part of the 1001 Arabidopsis genomes project (http://www.1001genomes.org/).
Supplemental Data
The following materials are available in the online version of this article.
Supplemental Figure 1. Comparison of GxE eQTL Interaction Mapping Methods.
Supplemental Figure 2. Distribution of Four Summary Statistics across Chromosome 2.
Supplemental Figure 3. Distribution of Four Summary Statistics across Chromosome 3.
Supplemental Figure 4. Distribution of Four Summary Statistics across Chromosome 4.
Supplemental Figure 5. Distribution of Four Summary Statistics across Chromosome 5.
Supplemental Figure 6. Identification of Problematic Microarrays.
Supplemental Table 1. Associations of Genomic Features with Genes Responding to Treatment (E) at an FDR of 0.001 for Longer Promoter Lengths (Wilcoxon Ranked-Sum Tests).
Supplemental Table 2. Associations of Genes with Local eQTLs (G) and Genomic Features for Longer Promoter Lengths (Wilcoxon Ranked-Sum Tests).
Supplemental Data Set 1. Normalized Gene Expression for the 25,662 Transcripts Surveyed in the Wet and Dry Treatments.
Supplemental Data Set 2. Gene Ontology Enrichment for Transcriptional Response in the Dry Treatment Relative to the Wet Treatment.
Supplemental Data Set 3. Significant Main Effect eQTLs at an FDR of 0.1.
Supplemental Data Set 4. Significant GxE eQTL Interactions at LOD > 5.
Supplemental Data Set 5. Linkage Map and Genotype Matrix for the TsuKas RIL Population.
Acknowledgments
We thank two anonymous reviewers and the following for information, advice, and input that improved our experimental design, analysis, and writing of the article: Luis Barreiro, Francisco Cubillos, David Des Marais, Kyle Hernandez, Mathew Horton, Olivier Loudet, Jack Mullen, Athma Pai, John Paul, Mathew Rockman, and Jenny Tung. This research was supported by National Science Foundation 2010 program funding to T.E.J. (DEB-0618347), J.H.R. (DEB-0618347), and J.K.M. (DEB-0618302 and DEB-1022196). D.B.L. was supported by a USDA National Institute of Food and Agriculture-Agriculture and Food Research Initiative postdoctoral fellowship (2011-67012-30696).
AUTHOR CONTRIBUTIONS
T.E.J., J.K.M., J.H.R., and S.S. designed the research. J.K.M. and T.L.L. performed the experiment. C.S.H., D.B.L., L.J.D.-W., L.S., and T.E.J. analyzed the data. D.B.L. and T.E.J. wrote the article.
Glossary
- eQTL
expression quantitative trait locus
- RIL
recombinant inbred line
- ABA
abscisic acid
- SNP
single nucleotide polymorphism
- FDR
false discovery rate
- GO
gene ontology
- ORF
open reading frame
- LOD
logarithm of odds
- Col-0
Columbia-0
References
- Alonso-Blanco C., Aarts M.G., Bentsink L., Keurentjes J.J., Reymond M., Vreugdenhil D., Koornneef M. (2009). What has natural variation taught us about plant development, physiology, and adaptation? Plant Cell 21: 1877–1896 [DOI] [PMC free article] [PubMed] [Google Scholar]
- Barreiro L.B., Tailleux L., Pai A.A., Gicquel B., Marioni J.C., Gilad Y. (2012). Deciphering the genetic architecture of variation in the immune response to Mycobacterium tuberculosis infection. Proc. Natl. Acad. Sci. USA 109: 1204–1209 [DOI] [PMC free article] [PubMed] [Google Scholar]
- Begun D.J., Aquadro C.F. (1992). Levels of naturally occurring DNA polymorphism correlate with recombination rates in D. melanogaster. Nature 356: 519–520 [DOI] [PubMed] [Google Scholar]
- Bohnert H.J.N., Nelson D.E., Jensen R.G. (1995). Adaptations to environmental stresses. Plant Cell 7: 1099–1111 [DOI] [PMC free article] [PubMed] [Google Scholar]
- Bomblies K. (2009). Too much of a good thing? Hybrid necrosis as a by-product of plant immune system diversification. Botany 87: 1013–1022 [Google Scholar]
- Bomblies K., Lempe J., Epple P., Warthmann N., Lanz C., Dangl J.L., Weigel D. (2007). Autoimmune response as a mechanism for a Dobzhansky-Muller-type incompatibility syndrome in plants. PLoS Biol. 5: e236. [DOI] [PMC free article] [PubMed] [Google Scholar]
- Bomblies K., Weigel D. (2007). Hybrid necrosis: Autoimmunity as a potential gene-flow barrier in plant species. Nat. Rev. Genet. 8: 382–393 [DOI] [PubMed] [Google Scholar]
- Bowman J.L., Smyth D.R., Meyerowitz E.M. (2012). The ABC model of flower development: Then and now. Development 139: 4095–4098 [DOI] [PubMed] [Google Scholar]
- Bray E.A. (1997). Plant responses to water deficit. Trends Plant Sci. 2: 48–54 [Google Scholar]
- Breitling R., Li Y., Tesson B.M., Fu J.Y., Wu C., Wiltshire T., Gerrits A., Bystrykh L.V., de Haan G., Su A.I., Jansen R.C. (2008). Genetical genomics: Spotlight on QTL hotspots. PLoS Genet. 4: e1000232. [DOI] [PMC free article] [PubMed] [Google Scholar]
- Brem R.B., Yvert G., Clinton R., Kruglyak L. (2002). Genetic dissection of transcriptional regulation in budding yeast. Science 296: 752–755 [DOI] [PubMed] [Google Scholar]
- Broman K.W., Wu H., Sen S., Churchill G.A. (2003). R/qtl: QTL mapping in experimental crosses. Bioinformatics 19: 889–890 [DOI] [PubMed] [Google Scholar]
- Cao J., et al. (2011). Whole-genome sequencing of multiple Arabidopsis thaliana populations. Nat. Genet. 43: 956–963 [DOI] [PubMed] [Google Scholar]
- Cattivelli L., Rizza F., Badeck F.W., Mazzucotelli E., Mastrangelo A.M., Francia E., Marè C., Tondelli A., Stanca A.M. (2008). Drought tolerance improvement in crop plants: An integrated view from breeding to genomics. Field Crops Res. 105: 1–14 [Google Scholar]
- Charlesworth B. (2010). Evolution. Variation catches a ride. Science 330: 326–327 [DOI] [PubMed] [Google Scholar]
- Charlesworth B., Morgan M.T., Charlesworth D. (1993). The effect of deleterious mutations on neutral molecular variation. Genetics 134: 1289–1303 [DOI] [PMC free article] [PubMed] [Google Scholar]
- Charlesworth B., Nordborg M., Charlesworth D. (1997). The effects of local selection, balanced polymorphism and background selection on equilibrium patterns of genetic diversity in subdivided populations. Genet. Res. 70: 155–174 [DOI] [PubMed] [Google Scholar]
- Chown S.L., Hoffmann A.A., Kristensen T.N., Angilletta M.J., Stenseth N.C., Pertoldi C. (2010). Adapting to climate change: a perspective from evolutionary physiology. Clim. Res. 43: 3–15 [Google Scholar]
- Clark R.M., et al. (2007). Common sequence polymorphisms shaping genetic diversity in Arabidopsis thaliana. Science 317: 338–342 [DOI] [PubMed] [Google Scholar]
- Clausen, J. (1951). Stages in the Evolution of Plant Species. (Ithaca, NY: Cornell University Press). [Google Scholar]
- Cubillos F.A., Coustham V., Loudet O. (2012b). Lessons from eQTL mapping studies: Non-coding regions and their role behind natural phenotypic variation in plants. Curr. Opin. Plant Biol. 15: 192–198 [DOI] [PubMed] [Google Scholar]
- Cubillos F.A., et al. (2012a). Expression variation in connected recombinant populations of Arabidopsis thaliana highlights distinct transcriptome architectures. BMC Genomics 13: 117. [DOI] [PMC free article] [PubMed] [Google Scholar]
- Cutler S.R., Rodriguez P.L., Finkelstein R.R., Abrams S.R. (2010). Abscisic acid: Emergence of a core signaling network. Annu. Rev. Plant Biol. 61: 651–679 [DOI] [PubMed] [Google Scholar]
- Cutter A.D., Choi J.Y. (2010). Natural selection shapes nucleotide polymorphism across the genome of the nematode Caenorhabditis briggsae. Genome Res. 20: 1103–1111 [DOI] [PMC free article] [PubMed] [Google Scholar]
- Dai M., Wang P., Boyd A.D., Kostov G., Athey B., Jones E.G., Bunney W.E., Myers R.M., Speed T.P., Akil H., Watson S.J., Meng F. (2005). Evolving gene/transcript definitions significantly alter the interpretation of GeneChip data. Nucleic Acids Res. 33: e175. [DOI] [PMC free article] [PubMed] [Google Scholar]
- DeCook R., Lall S., Nettleton D., Howell S.H. (2006). Genetic regulation of gene expression during shoot development in Arabidopsis. Genetics 172: 1155–1164 [DOI] [PMC free article] [PubMed] [Google Scholar]
- Des Marais D.L., Juenger T.E. (2010). Pleiotropy, plasticity, and the evolution of plant abiotic stress tolerance. Ann. N. Y. Acad. Sci. 1206: 56–79 [DOI] [PubMed] [Google Scholar]
- Des Marais D.L., McKay J.K., Richards J.H., Sen S., Wayne T., Juenger T.E. (2012). Physiological genomics of response to soil drying in diverse Arabidopsis accessions. Plant Cell 24: 893–914 [DOI] [PMC free article] [PubMed] [Google Scholar]
- Du Z., Zhou X., Ling Y., Zhang Z.H., Su Z. (2010). agriGO: A GO analysis toolkit for the agricultural community. Nucleic Acids Res. 38 (Web Server issue): W64–W70 [DOI] [PMC free article] [PubMed] [Google Scholar]
- Fu J., et al. (2009). System-wide molecular evidence for phenotypic buffering in Arabidopsis. Nat. Genet. 41: 166–167 [DOI] [PubMed] [Google Scholar]
- Gerstein M. (2012). Genomics: ENCODE leads the way on big data. Nature 489: 208. [DOI] [PubMed] [Google Scholar]
- Gompel N., Prud’homme B., Wittkopp P.J., Kassner V.A., Carroll S.B. (2005). Chance caught on the wing: cis-regulatory evolution and the origin of pigment patterns in Drosophila. Nature 433: 481–487 [DOI] [PubMed] [Google Scholar]
- Grundberg E., et al. (2011). Global analysis of the impact of environmental perturbation on cis-regulation of gene expression. PLoS Genet. 7: e1001279. [DOI] [PMC free article] [PubMed] [Google Scholar]
- Holloway B., Luck S., Beatty M., Rafalski J.A., Li B.L. (2011). Genome-wide expression quantitative trait loci (eQTL) analysis in maize. BMC Genomics 12: 336. [DOI] [PMC free article] [PubMed] [Google Scholar]
- Jones F.C., et al. Broad Institute Genome Sequencing Platform & Whole Genome Assembly Team (2012). The genomic basis of adaptive evolution in three spine sticklebacks. Nature 484: 55–61 [DOI] [PMC free article] [PubMed] [Google Scholar]
- Jump A.S., Penuelas J. (2005). Running to stand still: Adaptation and the response of plants to rapid climate change. Ecol. Lett. 8: 1010–1020 [DOI] [PubMed] [Google Scholar]
- Hay A., Tsiantis M. (2010). KNOX genes: Versatile regulators of plant development and diversity. Development 137: 3153–3165 [DOI] [PubMed] [Google Scholar]
- Hellmann I., Ebersberger I., Ptak S.E., Pääbo S., Przeworski M. (2003). A neutral explanation for the correlation of diversity with recombination rates in humans. Am. J. Hum. Genet. 72: 1527–1535 [DOI] [PMC free article] [PubMed] [Google Scholar]
- Hill W.C., Robertson A. (1968). Linkage disequilibrium in finite populations. Theor. Appl. Genet. 38: 226–231 [DOI] [PubMed] [Google Scholar]
- Hoffmann A.A., Rieseberg L.H. (2008). Revisiting the impact of inversions in evolution: From population genetic markers to drivers of adaptive shifts and speciation? Annu. Rev. Ecol. Evol. Syst. 39: 21–42 [DOI] [PMC free article] [PubMed] [Google Scholar]
- Hoekstra H.E., Coyne J.A. (2007). The locus of evolution: Evo devo and the genetics of adaptation. Evolution 61: 995–1016 [DOI] [PubMed] [Google Scholar]
- Horton M.W., et al. (2012). Genome-wide patterns of genetic variation in worldwide Arabidopsis thaliana accessions from the RegMap panel. Nat. Genet. 44: 212–216 [DOI] [PMC free article] [PubMed] [Google Scholar]
- Huang D.Q., Wu W.R., Abrams S.R., Cutler A.J. (2008). The relationship of drought-related gene expression in Arabidopsis thaliana to hormonal and environmental factors. J. Exp. Bot. 59: 2991–3007 [DOI] [PMC free article] [PubMed] [Google Scholar]
- Jeong J.S., Kim Y.S., Baek K.H., Jung H., Ha S.H., Do Choi Y., Kim M., Reuzeau C., Kim J.K. (2010). Root-specific expression of OsNAC10 improves drought tolerance and grain yield in rice under field drought conditions. Plant Physiol. 153: 185–197 [DOI] [PMC free article] [PubMed] [Google Scholar]
- Juenger T.E., Sen S., Bray E., Stahl E., Wayne T., McKay J., Richards J.H. (2010). Exploring genetic and expression differences between physiologically extreme ecotypes: Comparative genomic hybridization and gene expression studies of Kas-1 and Tsu-1 accessions of Arabidopsis thaliana. Plant Cell Environ. 33: 1268–1284 [DOI] [PubMed] [Google Scholar]
- Keurentjes J.J., Fu J., Terpstra I.R., Garcia J.M., van den Ackerveken G., Snoek L.B., Peeters A.J., Vreugdenhil D., Koornneef M., Jansen R.C. (2007). Regulatory network construction in Arabidopsis by using genome-wide gene expression quantitative trait loci. Proc. Natl. Acad. Sci. USA 104: 1708–1713 [DOI] [PMC free article] [PubMed] [Google Scholar]
- Kilian J., Whitehead D., Horak J., Wanke D., Weinl S., Batistic O., D’Angelo C., Bornberg-Bauer E., Kudla J., Harter K. (2007). The AtGenExpress global stress expression data set: Protocols, evaluation and model data analysis of UV-B light, drought and cold stress responses. Plant J. 50: 347–363 [DOI] [PubMed] [Google Scholar]
- Kirkpatrick M. (2010). How and why chromosome inversions evolve. PLoS Biol. 8: e1000501. [DOI] [PMC free article] [PubMed] [Google Scholar]
- Kliebenstein D. (2009). Quantitative genomics: Analyzing intraspecific variation using global gene expression polymorphisms or eQTLs. Annu. Rev. Plant Biol. 60: 93–114 [DOI] [PubMed] [Google Scholar]
- Kreps J.A., Wu Y.J., Chang H.S., Zhu T., Wang X., Harper J.F. (2002). Transcriptome changes for Arabidopsis in response to salt, osmotic, and cold stress. Plant Physiol. 130: 2129–2141 [DOI] [PMC free article] [PubMed] [Google Scholar]
- Li Y., Alvarez O.A., Gutteling E.W., Tijsterman M., Fu J.J., Riksen J.A., Hazendonk E., Prins P., Plasterk R.H., Jansen R.C., Breitling R., Kammenga J.E. (2006). Mapping determinants of gene expression plasticity by genetical genomics in C. elegans. PLoS Genet. 2: e222. [DOI] [PMC free article] [PubMed] [Google Scholar]
- Lovell J.T., Juenger T.E., Michaels S.D., Lasky J.R., Platt A., Richards J.H., Xuhong Y., Easlon H.M., Sen S., McKay J.K. (2013). Pleiotropy of FRIGIDA enhances the potential for multivariate adaptation. Proc. Biol. Sci. 280: 20131043. [DOI] [PMC free article] [PubMed] [Google Scholar]
- Lowry D.B. (2012). Ecotypes and the controversy over stages in the formation of new species. Biol. J. Linn. Soc. Lond. 106: 241–257 [Google Scholar]
- Lynch M. (2007). The frailty of adaptive hypotheses for the origins of organismal complexity. Proc. Natl. Acad. Sci. USA 104 (suppl. 1): 8597–8604 [DOI] [PMC free article] [PubMed] [Google Scholar]
- Maranville J.C., Luca F., Richards A.L., Wen X.Q., Witonsky D.B., Baxter S., Stephens M., Di Rienzo A. (2011). Interactions between glucocorticoid treatment and cis-regulatory polymorphisms contribute to cellular response phenotypes. PLoS Genet. 7: e1002162. [DOI] [PMC free article] [PubMed] [Google Scholar]
- McGaugh S.E., Heil C.S.S., Manzano-Winkler B., Loewe L., Goldstein S., Himmel T.L., Noor M.A.F. (2012). Recombination modulates how selection affects linked sites in Drosophila. PLoS Biol. 10: e1001422. [DOI] [PMC free article] [PubMed] [Google Scholar]
- McKay J.K., Richards J.H., Mitchell-Olds T. (2003). Genetics of drought adaptation in Arabidopsis thaliana: I. Pleiotropy contributes to genetic correlations among ecological traits. Mol. Ecol. 12: 1137–1151 [DOI] [PubMed] [Google Scholar]
- McKay J.K., Richards J.H., Nemali K.S., Sen S., Mitchell-Olds T., Boles S., Stahl E.A., Wayne T., Juenger T.E. (2008). Genetics of drought adaptation in Arabidopsis thaliana II. QTL analysis of a new mapping population, KAS-1 x TSU-1. Evolution 62: 3014–3026 [DOI] [PubMed] [Google Scholar]
- Nachman M.W. (2001). Single nucleotide polymorphisms and recombination rate in humans. Trends Genet. 17: 481–485 [DOI] [PubMed] [Google Scholar]
- Nordborg M., et al. (2005). The pattern of polymorphism in Arabidopsis thaliana. PLoS Biol. 3: e196. [DOI] [PMC free article] [PubMed] [Google Scholar]
- Oliver R.J., Finch J.W., Taylor G. (2009). Second generation bioenergy crops and climate change: A review of the effects of elevated atmospheric CO2 and drought on water use and the implications for yield. Global Change Biol. Bioenerg. 1: 97–114 [Google Scholar]
- Ossowski S., Schneeberger K., Clark R.M., Lanz C., Warthmann N., Weigel D. (2008). Sequencing of natural strains of Arabidopsis thaliana with short reads. Genome Res. 18: 2024–2033 [DOI] [PMC free article] [PubMed] [Google Scholar]
- Renaut S., Grassa C.J., Yeaman S., Moyers B.T., Lai Z., Kane N.C., Bowers J.E., Burke J.M., and Rieseberg, L.H. (2013). Genomic islands of divergence are not affected by geography of speciation in sunflowers. Nat. Commun. 4: 1827. [DOI] [PubMed]
- Rockman M.V., Skrovanek S.S., Kruglyak L. (2010). Selection at linked sites shapes heritable phenotypic variation in C. elegans. Science 330: 372–376 [DOI] [PMC free article] [PubMed] [Google Scholar]
- Roesti M., Moser D., Berner D. (2013). Recombination in the threespine stickleback genome—Patterns and consequences. Mol. Ecol. 22: 3014–3027 [DOI] [PubMed] [Google Scholar]
- Roux F., Touzet P., Cuguen J., Le Corre V. (2006). How to be early flowering: An evolutionary perspective. Trends Plant Sci. 11: 375–381 [DOI] [PubMed] [Google Scholar]
- Seki M., et al. (2002). Monitoring the expression profiles of 7000 Arabidopsis genes under drought, cold and high-salinity stresses using a full-length cDNA microarray. Plant J. 31: 279–292 [DOI] [PubMed] [Google Scholar]
- Seoighe C., Gehring C., Hurst L.D. (2005). Gametophytic selection in Arabidopsis thaliana supports the selective model of intron length reduction. PLoS Genet. 1: e13. [DOI] [PMC free article] [PubMed] [Google Scholar]
- Shinozaki K., Yamaguchi-Shinozaki K. (2007). Gene networks involved in drought stress response and tolerance. J. Exp. Bot. 58: 221–227 [DOI] [PubMed] [Google Scholar]
- Smith E.N., Kruglyak L. (2008). Gene-environment interaction in yeast gene expression. PLoS Biol. 6: e83. [DOI] [PMC free article] [PubMed] [Google Scholar]
- Smith J.M., Haigh J. (1974). The hitch-hiking effect of a favourable gene. Genet. Res. 23: 23–35 [PubMed] [Google Scholar]
- Snoek L.B., Terpstra I.R., Dekter R., Van den Ackerveken G., Peeters A.J.M. (2012). Genetical genomics reveals large scale genotype-by-environment interactions in Arabidopsis thaliana. Front. Genet. 3: 317. [DOI] [PMC free article] [PubMed] [Google Scholar]
- Stebbins G.L. (1952). Aridity as a stimulus to plant evolution. Am. Nat. 86: 33–44 [Google Scholar]
- Stern D.L., Orgogozo V. (2008). The loci of evolution: How predictable is genetic evolution? Evolution 62: 2155–2177 [DOI] [PMC free article] [PubMed] [Google Scholar]
- Storey J.D., Tibshirani R. (2003). Statistical significance for genomewide studies. Proc. Natl. Acad. Sci. USA 100: 9440–9445 [DOI] [PMC free article] [PubMed] [Google Scholar]
- Tung J., Fédrigo O., Haygood R., Mukherjee S., Wray G.A. (2009). Genomic features that predict allelic imbalance in humans suggest patterns of constraint on gene expression variation. Mol. Biol. Evol. 26: 2047–2059 [DOI] [PMC free article] [PubMed] [Google Scholar]
- Urrutia A.O., Hurst L.D. (2003). The signature of selection mediated by expression on human genes. Genome Res. 13: 2260–2264 [DOI] [PMC free article] [PubMed] [Google Scholar]
- Van Ooijen, J.W. (2006). JoinMap 4: Software for the Calculation of Genetic Linkage Maps in Experimental Populations. (Wageningen, Netherlands: Kyazma). [Google Scholar]
- Verslues P.E., Juenger T.E. (2011). Drought, metabolites, and Arabidopsis natural variation: A promising combination for understanding adaptation to water-limited environments. Curr. Opin. Plant Biol. 14: 240–245 [DOI] [PubMed] [Google Scholar]
- Wagner G.P., Lynch V.J. (2008). The gene regulatory logic of transcription factor evolution. Trends Ecol. Evol. (Amst.) 23: 377–385 [DOI] [PubMed] [Google Scholar]
- Watterson G.A. (1975). On the number of segregating sites in genetical models without recombination. Theor. Popul. Biol. 7: 256–276 [DOI] [PubMed] [Google Scholar]
- West M.A.L., Kim K., Kliebenstein D.J., van Leeuwen H., Michelmore R.W., Doerge R.W., St Clair D.A. (2007). Global eQTL mapping reveals the complex genetic architecture of transcript-level variation in Arabidopsis. Genetics 175: 1441–1450 [DOI] [PMC free article] [PubMed] [Google Scholar]
- Whittaker, R.H. (1975). Communities and Ecosystems. (New York: McMillan). [Google Scholar]
- Wilczek A.M., et al. (2009). Effects of genetic perturbation on seasonal life history plasticity. Science 323: 930–934 [DOI] [PubMed] [Google Scholar]
- Wilkins O., Bräutigam K., Campbell M.M. (2010). Time of day shapes Arabidopsis drought transcriptomes. Plant J. 63: 715–727 [DOI] [PubMed] [Google Scholar]
- Wittkopp P.J., Kalay G. (2012). Cis-regulatory elements: Molecular mechanisms and evolutionary processes underlying divergence. Nat. Rev. Genet. 13: 59–69 [DOI] [PubMed] [Google Scholar]
- Woody J.L., et al. (2011). Gene expression patterns are correlated with genomic and genic structure in soybean. Genome 54: 10–18 [DOI] [PubMed] [Google Scholar]
- Woody J.L., Shoemaker R.C. (2011). Gene expression: Sizing it all up. Front. Genet. 2: 70. [DOI] [PMC free article] [PubMed] [Google Scholar]
- Wray G.A. (2007). The evolutionary significance of cis-regulatory mutations. Nat. Rev. Genet. 8: 206–216 [DOI] [PubMed] [Google Scholar]
- Wray G.A., Hahn M.W., Abouheif E., Balhoff J.P., Pizer M., Rockman M.V., Romano L.A. (2003). The evolution of transcriptional regulation in eukaryotes. Mol. Biol. Evol. 20: 1377–1419 [DOI] [PubMed] [Google Scholar]
- Wright S.I., Andolfatto P. (2008). The impact of natural selection on the genome: Emerging patterns in Drosophila and Arabidopsis. Annu. Rev. Ecol. Evol. Syst. 39: 193–213 [Google Scholar]
- Xu K., Hong P., Luo L.J., Xia T. (2009). Overexpression of AtNHX1, a vacuolar Na+/H+ antiporter from Arabidopsis thaliana, in Petunia hybrida enhances salt and drought tolerance. J. Plant Biol. 52: 453–461 [Google Scholar]
- Yang L., Gaut B.S. (2011). Factors that contribute to variation in evolutionary rate among Arabidopsis genes. Mol. Biol. Evol. 28: 2359–2369 [DOI] [PubMed] [Google Scholar]
- Yue Y.S., Zhang M.C., Zhang J.C., Tian X.L., Duan L.S., Li Z. (2012). Overexpression of the AtLOS5 gene increased abscisic acid level and drought tolerance in transgenic cotton. J. Exp. Bot. 63: 3741–3748 [DOI] [PMC free article] [PubMed] [Google Scholar]
- Zhang X., Cal A.J., Borevitz J.O. (2011). Genetic architecture of regulatory variation in Arabidopsis thaliana. Genome Res. 21: 725–733 [DOI] [PMC free article] [PubMed] [Google Scholar]
- Zhang X., Richards E.J., Borevitz J.O. (2007). Genetic and epigenetic dissection of cis regulatory variation. Curr. Opin. Plant Biol. 10: 142–148 [DOI] [PubMed] [Google Scholar]