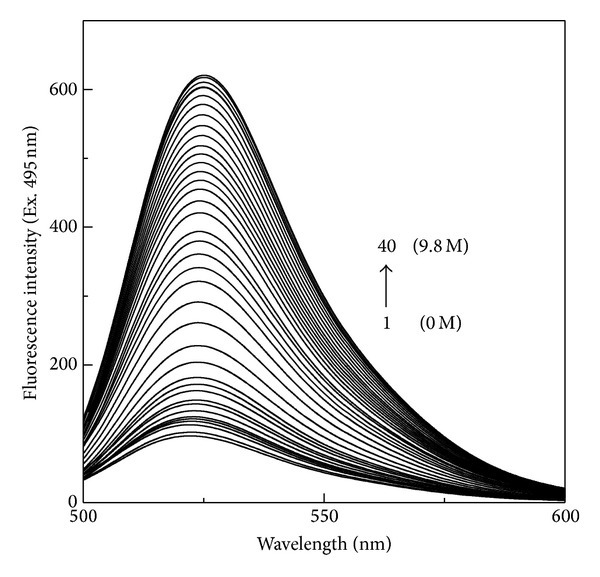
Figure 2.

Fluorescence spectra of 0.50 μM FITC-BSA in the absence and presence of increasing urea concentrations upon excitation at 495 nm. The urea concentrations (1 → 40) were 0, 0.5, 1.0, 1.5, 2.0, 2.5, 3.0, 3.5, 3.8, 4.0, 4.2, 4.4, 4.6, 4.75, 4.8, 5.0, 5.2, 5.4, 5.6, 5.8, 6.0, 6.2, 6.4, 6.6, 6.8, 7.0, 7.2, 7.4 7.6, 7.8, 8.0, 8.25, 8.5, 8.75, 9.0, 9.3, 9.4, 9.5, 9.7, and 9.8 M.
