

Abstract
The zinc-responsive transcriptional activator Zap1 regulates the expression of both high- and low-affinity zinc uptake permeases encoded by the ZRT1 and ZRT2 genes. Zap1 mediates this response by binding to zinc-responsive elements (ZREs) located within the promoter regions of each gene. ZRT2 has a remarkably different expression profile in response to zinc compared to ZRT1. While ZRT1 is maximally induced during zinc limitation, ZRT2 is repressed in low zinc but remains induced upon zinc supplementation. In this study, we determined the mechanism underlying this paradoxical Zap1-dependent regulation of ZRT2. We demonstrate that a nonconsensus ZRE (ZRT2 ZRE3), which overlaps with one of the ZRT2 transcriptional start sites, is essential for repression of ZRT2 in low zinc and that Zap1 binds to ZRT2 ZRE3 with a low affinity. The low-affinity ZRE is also essential for the ZRT2 expression profile. These results indicate that the unusual pattern of ZRT2 regulation among Zap1 target genes involves the antagonistic effect of Zap1 binding to a low-affinity ZRE repressor site and high-affinity ZREs required for activation.
Keywords: metalloregulation, yeast, zinc
Introduction
Large groups of genes are often coregulated by the same transcription factor (Schena et al, 1995; DeRisi et al, 1997). While this allows networks of genes to be simultaneously turned on or off in response to a single environmental change, the regulation observed at different target promoters often differs. For example, although Pho4 is the primary regulator of both PHO5 and PHO8, the dynamic range of PHO8 expression is ∼10-fold less (Munsterkotter et al, 2000). Differential expression of coregulated genes can result from a variety of mechanisms. The number, positioning and affinity of the binding sites located within a promoter can all affect the strength of induction or repression (Struhl, 1989). Many recent studies have also demonstrated the importance of chromatin remodeling at promoters and how the extent of remodeling can influence expression level (Kadam and Emerson, 2002; Narlikar et al, 2002). A large number of genes are additionally subject to a combinatorial control by multiple regulatory factors (Lee et al, 2002). Consequently, the regulation observed at two coregulated promoters can differ because additional factor(s) regulate one promoter and not the other. Finally, the post-translational control of a factor by multiple signaling pathways can result in the factor being able to activate only a subset of its target genes in response to a single signaling pathway (Barolo and Posakony, 2002; Zeitlinger et al, 2003). Thus, while a transcription factor can regulate a large cohort of genes, many mechanisms exist that allow the fine-tuning of individual gene expression, such that each target gene is expressed at its own optimal level. In this report, we describe a novel mechanism for differentially regulating genes in yeast involved in zinc homeostasis.
Zinc is essential for the growth of all cells; however, too much zinc is also toxic. It is therefore essential that cells respond rapidly to changes in zinc levels. In Saccharomyces cerevisiae, this is primarily achieved by the transcriptional regulation of a number of genes encoding zinc transporters. During zinc limitation, the transcriptional activator Zap1 induces the expression of three uptake systems encoded by the ZRT1, ZRT2 and FET4 genes (Zhao and Eide, 1996a, 1996b; Waters and Eide, 2002) and vacuolar zinc influx and efflux transporters encoded by the ZRC1 and ZRT3 genes, respectively (MacDiarmid et al, 2000, 2002).
Zap1 mediates the transcriptional response by binding in a site-specific manner to 11 bp zinc-responsive elements (ZREs) located in the promoter regions of all Zap1 target genes. Zap1 contains seven C2H2 zinc-finger domains, five of which are essential for ZRE recognition and binding (Zhao et al, 1998; Bird et al, 2000a; Evans-Galea et al, 2003). The remaining two C2H2 zinc fingers are located within an activation domain, designated AD2. Zap1 activity is regulated at multiple levels by zinc. At a transcriptional level, Zap1 induces the expression of its own gene. At a post-translational level, both Zap1 DNA-binding activity and activation domain function are potentially regulated by zinc (Bird et al, 2000b). Recent studies have demonstrated that AD2 is autonomously regulated by zinc and that the two zinc-finger domains located within AD2 are essential for this regulation (Bird et al, 2003). Another activation domain, designated AD1, is also zinc regulated; however, this requires the presence of the Zap1 DNA-binding domain (Bird et al, 2000b).
Although Zap1 is the primary regulator of ZRT1, ZRT2, ZRT3 and ZRC1, the expression profile of each gene in response to zinc differs. The most striking difference is observed for ZRT2. We have found that ZRT2 expression is repressed during severe zinc limitation when other Zap1 targets are maximally expressed. Moreover, while other Zap1 target genes are off in zinc-replete cells, ZRT2 expression remains elevated in a Zap1-dependent manner (Zhao and Eide, 1996b). Thus, a paradox exists in that ZRT2 expression is repressed under conditions when other Zap1 target genes are induced and, conversely, is induced under conditions when other Zap1 target genes are not expressed. In this report, we investigate the mechanism by which Zap1 regulates the expression of ZRT2. We demonstrate that Zap1 can activate ZRT2 expression by binding to two high-affinity ZREs and also repress ZRT2 expression by binding to a third low-affinity ZRE located 3′ of the TATA box.
Results
ZRT2 is repressed under zinc-deficient conditions
The ZRT1 and ZRT2 genes are both activated by the Zap1 transcription factor through Zap1-responsive ZRE promoter elements (Zhao et al, 1998). Although Zap1 regulates both genes, a comparison of ZRT1 and ZRT2 mRNA levels using S1 nuclease protection analysis revealed that the zinc-responsive expression profiles of each gene greatly differ (Figure 1). As expected from previous results (Zhao and Eide, 1996a), ZRT1 expression is maximally induced during severe zinc limitation (lane 2) and is shut off on addition of zinc to the media (lanes 3–8). The levels of calmodulin encoding CMD1 mRNA are shown as a loading control. Expression of CMD1 is not affected by zinc availability (Lyons et al, 2000). Unlike the regulation observed at the ZRT1 promoter, ZRT2 expression is repressed during zinc deficiency (lanes 2 and 3) and increases as the levels of zinc increase (lanes 4–6). Thus, the Zap1-dependent expression profiles of ZRT1 and ZRT2 differ in two ways. First, ZRT2 expression is repressed during severe zinc deficiency and, second, ZRT2 remains induced under zinc-replete conditions.
Figure 1.
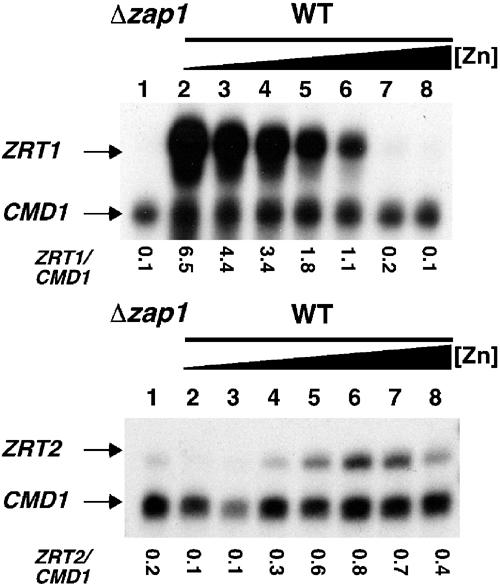
Regulation of ZRT1 and ZRT2 transcription in response to zinc. Total RNA was extracted from exponential-phase cultures of the zap1 mutant strain ZHY6 grown in LZM media supplemented with 3000 μM Zn2+ (lane 1) and from the wild-type strain, DY1457, grown in LZM media supplemented with 3, 10, 30, 100, 300, 1000 and 3000 μM Zn2+ (lanes 2–8, respectively). The levels of ZRT1 and ZRT2 mRNA were compared to the loading control CMD1 mRNA using S1 nuclease protection assays.
Mapping a repressing ZRE within the ZRT2 promoter
One explanation for the results described above is that a repressor binds to the ZRT2 promoter under zinc-limiting conditions and inhibits Zap1 activity. If this model is correct, then deletion of the repressor-binding site from the ZRT2 promoter should result in the induction of ZRT2 under zinc-limiting conditions, that is, the regulation should resemble that observed for other Zap1 target genes. To identify such a site, truncations and deletions were made in a ZRT2–lacZ reporter construct, which contained both of the characterized ZREs (ZRE1 and ZRE2). Repression of ZRT2 expression under severely zinc-limiting conditions was still observed upon deletion of the nucleotides upstream of ZRE1 (Δ −312 to −1047) or ZRE2 (Δ −263 to −1047) (data not shown). (All numbers are relative to the first base of the initiation ATG codon, which is designated as +1.) Further internal deletions that removed the nucleotide sequence between ZRE2 and the predicted TATA box (Δ −202 to −251 or Δ −145 to −201) also had no effect on ZRT2–lacZ reporter activity (data not shown). Consequently, additional internal deletions were made to examine whether a putative repressor-binding site was located between the predicted TATA box sequence motif and the translational start site (Figure 2A). Deletion of the nucleotides between −91 and −112 resulted in a significant derepression corresponding to an ∼7.5-fold increase in reporter activity during severe zinc limitation (line b). Transversion mutations to the nucleotides −102 to −111 also led to an ∼7.5-fold increase under zinc-limiting conditions (line d). A smaller increase (∼4.5-fold) was noted when the adjacent nucleotides (−101 to −91) were mutated (line c). Thus, a repressor site is located within nucleotides −91 to −111.
Figure 2.
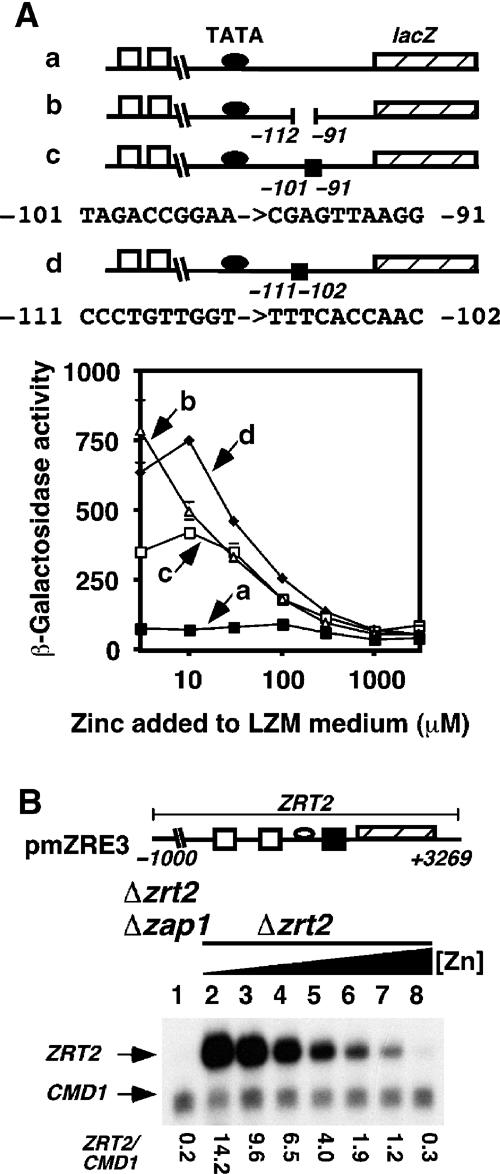
Mapping the repressor binding site. (A) The indicated reporter constructs were transformed into wild-type DY1457. All cultures were grown to exponential phase in LZM media supplemented with the indicated amount of Zn2+. β-Galactosidase activity was measured in triplicate by standard procedures. The numbers shown indicate the internal deletion end points. All numbers are relative to the first base of the initiation codon of lacZ, which is designated as +1. ZRE elements (open box), the TATA box (filled oval) and the lacZ gene (hatched box) are shown. (B) The single-copy plasmid pmZRE3 was introduced into the zap1 zrt2 mutant strain ZHY11 and the zrt2 mutant strain ZHY2. Total RNA was extracted from exponential-phase cultures of ZHY11 pmZRE3 that had been grown in LZM media supplemented with 3000 μM Zn2+ (lane 1) and from ZHY2 pmZRE3 grown in LZM media supplemented with 3, 10, 30, 100, 300, 1000 and 3000 μM Zn2+ (lanes 2–8, respectively). The levels of ZRT2 mRNA were compared to the loading control CMD1 mRNA using S1 nuclease protection assays.
To confirm that this site was required for repression at the ZRT2 locus, the −102 to −111 transversion substitutions were introduced into a construct that contained the ZRT2 open reading frame, promoter and terminator sequences (pmZRE3) (Figure 2B). When pmZRE3 was introduced into a zrt2 mutant strain, ZRT2 expression was maximally induced during severe zinc deficiency (lane 2) and decreased as the levels of zinc increased (lanes 3–8). Thus, mutation of these nucleotides leads to loss of repression and causes the ZRT2 promoter to show ZRT1-like regulation.
Zap1 binds to ZRE3 with a low affinity
The sequence of the −91 to −111 region was searched for known consensus elements. A ZRE-like sequence was found at positions −102 to −112. An alignment of this sequence, designated ZRT2 ZRE3, with the consensus ZRE and other characterized ZREs from the ZRT1 and ZRT2 promoters is shown in Figure 3A. Although the sequence differs from any known ZRE (Lyons et al, 2000), introduction of ZRT2 ZRE3 into a minimal CYC1–lacZ fusion construct was sufficient to confer zinc-responsive activation under zinc-limiting conditions (Figure 3B). However, the maximum level of expression was significantly lower than that which other characterized ZREs (ZRT1 ZRE1, ZRT2 ZRE1 or ZRT2 ZRE2) conferred on the minimal CYC1 promoter.
Figure 3.
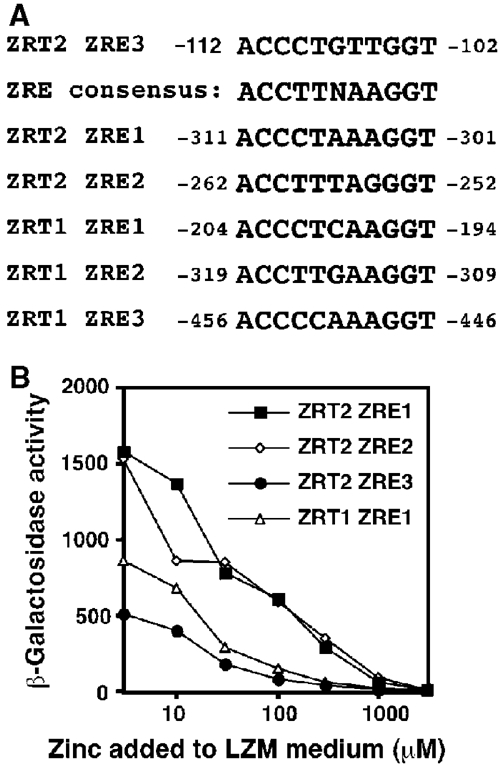
Identification of ZRE3 in the ZRT2 promoter. An alignment of ZRT2 ZRE3 with the consensus ZRE and other known ZRE elements from the ZRT1 and ZRT2 promoters (A). The numbers indicate the first and last nucleotides of each element. (B) The activity of the minimal promoter reporter constructs pDg2, pDg–ZRE1, pDg–ZRE2 and pZRT2 ZRE3 was examined in the wild-type strain DY1457. The constructs contain the ZRT1 ZRE1, ZRT2 ZRE1, ZRT2 ZRE2 and ZRT2 ZRE3 inserted into a minimal CYC1 promoter, respectively. All cultures were grown to exponential phase in LZM media supplemented with the indicated amount of Zn2+. β-Galactosidase activity was measured in triplicate by standard procedures.
Previous studies demonstrated that the ACC–GGT ends of the ZRE are the most important bases for site-specific Zap1 binding in vitro (Evans-Galea et al, 2003). They also revealed that mutations to the central five nucleotides of the ZRE result in an ∼10-fold reduction in Zap1 binding affinity (Evans-Galea et al, 2003). The deviance of the central 5 bp of ZRT2 ZRE3 from other known ZREs suggested that Zap1 could bind to ZRT2 ZRE3 with a low affinity in vivo. Consistent with this hypothesis, overexpression of ZAP1 in cells containing the minimal ZRE3–CYC1–lacZ fusion gene described in Figure 3B yielded similar β-galactosidase activity as cells containing the ZRT1 ZRE1–CYC1–lacZ fusion gene (data not shown). To test whether ZRT2 ZRE3 is a low-affinity ZRE, we used EMSA to determine the binding affinity of Zap1 for ZRT2 ZRE3 in vitro. Reactions were set up containing a ZRT2 ZRE3 oligonucleotide probe and increasing concentrations of purified Zap1642–880, a truncated form of Zap1 that contains the functional DNA-binding domain (Bird et al, 2000b). Similar reactions were set up using a ZRT1 ZRE1 oligonucleotide probe. The percentage of complex formation (as determined by the loss of free probe) was plotted against protein concentration (Figure 4A, the EMSA data are shown in Supplementary Figure 1). The apparent dissociation constants (Kd) (as measured at 50% protein–DNA complex) for the Zap1–ZRT1 ZRE1 and Zap1–ZRT2 ZRE3 complexes were 3.1 and 45.3 nM, respectively. Thus, Zap1 binds to ZRT2 ZRE3 with an approximate 10-fold lower affinity in vitro.
Figure 4.
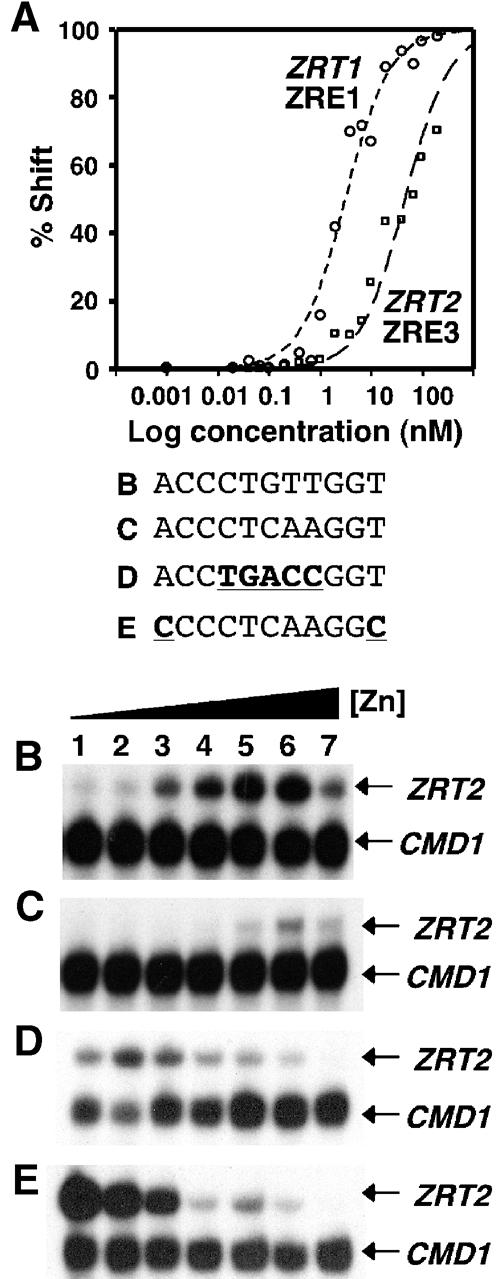
Zap1 binds to ZRT2 ZRE3 with a low affinity in vitro and in vivo. Electrophoretic mobility shift assays were performed with increasing amounts of purified Zap1642–880 protein ranging from 1 pM to 1 μM, a constant radiolabeled ZRE concentration and the ZRE oligonucleotide probes ZRT1 ZRE1 or ZRT2 ZRE3. (A) Binding isotherm plots were generated by quantifying phosphorimages of the ZRT1 ZRE1 and ZRT2 ZRE3 EMSA. A representative experiment for each oligonucleotide probe is shown. (B) The plasmid pYCpZRT2 or derivatives containing the indicated ZREs (C–E) were introduced into the zrt2 mutant strain ZHY2. Total RNA was extracted from exponential-phase cultures of ZHY2 grown in LZM media supplemented with 3, 10, 30, 100, 300, 1000 and 3000 μM Zn2+ (lanes 1–7, respectively). The levels of ZRT2 mRNA were compared to the loading control CMD1 mRNA using S1 nuclease protection assays.
Our results indicate that Zap1 binds to the ZRT2 ZRE3 with a reduced affinity. Therefore, in vivo, lower levels of Zap1 should bind to ZRE3 relative to a high-affinity ZRE if Zap1 levels were not saturating. To test this model, ZRE3 in the context of the ZRT2 promoter was replaced with ZREs of different affinities and ZRT2 regulation was examined in a zrt2 mutant strain over a range of zinc levels (Figure 4B–E). Introduction of the high-affinity ZRE (ZRT1 ZRE1) resulted in an overall decrease in ZRT2 expression (Figure 4C). Moreover, ZRT2 expression was fully repressed at LZM100 (Figure 4C, lane 4), a media condition where the wild-type ZRT2 promoter was induced (Figure 4B). Replacement of ZRE3 with a known low-affinity ZRE (Evans-Galea et al, 2003) resulted in maximal ZRT2 expression at low zinc levels (Figure 4D, lane 2), while substitutions that replaced the critical A–T ends of the ZRE led to complete loss of repression under zinc-limiting conditions (Figure 4E, lanes 1–3). Thus, these data are consistent with Zap1 binding with a lower affinity to ZRT2 ZRE3 relative to ZRT1 ZRE1 in vivo. These data also suggest that the affinity of ZRT2 ZRE3 for Zap1 is critical in determining the profile for ZRT2 repression.
Repression via ZRE3 can modulate transcription factors other than Zap1
The regulation at ZRT2 is unique in that Zap1 acts as both a transcriptional activator and repressor on the same promoter. It was therefore possible that zinc-responsive repression at ZRE3 was specific to Zap1 bound to upstream ZREs. To test this hypothesis, a binding site (Rap1UAS) for the Rap1 activator was introduced into a minimal ZRT2 promoter that lacked both high-affinity ZREs (pRap1UAS). As expected, Rap1 induced ZRT2 expression in the absence of Zap1 (Figure 5A, panel b). Due to the poor ability of the zap1 zrt2 mutant strain to grow under zinc-limiting steady-state conditions, a media shift experiment was used to investigate whether Zap1 could repress activation by Rap1 (Figure 5B). Both the zrt2 and zap1 zrt2 mutant strains containing pRap1UAS were grown to logarithmic phase in zinc-replete media before cells were transferred to zinc-deficient media and grown for a further 3 or 5 h. S1 nuclease analysis in these strains revealed that ZRT2 expression could be fully repressed in the presence, but not in the absence, of Zap1. This result confirms that Zap1 is essential for repression. In the presence of Zap1, Rap1-mediated ZRT2 expression is repressed under zinc-limitation and is maximally induced under zinc-replete conditions (Figure 5A (panel b) and B). This repression is also dependent upon Zap1 binding to ZRE3, as this repression is not observed when ZRE3 is mutated (Figure 5A, panel c). Repression of basal ZRT2 expression under zinc-limiting conditions is also observed in a minimal ZRT2 promoter fusion that lacks ZRE1 and ZRE2 (Figure 5A, panel d). This result suggests that even the basal level of Zap1-independent ZRT2 expression is subject to zinc-responsive repression. Thus, Zap1 bound to ZRE3 can repress the activity of other transcriptional activators.
Figure 5.
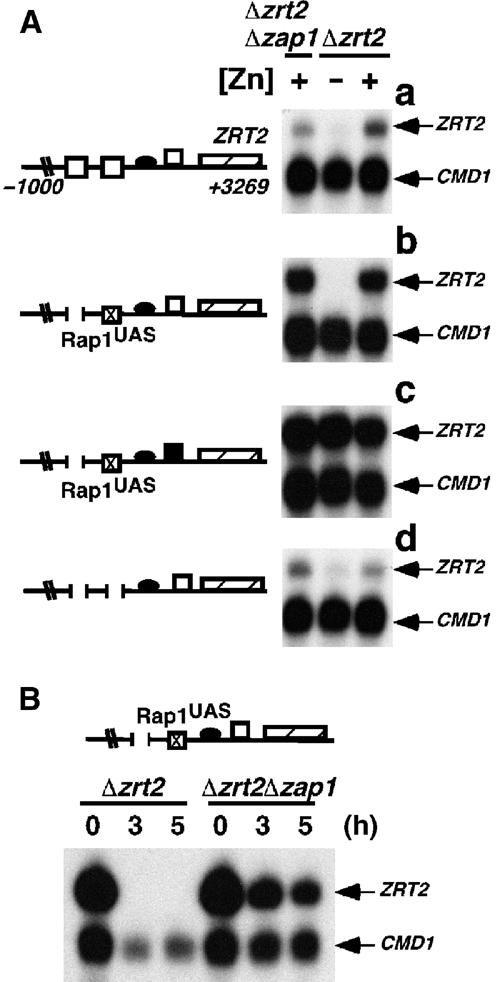
Repression via ZRE3 is active on transcription factors other than Zap1. The plasmid pYCpZRT2 or derivatives containing the indicated deletion/substitution mutations were introduced into the zrt2 mutant strain ZHY2 or the zap1 zrt2 mutant strain ZHY11. Total RNA was extracted from exponential-phase cultures of ZHY11 grown in LZM media supplemented with 3000 μM Zn2+ and from ZHY2 grown in LZM media supplemented with 3 or 3000 μM Zn2+ (−Zn and +Zn, respectively) (A) or from cells that had been pregrown to exponential phase in SC media before transfer to LZM media supplemented with 3 μM Zn2+ for a further 0, 3 or 5 h (B). The levels of ZRT2 mRNA were compared to the loading control CMD1 mRNA using S1 nuclease protection assays. The ZRT2 ZREs (open boxes), ZRT2 TATA box (closed oval), Rap1 UAS (boxed ‘X') and ZRT2 open reading frame (hatched box) are shown. A closed box indicates the disruption of ZRE3 by transversion mutations. Numbers indicate ZRT2 sequence end points.
The ZRT2 transcriptional start site is located within ZRE3
ZRE3 is positioned 101 nucleotides upstream of the translational start site and 26 bp downstream of a putative TATA box sequence motif (TATATA). Consistent with this motif being the binding site of the TATA-binding protein, replacement of the TATATA motif with the sequence TTTTTT in the plasmid pmZRE3 led to the total loss of ZRT2 expression (data not shown). As ZRE3 is located downstream of the TATA box, Zap1 could act as a repressor by inhibiting transcriptional initiation. One potential mechanism by which this could be achieved is by Zap1 occluding access to the transcriptional start site. Therefore, the start site of transcription for ZRT2 was determined using S1 nuclease protection analysis. Two S1 nuclease products were identified using a 75 bp primer (P1) that was complementary to the ZRT2 promoter between nucleotide positions −105 and −31, one of which partially overlapped with ZRE3 (Figure 6A, P1 ZRT2). The major product was just smaller than 75 bp in size, thus mapping the 5′ end of the longest ZRT2 transcript to ZRT2 ZRE3. A less abundant shorter product was also detected. Both S1 nuclease products were also detected when ZRT2 expression was placed under the control of the activator Rap1 (Figure 6A, pRap1UAS). However, the second transcriptional start site was used in preference to the transcriptional start site that overlaps with ZRE3. Primer extension analysis was used to confirm the position of the transcriptional start sites. A minor product that resulted from termination 83 nucleotides upstream of the translation initiation ATG codon was observed (data not shown). While this site mapped the position of the second transcriptional start site, we detected no primer extension product that would map the precise 5′ end of the longest ZRT2 mRNA.
Figure 6.
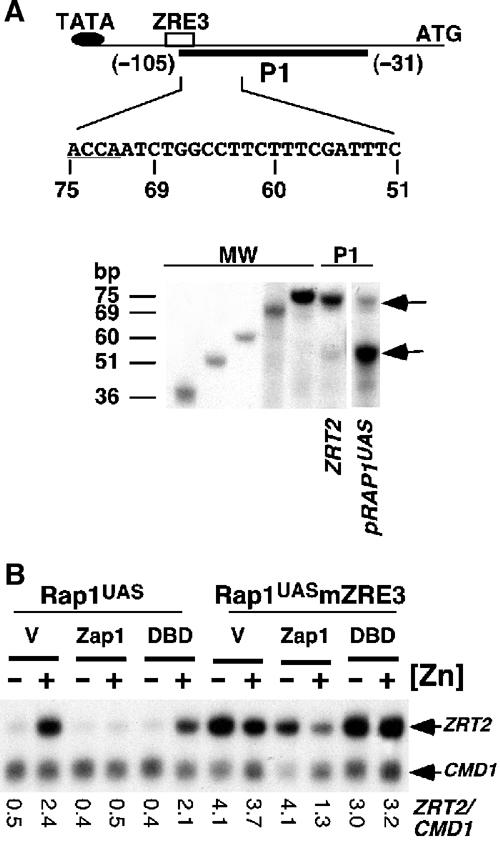
S1 nuclease protection analyses of the 5′ end of ZRT2 mRNA. Total RNA from wild-type DY1457 (ZRT2) cells or from zrt2 mutant cells containing pRap1UAS that had been grown to exponential phase in LZM media supplemented with 300 or 3 μM Zn2+, respectively, was subject to S1 nuclease analysis using probe P1 (A). The 75 bp P1 probe is complementary to nucleotides −31 to −105 in the ZRT2 promoter and partially overlaps with ZRE3. The position of the 5′ end of ZRT2 mRNA was estimated by comparing the sizes of the S1 nuclease products (P1) to products of known size (MW). The sequence of the 5′ end of P1 is shown. The nucleotides that are complementary to ZRE3 (underlined) and the positions of the 5′ end of the S1 nuclease products of size 51, 60, 69 or 75 bp are indicated. Arrows indicate the protected S1 nuclease products that map the 5′ ends of the mRNA. (B) The plasmids pMA424 (V), pGBD–Zap11–880 (Zap1) or pGBD–Zap1642–880 (DBD) were introduced into the strain ZHY2 containing either pRap1UAS (see Figure 5A, panel b) or pRap1UASmZRE3 (see Figure 5A, panel c). Cells were grown in LZM media supplemented with 3 or 1000 μM Zn2+ (−Zn and +Zn, respectively) and S1 nuclease protection assays were performed as described before.
To determine whether repression is caused by steric occlusion of factors required for transcriptional initiation or whether repression requires recruitment of additional corepressors, we examined the ability of the Zap1 DNA-binding domain to act alone as a transcriptional repressor. Overexpression of Zap1 leads to constitutive DNA-binding activity in vivo irrespective of zinc levels (A Bird, D Eide and D Winge, unpublished data). Thus, if Zap1 represses ZRT2 expression by simply binding to ZRE3 and sterically hindering binding of the transcriptional machinery, then overexpression of the Zap1 DNA-binding domain should be sufficient to repress transcription of pRap1UAS under zinc-replete conditions. Due to the significantly smaller size of the Zap1 DNA-binding domain relative to the full-length Zap1, the activity of pRap1UAS was examined in cells expressing either the full-length Zap1 fused to the Gal4 DNA-binding domain (GBD–Zap11–880) or the Zap1 DNA-binding domain fused to the Gal4 DNA-binding domain (GBD–Zap1642–880). This latter construct contains only domains involved in DNA interactions and likely do not interact with general corepressors. When overexpressed from the ADH1 promoter, GBD–Zap11–880 (Zap1) was able to repress fully pRap1UAS transcription under +Zn conditions (Figure 6C). Under similar conditions, the GBD–Zap1642–880 fusion (DBD) only minimally repressed pRap1UAS expression. The difference in repression was not a result of protein levels, as the smaller GBD–Zap1642–880 fusion accumulates to higher levels than GBD–Zap11–880 (data not shown). Moreover, repression was a direct result of the Zap1 fusion proteins binding to ZRE3, as repression was not observed in the absence of ZRE3 (Rap1UASmZRE3).
Assessing the role of transcriptional corepressors in Zap1-mediated repression
To establish whether Zap1 recruits any known repressor proteins to the ZRT2 promoter, ZRT2 expression was examined in strains that lacked global regulators that frequently mediate repression. Regulation of ZRT2 expression was attenuated in the absence of the Ssn6 repressor or Hos1 histone deacetylase (Figure 7A). A dramatic loss of repression occurred in strains lacking the Hos2 or Hos3 histone deacetylases. No loss of repression or regulation was observed in the absence of the Rpd3 or Hda1 histone deacetylases (data not shown). To investigate whether these changes in ZRT2 expression were caused by global changes in intracellular zinc levels, ZRT1 expression was also examined in each of the mutant strains (Figure 7A). Although ZRT1 expression was not increased in either ssn6, hos1 or hos3 mutants, an increase in ZRT1 expression was observed under both zinc-limiting and -replete conditions in strains lacking Hos2. Thus, chromatin organization mediated by Hos2 may affect the expression of other zinc homeostatic genes.
Figure 7.
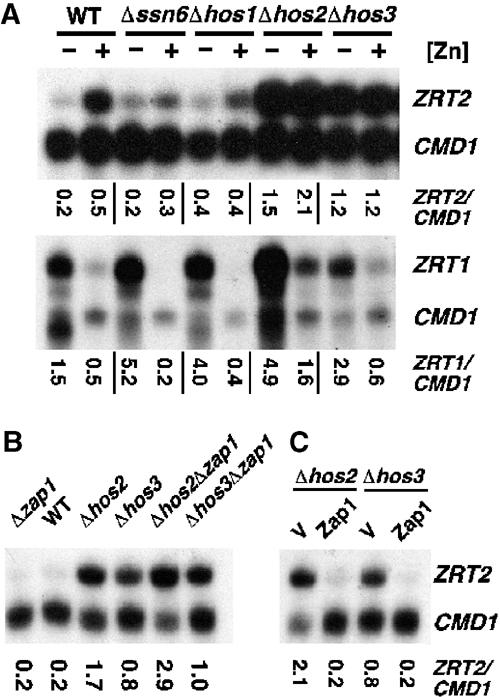
Hos2 or Hos3 loss leads to constitutive ZRT2 activation. Total RNA was extracted from exponential-phase cultures of wild-type strain DY1457, ssn6 mutant strain MAP6, hos1 mutant strain DY6073, hos2 mutant strain DY4549 and hos3 mutant strain DY8363 grown in LZM media supplemented with 3 or 300 μM Zn2+ (−Zn and +Zn, respectively) (A) or the indicated strains grown in LZM media supplemented with 3000 μM Zn2+ (B, C). The hos2 and hos3 mutant strains contained the plasmids pMA424 (V) and pGBD–Zap11−880 (Zap1) in panel C. The levels of ZRT2 and ZRT1 mRNA were compared to the loading control CMD1 mRNA using S1 nuclease protection assays.
As intracellular zinc levels are not perturbed in a hos3 mutant, as shown by ZRT1 expression, we investigated whether Hos3 was recruited to the ZRT2 promoter in a Zap1-dependent manner. At high zinc levels, Zap1 activity in a wild-type cell is inhibited and ZRT2 expression is diminished (Figures 1 (lane 8) and 7B (lane 2)). Under identical conditions, ZRT2 expression is still induced in a hos3 mutant strain, suggesting that Hos3 loss leads to the constitutive activation of the ZRT2 promoter. A similar result is observed in a hos3 zap1 double mutant confirming that Hos3 acts independently of Zap1. The same analyses with hos2 and hos2 zap1 mutants revealed that the loss of Hos2 also leads to Zap1-independent activation of the ZRT2 promoter.
If Zap1 mediates repression by occlusion of ZRE3, then overexpression of ZAP1 could over-ride the effects of either the hos2 or hos3 mutations. Consistent with this model, overexpression of ZAP1 in either the hos2 or hos3 mutant strains causes the repression of the ZRT2 promoter (Figure 7C).
The low affinity of ZRT2 ZRE3 is required for proper ZRT2 regulation and function
Because the ZRT2 gene encodes a low-affinity zinc transporter, its major function is to transport zinc under zinc-replete conditions (Zhao and Eide, 1996b). Thus, the significance of a low-affinity rather than high-affinity repressing ZRE may be to ensure that the levels of Zrt2 are high enough to allow for zinc uptake under these conditions. To test this hypothesis, growth was compared in cells expressing ZRT2 under the control of its own promoter (pYCpZRT2) or the derivative in which ZRE3 was replaced with the high-affinity ZRT1 ZRE1 (pYCpZRT2-H). In the absence of ZRT2, cells compensate by upregulating the expression of their high-affinity zinc uptake system (Zhao and Eide, 1996b). Consequently, cell growth was examined in the zrt1 zrt2 mutant strain ZHY3 that contained pYCpZRT2 or pYCpZRT2-H (Figure 8A). Under mildly zinc-limiting conditions (−), pYCpZRT2 could fully complement the growth defect of ZHY3 while pYCpZRT2-H could only partially complement the growth phenotype. No growth was observed in cells expressing the vector alone. The difference in complementation was less at slightly higher zinc levels (+) and all cells grew equally well at higher zinc levels (++). Thus, the presence of a low-affinity repressing ZRE could ensure that Zrt2 is expressed at a sufficient level for growth under mildly zinc-limiting conditions.
Figure 8.
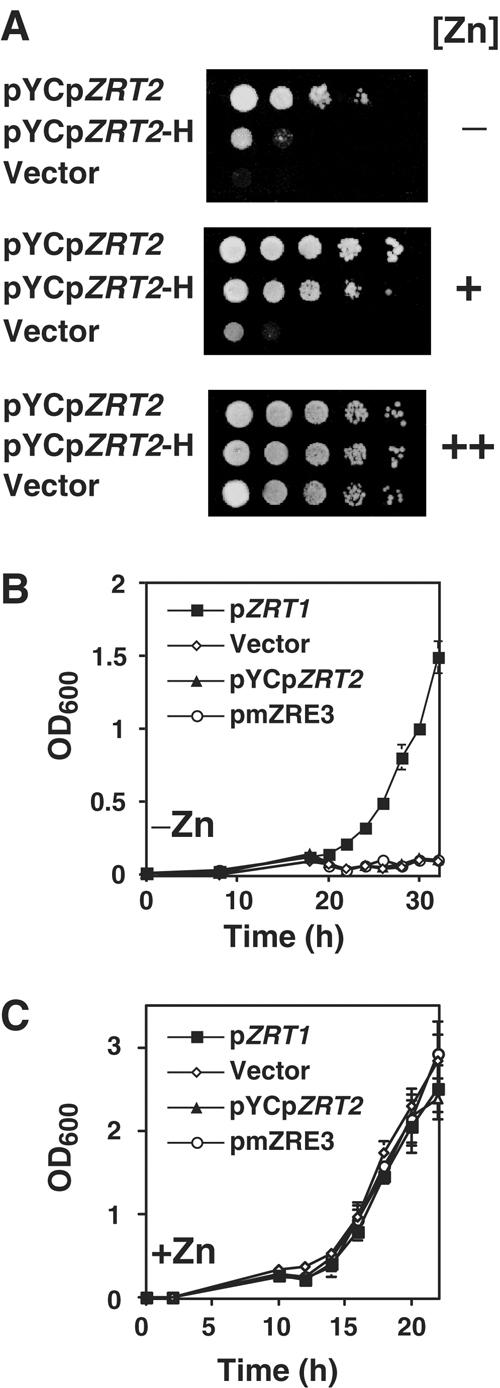
The low affinity of ZRE3 is required for proper ZRT2 regulation and Zrt2 function. (A) The constructs pYCpZRT2, pYCpZRT2-H (a derivative containing ZRE3 replaced with ZRT1 ZRE1) and vector pRS316 were introduced into the zrt1 zrt2 mutant strain ZHY3. In all, 5 μl of a cell suspension (OD600 of 1.0) and 10-fold serial dilutions (left to right) were plated onto SD agar plates supplemented with 1 mM EDTA and 400 μM Zn2+ (−), 1 mM EDTA and 800 μM Zn2+ (+) or 10 μM Zn2+ (++). Plates were incubated for 3 days at 30°C. (B, C) Growth of the zrt1 mutant strain transformed with either pZRT1, pRS316 (vector), pYCpZRT2 (pZRT2) or pmZRE3 in LZM media supplemented with 3 μM Zn2+ (−Zn) or 3000 μM Zn2+ (+Zn). Triplicate cultures were inoculated at an initial A600 of 0.01 and the A600 was measured over time. Results of a representative experiment are shown.
If zinc-limited cells grow better when ZRT2 is expressed at a higher level, why repress it at all? Given that ZRT2 is a low-affinity zinc transporter, one explanation for the repression of ZRT2 under severe zinc-limiting conditions is parsimony; that is if Zrt2 is unable to transport zinc under these conditions, there would be no benefit of producing Zrt2 protein. To address whether Zrt2 could transport zinc under severe zinc-limiting conditions, pmZRE3 was introduced into a zrt1 mutant strain. Cells were then inoculated into zinc-limiting (−Zn) or zinc-replete media (+Zn) (Figure 8B and C). In the absence of the high-affinity zinc transporter Zrt1 (Δzrt1), cells cannot grow under zinc-limiting conditions (vector). This growth defect can be rescued by expression of ZRT1 from a low copy plasmid (pZRT1) but not by expression of ZRT2 from its own promoter (pYCpZRT2) or the mutated ZRT2 promoter that lacks a functional ZRE3 (pmZRE3). This result indicates that Zrt2 cannot transport zinc during severe zinc deficiency. No growth defect was observed in any strain in zinc-replete medium.
Discussion
Studies of many Zap1 target genes like ZRT1 indicated that these genes are induced under zinc-limiting conditions and not expressed in zinc-replete cells (Lyons et al, 2000; MacDiarmid et al, 2000; Waters and Eide, 2002). Regulation of ZRT2, however, was paradoxical. While ZRT2 expression is also largely Zap1 dependent, this gene is expressed at its highest levels in zinc-replete cells (Zhao and Eide, 1996b) and repressed under conditions of zinc deficiency. Our initial hypothesis was that a repressor protein might bind in the ZRT2 promoter in low zinc and attenuate Zap1-dependent activation. Our results strongly support this model and, surprisingly, we found that Zap1 itself is the repressor. Thus, Zap1 plays a unique role in both activating and repressing ZRT2 expression. Zap1 activates transcription through two high-affinity ZREs, ZRE1 and ZRE2, found upstream of the TATA box and represses transcription through the low-affinity ZRE3 located 3′ of the TATA box. The balance between activation and repression dictates the level of ZRT2 expression over a range of zinc concentrations.
An important regulatory feature of the ZRT2 zinc-responsive repression is that Zap1 binds to ZRT2 ZRE3 with low affinity relative to other ZREs. Our results indicate that the low affinity of this site for Zap1 is a critical determinant in dictating the response of the ZRT2 promoter to zinc. First, replacement of ZRE3 with the high-affinity ZRT1 ZRE1 caused repression of ZRT2 expression at all zinc concentrations. Reciprocally, replacement of ZRE3 with an extremely low-affinity ZRE caused maximal activation at much lower zinc levels. Finally, replacement of ZRE3 with the high-affinity ZRE also results in a decreased ability to grow on zinc-limiting media. These data suggest a model for how ZRT2 is regulated over a range of zinc levels. In zinc-replete cells, activation is mediated via Zap1 binding to ZRE1 and ZRE2. As cells become increasingly zinc limited, binding might then occur at ZRE3 to repress activation. This model predicts that Zap1 DNA binding is regulated by zinc. Our preliminary data confirm that DNA occupancy by Zap1 is highly regulated by zinc, which is partly a result of Zap1 protein levels increasing significantly in zinc-deficient cells as a result of the known autoregulation (Zhao et al, 1998).
How might binding of Zap1 at ZRE3 repress transcription of ZRT2? Because ZRE3 is located 3′ of the TATA box and overlaps with one of the ZRT2 transcriptional start sites, Zap1 may function as a repressor by hindering transcription initiation under zinc-limiting conditions. To test this hypothesis, we took advantage of the observation that overexpression of ZAP1 leads to the constitutive binding of Zap1 to ZREs. Under conditions where activation of ZRT2 expression was made constitutive (by replacing the two activating ZRT2 ZREs with a Rap1 UAS or by deleting the Hos2 or Hos3 histone deacetylases), ZAP1 overexpression led to repression. While these data are consistent with the above model, we still cannot eliminate a model in which repression of ZRT2 expression requires recruitment of a corepressor. It is noteworthy that deletion of the 10 bp immediately 3′ of ZRE3 caused an ∼4-fold loss of repression (Figure 3A). If this adjacent region is a binding site for a corepressor, then inhibition of transcriptional initiation of ZRT2 may be dependent on Zap1 and a corepressor. We also note that if repression involves occlusion of transcriptional initiation, then the Zap1 repression complex must attenuate initiation at both transcriptional start sites, as overexpression of ZAP1 effectively repressed expression of pRAP1UAS, which primarily uses a more downstream start site. Our future studies will test whether a corepressor is necessary for the observed repression.
To the best of our knowledge, no examples are known in which a transcriptional activator mediates repression in eucaryotes by binding to sites downstream of the TATA box. In yeast general repressor proteins can bind downstream of the TATA box and repress transcription (Griggs and Johnston, 1991; De Rijcke et al, 1992), while in mammalian cells enhancer elements downstream of TATA remain functional as activators (Banerji et al, 1981; Wasylyk et al, 1983). In procaryotes, many regulatory proteins function as repressors by binding to operator sites located 3′ of the binding site for RNA polymerase (Rojo, 2001). As repression appears to be partially mediated by Zap1 and perhaps another factor occluding the transcriptional start site, then Zap1 exemplifies how a eucaryotic activator can utilize a primarily procaryotic mechanism to repress gene transcription.
Comparing the ZRT2 promoter sequence with those of several closely and distantly related Saccharomyces species (Cliften et al, 2003; Kellis et al, 2003) indicates that the presence and position of all three ZRT2 ZREs are completely conserved among these species. This observation suggests that repression of ZRT2 expression in low zinc via ZRE3 is a conserved feature of ZRT2 regulation. A priori, this is a surprising conclusion. Given that efficient zinc uptake is essential for growth in low zinc, why repress ZRT2 expression during severe zinc deficiency? One simple explanation is that Zrt2 has too low an affinity for its substrate to transport effectively zinc under severe limitation conditions and therefore its expression at these times is of no value to the cell. This mechanism would be analogous to the transcriptional regulation of low- and high-affinity glucose transporters in response to cellular glucose concentration in yeast. For example, expression of HXT1, which encodes a low-affinity glucose transporter, is repressed when glucose is limiting and is induced when glucose is abundant (Ozcan and Johnston, 1999).
Consistent with this hypothesis, expression of ZRT2 under severely zinc-limiting conditions resulted in only poor complementation of the zinc-deficiency growth defect of a Δzrt1 strain. This reduction in growth rate is not simply because the ZRT2 promoter lacking a functional ZRE3 is weaker than the ZRT1 promoter, as placement of ZRT2 under the control of the ZRT1 promoter did not rescue the growth defect of the Δzrt1 strain (data not shown). However, it remains possible that this effect could be a result of the Zrt2 protein being less stable than the Zrt1 protein. We have also considered several alternative explanations for the repression of ZRT2 expression in low zinc. First, repression of ZRT2 may be needed if Zrt2 activity is somehow deleterious to cell growth, for example, by interfering with zinc uptake via Zrt1. However, introduction of pRS316, pYCpZRT2 or pmZRE3 into a zrt2 mutant strain resulted in no growth rate difference between any of the strains under zinc-limiting or -replete conditions (data not shown). Another explanation is suggested by a recent study demonstrating that the vacuolar zinc influx transporter ZRC1 plays an essential role under zinc-limiting conditions. In the absence of Zap1-dependent ZRC1 expression, zinc-starved cells cannot survive the rapid influx of zinc (zinc shock) that occurs when these cells are resupplied with zinc (MacDiarmid et al, 2003). Therefore, an alternative explanation for the repression of ZRT2 under zinc limitation is that high-level expression of a low-affinity, high-capacity zinc transporter could be detrimental to cell growth during zinc-shock conditions. However, high-level expression of ZRT2 under zinc-limiting conditions during zinc shock had no effect on cell growth (data not shown). Finally, zinc uptake by Zrt2 is inhibited by the addition of Fe (II) or Cu (Zhao and Eide, 1996b). Therefore, an alternative scenario to explain ZRT2 repression could be that uptake of iron or copper by Zrt2 under zinc-limiting conditions might be toxic to growth. No growth defect of the zrt2 mutant strain containing pmZRE3 was found following pregrowth under severe zinc limitation and then transfer to media containing high copper, iron or cadmium (data not shown). Although no growth defects were found in these experiments, it is possible that any adverse effects of expressing Zrt2 under severe zinc limitation are either too subtle that they cannot be detected by growth assays or they occur under conditions yet to be identified.
A number of recent studies have demonstrated how a transcriptional activator can become a transcriptional repressor. For example, during osmotic stress, the Hog1 kinase phosphorylates Sko1 allowing the Sko1–Cyc8–Tup1 repressor complex to recruit chromatin-modifying complexes that lead to transcriptional activation (Proft and Struhl, 2002). The Ume6 regulator functions as either an activator or a repressor by an interaction with Ime1 or the Sin3/Rpd3 repressor complex, respectively (Washburn and Esposito, 2001). At the ZRT2 promoter, the transcriptional activator Zap1 functions as a transcriptional repressor by virtue of the positions of ZREs located within the ZRT2 promoter. Importantly, the affinity of Zap1 for the ‘repressing/activating' ZREs ensures that ZRT2 is optimally expressed over a range of zinc concentrations. This study demonstrates the first example of Zap1 acting as a repressor. To the best of our knowledge, this also represents a novel regulatory mechanism in which a single transcription factor serves as both an activator and a repressor to modulate expression of a single gene in response to changing environmental conditions.
Materials and methods
Strains and media
The yeast strains used are described in Table I. All strains are isogenic in the W303 background. Standard genetic methods were used for strain construction (Rothstein, 1991; Wach et al, 1994). Correct modifications were confirmed by PCR or Southern analysis. Strains ABY52 and ABY54 were generated by crosses of ABY9 and DY4549, and ZHY6 and DY8363, respectively. Yeast strains were grown in YP or SD media supplemented with the appropriate auxotrophic requirements and 2% glucose. Low-zinc medium (LZM) was prepared according to Zhao and Eide (1996b). LZM medium contains 1 mM EDTA to control zinc availability and is buffered at pH 4.2 with 20 mM sodium citrate. The estimated concentrations of free zinc in LZM medium supplemented with 1 or 100 μM Zn2+ are ∼0.64 and 64 pM, respectively (Zhao and Eide, 1996b).
Table 1.
Yeast strains used
| Strain | Relevant genotype | Genotype | Source |
|---|---|---|---|
| DY1457 | Wild type | MATα ade6 can1 his3 leu2 trp1 ura3 | Zhao and Eide (1997) |
| ZHY1 | Δzrt1 | MATα ade6 can1 his3 leu2 trp1 ura3 zrt1::LEU2 | Zhao and Eide (1996a) |
| ZHY2 | Δzrt2 | MATα ade6 can1 his3 leu2 trp1 ura3 zrt2::HIS3 | Zhao and Eide (1996b) |
| ZHY3 | Δzrt1 Δzrt2 | MATα ade6 can1 his3 leu2 trp1 ura3 zrt1::LEU2 zrt2::HIS3 | Zhao and Eide (1996b) |
| ZHY6 | Δzap1 | MATα ade6 can1 his3 leu2 trp1 ura3 zap1::TRP1 | Zhao and Eide (1997) |
| ABY9 | Δzap1 | MATα ade6 can1 his3 leu2 trp1 ura3 zap1::KANR | This work |
| ZHY11 | Δzap1 Δzrt2 | MATα ade6 can1 his3 leu2 trp1 ura3 zrt2::HIS3 zap1::KANR | This work |
| MAP6 | Δssn6 | MATa can1 his3 leu2 trp1 ura3 ssn6:: KANR | Proft and Serrano (1999) |
| DY6073 | Δhos1 | MATa ade2 can1 his3 leu2 trp1 ura3 hos1::HIS3 | This work |
| DY4549 | Δhos2 | MATa ade2 can1 his3 leu2 trp1 ura3 hos2::TRP1 | This work |
| DY8363 | Δhos3 | MATa ade2 can1 his3 leu2 trp1 ura3 hos3::KANR | This work |
| ABY52 | Δhos2 Δzap1 | MATa ade6 can1 his3 leu2 trp1 ura3 hos2::TRP1 zap1::KANR | This work |
| ABY54 | Δhos3 Δzap1 | MATa can1 his3 leu2 trp1 ura3 hos3::KANR zap1::TRP1 | This work |
Plasmid construction
All plasmids were confirmed by restriction digestion and sequencing. The construction of pZRT2–lacZ, pDg2, pDg2–ZRE1, pDg2–ZRE2, and pZRT2–lacZΔΔ was described by Zhao et al (1998). pZRT1 (alias pMC5) is a genomic clone containing the ZRT1 locus (Zhao and Eide, 1996a). All internal deletions were created by cloning two overlapping PCR products of the ZRT2 promoter, inclusive of the ZRT2 translational initiation codon, into BamHI/EcoRI-digested pYEp353 (Myers et al, 1986) by homologous recombination (Kunes et al, 1987). PCR products used for homologous recombination were created with primers that had 40 bp of homology with the appropriate vector and 20 bp of homology with the genomic region of interest. Primers were designed such that the ZRT2 translational initiation codon was fused in frame with the eighth codon of the lacZ gene in Yep353. Transformants were selected for their Ura+ prototrophy and plasmids were rescued from yeast using standard procedures. All overlapping PCR products had a minimum of 30 bp overlapping sequence. ZRT2 ZRE3 was inserted into the minimal CYC1 promoter of the vector pNB404 (Bachhawat et al, 1995) by methods described previously (Zhao et al, 1998). For the electrophoretic mobility shift analysis (EMSA), the region encoding Zap1 amino acids 642–880 was PCR amplified using 5′ and 3′ primers that contained added EcoRI and SalI sites. The resulting fragment was inserted into EcoRI–SalI-digested pET32a vector (Novagen). To create pYCpZRT2, the ZRT2 open reading frame inclusive of the 1 kb upstream and downstream sequence was amplified by PCR and the resulting product was introduced into BamHI/HindIII-digested pRS316 (Sikorski and Hieter, 1989) via homologous recombination. Derivatives of the plasmid were all made in a similar manner with the exception that two overlapping PCR products were cotransformed with BamHI/HindIII-digested pRS316. Where appropriate, the plasmids pZRT2–lacZm102–111 (containing transversion mutations to 10 bp of ZRE3) and pZRT2–lacZΔΔ (which lacks both ZRE1 and ZRE2) were used as template for one of the overlapping PCR reactions. The consensus Rap1 site introduced into the vector pZRT2–lacZΔΔ was ACACCCATACACC (Lieb et al, 2001). The construction of the plasmids pGBD–Zap11–880 and pGBD–Zap1642–880, which contain fusions of Zap1 to the Gal4 DNA-binding domain in the vector pMA424 (Ma and Ptashne, 1987), was described by Bird et al (2000b).
β-Galactosidase assays
Cells were grown for 15–20 h to mid-exponential phase (A600 0.3–0.7) in LZM media supplemented with the indicated amount of Zn2+. β-Galactosidase activity was measured as described by Guarente (1983) and activity units were calculated as follows: (ΔA420 × 1000)/(min × ml of culture × absorbance of the culture at 595 nm). For all of the experiments shown, the data points are the means of three replicates and the error bars represent the s.d.
RNA isolation and S1 analysis
RNA was extracted from cells grown to mid-log phase using the hot acidic phenol method. S1 analysis was performed as described previously (Dohrmann et al, 1992). All data were quantified by PhosphorImager Analysis using Quantity One Software before exposure to X-ray film.
Zap1 purification and electrophoretic mobility shift analysis
The Zap1642–880 truncate was purified in the presence of 500 μM ZnCl2 from BL21(DE3)pLysS cells according to the method described by Bird et al (2000a). All 15 μl EMSA reactions contained hybridization mix (65 mM KCl, 0.2 mg/ml bovine serum albumin and 20 mM Tris–HCl, pH 7.3) with 20% glycerol and 0.04% IGEPAL CA630 detergent with end-labeled oligonucleotides probes and protein. The sequence of ZRT1 ZRE1 oligonucleotide was 5′-CCAAAGATACCCTCAAGGTTCTCATCTGTG-3′ and the sequence of the ZRT2 ZRE3 oligonucleotide was CCAAAGATACCCTGTTGGTTCTCATCTGTG. The ZRE has been underlined. EMSA was performed according to the method described by Bird et al (2000a). Phosphorimages of dried gels were obtained and quantified with Quantity One Software. The percentage of complex formation (as determined by loss of free probe DNA) was plotted against concentration on a logarithmic scale to determine apparent KD.
Supplementary Material
Supplementary Figure 1
Acknowledgments
We thank members of the Winge lab for many helpful discussions and suggestions. We also thank Greg Keller and Michelle Mooney for technical assistance during these experiments. This work was supported by grant GM56285 from the National Institutes of Health.
References
- Bachhawat N, Ouyang Q, Henry SA (1995) Functional characterization of an inositol-sensitive upstream activation sequence in yeast. J Biol Chem 270: 25087–25095 [DOI] [PubMed] [Google Scholar]
- Banerji J, Rusconi S, Schaffner W (1981) Expression of a beta-globin gene is enhanced by remote SV40 DNA sequences. Cell 27: 299–308 [DOI] [PubMed] [Google Scholar]
- Barolo S, Posakony JW (2002) Three habits of highly effective signaling pathways: principles of transcriptional control by developmental cell signaling. Genes Dev 16: 1167–1181 [DOI] [PubMed] [Google Scholar]
- Bird A, Evans-Galea MV, Blankman E, Zhao H, Luo H, Winge DR, Eide DJ (2000a) Mapping the DNA binding domain of the Zap1 zinc-responsive transcriptional activator. J Biol Chem 275: 16160–16166 [DOI] [PubMed] [Google Scholar]
- Bird AJ, McCall K, Kramer M, Blankman E, Winge DR, Eide DJ (2003) Zinc fingers can act as Zn2+ sensors to regulate transcriptional activation domain function. EMBO J 22: 5137–5146 [DOI] [PMC free article] [PubMed] [Google Scholar]
- Bird AJ, Zhao H, Luo H, Jensen LT, Srinivasan C, Evans-Galea M, Winge DR, Eide DJ (2000b) A dual role for zinc fingers in both DNA binding and zinc sensing by the Zap1 transcriptional activator. EMBO J 19: 3704–3713 [DOI] [PMC free article] [PubMed] [Google Scholar]
- Cliften P, Sudarsanam P, Desikan A, Fulton L, Fulton B, Majors J, Waterston R, Cohen BA, Johnston M (2003) Finding functional features in Saccharomyces genomes by phylogenetic footprinting. Science 301: 71–76 [DOI] [PubMed] [Google Scholar]
- De Rijcke M, Seneca S, Punyammalee B, Glansdorff N, Crabeel M (1992) Characterization of the DNA target site for the yeast ARGR regulatory complex, a sequence able to mediate repression or induction by arginine. Mol Cell Biol 12: 68–81 [DOI] [PMC free article] [PubMed] [Google Scholar]
- DeRisi JL, Iyer VR, Brown PO (1997) Exploring the metabolic and genetic control of gene expression on a genomic scale. Science 278: 680–686 [DOI] [PubMed] [Google Scholar]
- Dohrmann PR, Butler G, Tamai K, Dorland S, Greene JR, Thiele DJ, Stillman DJ (1992) Parallel pathways of gene regulation: homologous regulators SWI5 and ACE2 differentially control transcription of HO and chitinase. Genes Dev 6: 93–104 [DOI] [PubMed] [Google Scholar]
- Evans-Galea MV, Blankman E, Myszka DG, Bird AJ, Eide DJ, Winge DR (2003) Two of the five zinc fingers in the Zap1 transcription factor DNA binding domain dominate site-specific DNA binding. Biochemistry 42: 1053–1061 [DOI] [PubMed] [Google Scholar]
- Griggs DW, Johnston M (1991) Regulated expression of the GAL4 activator gene in yeast provides a sensitive genetic switch for glucose repression. Proc Natl Acad Sci USA 88: 8597–8601 [DOI] [PMC free article] [PubMed] [Google Scholar]
- Guarente L (1983) Yeast promoters and lacZ fusions designed to study expression of cloned genes in yeast. Methods Enzymol 101: 181–191 [DOI] [PubMed] [Google Scholar]
- Kadam S, Emerson BM (2002) Mechanisms of chromatin assembly and transcription. Curr Opin Cell Biol 14: 262–268 [DOI] [PubMed] [Google Scholar]
- Kellis M, Patterson N, Endrizzi M, Birren B, Lander ES (2003) Sequencing and comparison of yeast species to identify genes and regulatory elements. Nature 423: 241–254 [DOI] [PubMed] [Google Scholar]
- Kunes S, Ma H, Overbye K, Fox MS, Botstein D (1987) Fine structure recombinational analysis of cloned genes using yeast transformation. Genetics 115: 73–81 [DOI] [PMC free article] [PubMed] [Google Scholar]
- Lee TI, Rinaldi NJ, Robert F, Odom DT, Bar-Joseph Z, Gerber GK, Hannett NM, Harbison CT, Thompson CM, Simon I, Zeitlinger J, Jennings EG, Murray HL, Gordon DB, Ren B, Wyrick JJ, Tagne JB, Volkert TL, Fraenkel E, Gifford DK, Young RA (2002) Transcriptional regulatory networks in Saccharomyces cerevisiae. Science 298: 799–804 [DOI] [PubMed] [Google Scholar]
- Lieb JD, Liu X, Botstein D, Brown PO (2001) Promoter-specific binding of Rap1 revealed by genome-wide maps of protein–DNA association. Nat Genet 28: 327–334 [DOI] [PubMed] [Google Scholar]
- Lyons TJ, Gasch AP, Gaither LA, Botstein D, Brown PO, Eide DJ (2000) Genome-wide characterization of the Zap1p zinc-responsive regulon in yeast. Proc Natl Acad Sci USA 97: 7957–7962 [DOI] [PMC free article] [PubMed] [Google Scholar]
- Ma J, Ptashne M (1987) Deletion analysis of GAL4 defines two transcriptional activating segments. Cell 48: 847–853 [DOI] [PubMed] [Google Scholar]
- MacDiarmid CW, Gaither LA, Eide DJ (2000) Zinc transporters that regulate vacuolar zinc storage in Saccharomyces cerevisiae. EMBO J 19: 2845–2855 [DOI] [PMC free article] [PubMed] [Google Scholar]
- MacDiarmid CW, Milanick MA, Eide DJ (2002) Biochemical properties of vacuolar zinc transport systems of Saccharomyces cerevisiae. J Biol Chem 277: 39187–39194 [DOI] [PubMed] [Google Scholar]
- MacDiarmid CW, Milanick MA, Eide DJ (2003) Induction of the ZRC1 metal tolerance gene in zinc-limited yeast confers resistance to zinc shock. J Biol Chem 278: 15065–15072 [DOI] [PubMed] [Google Scholar]
- Munsterkotter M, Barbaric S, Horz W (2000) Transcriptional regulation of the yeast PHO8 promoter in comparison to the coregulated PHO5 promoter. J Biol Chem 275: 22678–22685 [DOI] [PubMed] [Google Scholar]
- Myers AM, Tzagoloff A, Kinney DM, Lusty CJ (1986) Yeast shuttle and integrative vectors with multiple cloning sites suitable for construction of lacZ fusions. Gene 45: 299–310 [DOI] [PubMed] [Google Scholar]
- Narlikar GJ, Fan HY, Kingston RE (2002) Cooperation between complexes that regulate chromatin structure and transcription. Cell 108: 475–487 [DOI] [PubMed] [Google Scholar]
- Ozcan S, Johnston M (1999) Function and regulation of yeast hexose transporters. Microbiol Mol Biol Rev 63: 554–569 [DOI] [PMC free article] [PubMed] [Google Scholar]
- Proft M, Serrano R (1999) Repressors and upstream repressing sequences of the stress-regulated ENA1 gene in Saccharomyces cerevisiae: bZIP protein Sko1p confers HOG-dependent osmotic regulation. Mol Cell Biol 19: 537–546 [DOI] [PMC free article] [PubMed] [Google Scholar]
- Proft M, Struhl K (2002) Hog1 kinase converts the Sko1–Cyc8–Tup1 repressor complex into an activator that recruits SAGA and SWI/SNF in response to osmotic stress. Mol Cell 9: 1307–1317 [DOI] [PubMed] [Google Scholar]
- Rojo F (2001) Mechanisms of transcriptional repression. Curr Opin Microbiol 4: 145–151 [DOI] [PubMed] [Google Scholar]
- Rothstein R (1991) Targeting, disruption, replacement, and allele rescue: integrative DNA transformation in yeast. Methods Enzymol 194: 281–301 [DOI] [PubMed] [Google Scholar]
- Schena M, Shalon D, Davis RW, Brown PO (1995) Quantitative monitoring of gene expression patterns with a complementary DNA microarray. Science 270: 467–470 [DOI] [PubMed] [Google Scholar]
- Sikorski RS, Hieter P (1989) A system of shuttle vectors and host strains designed for efficient manipulation of DNA in Saccharomyces cerevisiae. Genetics 122: 19–27 [DOI] [PMC free article] [PubMed] [Google Scholar]
- Struhl K (1989) Molecular mechanisms of transcriptional regulation in yeast. Annu Rev Biochem 58: 1051–1077 [DOI] [PubMed] [Google Scholar]
- Wach A, Brachat A, Pohlmann R, Philippsen P (1994) New heterologous modules for classical or PCR-based gene disruptions in Saccharomyces cerevisiae. Yeast 10: 1793–1808 [DOI] [PubMed] [Google Scholar]
- Washburn BK, Esposito RE (2001) Identification of the Sin3-binding site in Ume6 defines a two-step process for conversion of Ume6 from a transcriptional repressor to an activator in yeast. Mol Cell Biol 21: 2057–2069 [DOI] [PMC free article] [PubMed] [Google Scholar]
- Wasylyk B, Wasylyk C, Augereau P, Chambon P (1983) The SV40 72 bp repeat preferentially potentiates transcription starting from proximal natural or substitute promoter elements. Cell 32: 503–514 [DOI] [PubMed] [Google Scholar]
- Waters BM, Eide DJ (2002) Combinatorial control of yeast FET4 gene expression by iron, zinc, and oxygen. J Biol Chem 277: 33749–33757 [DOI] [PubMed] [Google Scholar]
- Zeitlinger J, Simon I, Harbison CT, Hannett NM, Volkert TL, Fink GR, Young RA (2003) Program-specific distribution of a transcription factor dependent on partner transcription factor and MAPK signaling. Cell 113: 395–404 [DOI] [PubMed] [Google Scholar]
- Zhao H, Butler E, Rodgers J, Spizzo T, Duesterhoeft S, Eide D (1998) Regulation of zinc homeostasis in yeast by binding of the ZAP1 transcriptional activator to zinc-responsive promoter elements. J Biol Chem 273: 28713–28720 [DOI] [PubMed] [Google Scholar]
- Zhao H, Eide D (1996a) The yeast ZRT1 gene encodes the zinc transporter protein of a high-affinity uptake system induced by zinc limitation. Proc Natl Acad Sci USA 93: 2454–2458 [DOI] [PMC free article] [PubMed] [Google Scholar]
- Zhao H, Eide D (1996b) The ZRT2 gene encodes the low affinity zinc transporter in Saccharomyces cerevisiae. J Biol Chem 271: 23203–23210 [DOI] [PubMed] [Google Scholar]
- Zhao H, Eide DJ (1997) Zap1p, a metalloregulatory protein involved in zinc-responsive transcriptional regulation in Saccharomyces cerevisiae. Mol Cell Biol 17: 5044–5052 [DOI] [PMC free article] [PubMed] [Google Scholar]
Associated Data
This section collects any data citations, data availability statements, or supplementary materials included in this article.
Supplementary Materials
Supplementary Figure 1